


Abstract
Scaling up a shorter preventive regimen such as weekly isoniazid and rifapentine (3HP) for 3 months is a priority for tuberculosis (TB) preventive treatment (TPT). However, there are limited data on 3HP acceptability and completion from high-burden-TB countries.
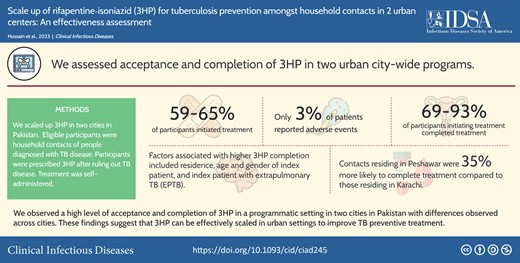
We scaled up 3HP from 2018 to 2021 in 2 cities in Pakistan. Eligible participants were household contacts of persons diagnosed with TB disease. Participants were prescribed 3HP after ruling out TB disease. Treatment was self-administered. We analyzed the proportion who completed 3HP.
In Karachi, we verbally screened 22 054 household contacts of all ages. Of these, 83% were clinically evaluated and 3% were diagnosed with TB. Of household contacts without TB disease, 59% initiated the 3HP regimen, of which 69% completed treatment. In Peshawar, we verbally screened 6389 household contacts of all ages. We evaluated 95% of household contacts, of whom 2% were diagnosed with TB disease. Among those without TB disease, 65% initiated 3HP, of which 93% completed. Factors associated with higher 3HP completion included residence in Peshawar (risk ratio [RR], 1.35 [95% confidence interval {CI}: 1.32–1.37]), index patient being a male (RR, 1.03 [95% CI: 1.01–1.05]), and index patient with extrapulmonary TB compared to bacteriologically positive pulmonary TB (RR, 1.10 [95% CI: 1.06–1.14]). The age of the index patient was inversely associated with completion.
We observed a high level of acceptance and completion of 3HP in programs implemented in 2 cities in Pakistan, with differences observed across the cities. These findings suggest that 3HP can be effectively scaled up in urban settings to improve the reach and impact of TPT.
Rapid reductions in tuberculosis (TB) rates are possible with comprehensive and simultaneous interventions to find, treat, and prevent TB [1]. Thus while programs strive to find missing TB patients, it is also critical to enhance contact tracing around those patients when they are found and provide essential TB preventive treatment (TPT) [2]. Household contacts have an infection prevalence of 30%–50%, of whom 5%–10% may develop TB disease within 2 years after exposure [3–5].
TPT for persons exposed at home to TB is a pillar of TB elimination [6]. For decades, the World Health Organization recommended preventive treatment for child household contacts <5 years of age and for people with human immunodeficiency virus. These guidelines were only recently updated to include all household contacts of patients with bacteriologically confirmed pulmonary TB [7]. Thus, there remains a major implementation gap in delivering TPT in high-TB-burden settings [8–10].
A key challenge cited for this gap is the duration of TPT. However, several shorter TPT regimens are available that can improve acceptance and completion rates, including a 12-dose weekly regimen of isoniazid–rifapentine (3HP) and daily isoniazid–rifapentine for 1 month (1HP) [11–13]. Multiple studies have shown 3HP to be safe and efficacious and to have better completion rates than regimens using isoniazid [14–16]. In high-income countries where TB prevalence is low, 3HP has been successfully implemented with high completion rates [17–19]. However, in high-TB-prevalence settings, data on acceptance and completion of 3HP are sparse, limiting its widespread uptake and implementation [20–22].
Pakistan ranks fifth among high-TB-burden countries globally, with an estimated TB incidence rate of 263 per 100 000 population [2]. In 2019, national TPT uptake for children aged <5 years was only 6% [23]. Previous national guidelines had prioritized TPT in household contacts for only children <5 years of age. The Zero TB Initiative launched a private sector–led program in Karachi, collaborating with the public sector to implement a comprehensive approach to ending TB. This approach included the delivery of TPT to household contacts of all ages using the shorter 3HP regimen [22].
To date, published reports from programs in high-TB-burden settings include <500 persons receiving 3HP [24]. We implemented a pilot intervention that reached nearly 700 persons in the city of Karachi in 2016–2018 [22]. We then implemented 3HP at scale across 2 large cities, Karachi and Peshawar. We sought to assess acceptance and completion of 3HP in those 2 citywide programs.
METHODS
Setting, Study Population, and Procedure
The Zero TB Initiative in Karachi included a population-based program to deliver TPT for household contacts of all TB patients. Over 2 years, this program was expanded to 8 facilities in Karachi. In 2018 the same population-based TPT program was initiated in Peshawar and expanded to 5 more facilities by 2019. Further details are provided in the Supplementary Appendix.
All household contacts visiting the facility were screened for symptoms, were evaluated clinically, and had a chest radiograph. Sputum examination using Xpert MTB/RIF assay (Cepheid, Sunnyvale, California) was conducted for those able to expectorate sputum. Household contacts in whom TB disease was ruled out and who were >2 years of age were offered 3HP; those <2 years of age were offered 6 months of daily isoniazid. TPT was given to all household contacts regardless of TB infection status, aligned with Pakistan’s National TB Program guidelines [23].
Adverse event (AE) documentation was adapted from “How to Care for People Exposed to Drug-Resistant Tuberculosis: A Practical Guide” [25]. A clinical expert panel of infectious disease specialists, pulmonologists, and epidemiologists was assembled to support the clinical management of persons taking 3HP. Last, rifapentine was not yet registered in Pakistan—as is the case across multiple high-TB-burden countries [26]—and considerable efforts were spent with the Pakistan drug regulatory authority for its importation and exemptions for use.
Outcomes
We assessed acceptance and completion following a best-practices framework [27]. We constructed a cascade of care that traced individuals through each step of the contact tracing and TPT process: (1) enumeration of household contacts per index patient; (2) number of people evaluated for TB disease; (3) number of people eligible for 3HP; (4) number of people who initiated 3HP; and (5) number of people who completed 3HP.
Treatment completion was assessed using pharmacy records and defined as an individual taking at least 11 of 12 doses of 3HP (>90%) within 16 weeks of treatment initiation [28].
Statistical Analysis
We calculated the proportion of individuals completing each step of the cascade and then calculated the cumulative probability of an individual completing all 4 steps by multiplying the proportions as conditional probabilities. The χ² test was used to test the statistical significance for the cumulative probability of completing all 4 steps, with a P value < .05 considered significant. To assess safety, we calculated the proportion of individuals with AEs among those initiating 3HP.
We analyzed factors associated with 3HP treatment completion among those who started the regimen using a generalized linear model (Poisson regression) with robust standard errors to account for clustering at the household level.
RESULTS
In Karachi, between quarter 1 of 2018 and quarter 1 of 2021, we verbally screened 22 054 household contacts of all ages (26% of all identified household contacts; Table 1, Figure 1A). Demographics are shown in Table 1. We evaluated 18 287 individuals (83%), of whom 476 (3%) were diagnosed with TB disease. Of the remaining individuals, 10 548 (59%) were started on TPT, and 7281 (69%) of those completed the treatment (Table 2). The overall probability of treatment completion was 33%, ranging from 27% to 37% for different age groups (Supplementary Figure 1). Of those who started 3HP, 369 (4%) reported experiencing 556 AEs (Table 3). No serious (grade 3 or 4) AEs were reported.
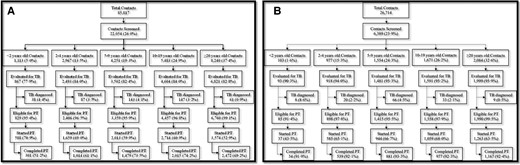
A, Tuberculosis preventive treatment (TPT) cascade for household contacts in Karachi. B, TPT cascade for tuberculosis (TB) household contacts in Peshawar.
Baseline Demographic and Clinical Characteristics of Household Contacts of Patients With Drug-Susceptible Tuberculosis in Karachi From Quarter 1 2018 to Quarter 1 2021 (N = 22 054)
| Characteristic | Age Group | P Value | |||||
|---|---|---|---|---|---|---|---|
| <2 y | 2–4 y | 5–9 y | 10–19 y | ≥20 y | Total | ||
| Demographics | (n = 1113) | (n = 2967) | (n = 4251) | (n = 5483) | (n = 8240) | (n = 22 054) | – |
| Sex, female | 526 (47.3) | 1417 (47.8) | 2022 (47.6) | 2825 (51.5) | 4684 (56.8) | 11 474 (52.0) | <.001 |
| Age, y, median (IQR) | 1 (1) | 3 (2–4) | 7 (6–8) | 13 (11–16) | 33 (25–42) | 13 (0–98) | – |
| TB history | (n = 662) | (n = 1814) | (n = 2396) | (n = 3151) | (n = 4401) | (n = 12 424) | – |
| Contacts on TB treatment | 0 (0) | 0 (0) | 0 (0) | 2 (0.1) | 2 (0.1) | 4 (0.03) | .598 |
| Contacts with TB history | 0 (0) | 2 (0.1) | 4 (0.2) | 13 (0.4) | 29 (0.7) | 48 (0.4) | .001 |
| Clinical symptoms | (n = 1108) | (n = 2952) | (n = 4234) | (n = 5467) | (n = 8234) | (n = 21 995) | – |
| Cough | 243 (21.9) | 516 (17.5) | 701 (16.6) | 694 (12.7) | 605 (7.3) | 2759 (12.5) | <.001 |
| Fever | 168 (15.2) | 348 (11.8) | 462 (10.9) | 403 (7.4) | 270 (3.3) | 1651 (7.5) | <.001 |
| Weight loss | 68 (6.1) | 202 (6.8) | 301 (7.1) | 247 (4.5) | 222 (2.7) | 1040 (4.7) | <.001 |
| Night sweats | 9 (0.8) | 32 (1.1) | 60 (1.4) | 40 (0.7) | 15 (0.2) | 156 (0.7) | <.001 |
| Diagnosed with TB diseasea | 38 (4.4) | 87 (3.5) | 143 (4.1) | 147 (3.2) | 61 (0.9) | 476 (2.6) | <.001 |
Data are presented as No. (%) unless otherwise indicated.
Abbreviations: IQR, interquartile range; TB, tuberculosis.
Percentage calculated out of those who were completely evaluated for TB disease.
Contact Management Cascade and Coverage by City From Quarter 1 2018 to Quarter 1 2021
| Indicator | Labela | Karachi | Peshawar | Total | P Value |
|---|---|---|---|---|---|
| Contacts eligible | A | 85 817 | 26 714 | 112 531 | – |
| Contacts evaluated | B | 18 287 | 6082 | 24 369 | – |
| Contacts started preventive treatment | C | 10 548 | 3888 | 14 436 | – |
| Treatment complete | D | 7281 | 3598 | 10 879 | – |
| Evaluation coverage | B/A | 21.3% | 22.8% | 21.7% | <.001 |
| Preventive treatment coverage | C/A | 12.3% | 14.6% | 12.8% | <.001 |
| Preventive treatment completion rate | D/C | 69.0% | 92.5% | 75.4% | <.001 |
| Overall coverage | D/A | 8.5% | 13.5% | 9.7% | <.001 |
This column is a label column marking cells that are used for following rows.
Adverse Events Reported Among Household Contacts Treated With Weekly Isoniazid and Rifapentine for 3 Months, by City, From Quarter 1 2018 to Quarter 1 2021
| Symptom | Karachi (n = 9960) | Peshawar (n = 3851) | ||
|---|---|---|---|---|
| No. | (%) | No. | (%) | |
| Contacts with any adverse events | 369 | (3.7) | 92 | (2.4) |
| Total adverse events | 556 | – | 178 | – |
| Dizziness | 96 | (17.3) | 12 | (6.7) |
| Nausea | 90 | (16.2) | 14 | (7.9) |
| Vomiting | 77 | (13.8) | 30 | (16.9) |
| Fever | 45 | (8.1) | 24 | (13.5) |
| Abdominal pain | 36 | (6.5) | 25 | (14.0) |
| Weakness | 33 | (5.9) | 0 | (0.0) |
| Agitation/anxiety | 31 | (5.6) | 5 | (2.8) |
| Headache | 24 | (4.3) | 5 | (2.8) |
| Reduced appetite | 22 | (4.0) | 8 | (4.5) |
| Change in urine color | 18 | (3.2) | 0 | (0.0) |
| Rash | 17 | (3.1) | 39 | (21.9) |
| Joint pain | 17 | (3.1) | 0 | (0.0) |
| Vertigo | 16 | (2.9) | 14 | (7.9) |
| Body pain | 9 | (1.6) | 0 | (0.0) |
| Diarrhea | 6 | (1.1) | 1 | (0.6) |
| Burning urination | 6 | (1.1) | 0 | (0.0) |
| Cough | 5 | (0.9) | 0 | (0.0) |
| Difficulty breathing | 3 | (0.5) | 0 | (0.0) |
| Jaundice | 3 | (0.5) | 0 | (0.0) |
| Chest pain | 2 | (0.4) | 0 | (0.0) |
| Vision problem | 0 | (0.0) | 1 | (0.6) |
In Peshawar in the same period, we verbally screened 6389 household contacts of all ages (24% of all identified household contacts; Table 4, Figure 1B). Demographics are shown in Table 4. We evaluated 6082 individuals (95%), of whom 136 (2%) were diagnosed with TB disease. Of the remaining individuals, 3888 (65%) were started on TPT, and 3598 (93%) of those completed the treatment (Table 2). The overall probability of treatment completion was 56%, ranging from 33% to 59% for different age groups (Supplementary Figure 2). Of those who started 3HP, 92 (2%) contacts reported experiencing 178 AEs (Table 3). There were no serious (grade 3 or 4) AEs reported.
Baseline Demographic and Clinical Characteristics of Household Contacts of Index Patients With Drug-Susceptible Tuberculosis in Peshawar From Quarter 1 2018 to Quarter 1 2021 (n = 6389)
| Characteristic | Age Group | P Value | |||||
|---|---|---|---|---|---|---|---|
| <2 y | 2–4 y | 5–9 y | 10–19 y | ≥20 y | Total | ||
| Demographic | (n = 103) | (n = 977) | (n = 1554) | (n = 1671) | (n = 2084) | (n = 6389) | – |
| Sex, female | 52 (50.5) | 469 (48.0) | 766 (49.4) | 856 (51.2) | 1260 (60.5) | 3403 (53.2) | <.001 |
| Age, y, median (IQR) | 1 (1) | 3 (2–4) | 7 (6–8) | 13 (11–16) | 32 (25–40) | 12 (0–90) | – |
| TB history | (n = 98) | (n = 943) | (n = 1509) | (n = 1630) | (n = 2042) | (n = 6222) | – |
| Contacts on TB treatment | 0 (0) | 0 (0) | 0 (0) | 1 (0.1) | 1 (0.1) | 2 (0.03) | .839 |
| Contacts with TB history | 0 (0) | 0 (0) | 0 (0) | 1 (0.1) | 2 (0.1) | 3 (0.04) | .394 |
| Clinical symptoms | (n = 103) | (n = 977) | (n = 1554) | (n = 1671) | (n = 2084) | (n = 6389) | – |
| Cough | 13 (12.6) | 69 (7.1) | 102 (6.6) | 82 (4.9) | 56 (2.7) | 322 (5.0) | <.001 |
| Fever | 9 (8.7) | 48 (4.9) | 88 (5.7) | 60 (3.6) | 24 (1.2) | 229 (3.6) | <.001 |
| Weight loss | 9 (8.7) | 33 (3.4) | 71 (4.6) | 45 (2.7) | 11 (0.5) | 169 (2.6) | <.001 |
| Night sweats | 8 (7.8) | 31 (3.2) | 65 (4.2) | 40 (2.4) | 6 (0.3) | 150 (2.3) | <.001 |
| Diagnosed with TB diseasea | 8 (8.6) | 20 (2.2) | 66 (4.5) | 33 (2.1) | 9 (0.5) | 136 (2.2) | <.001 |
Data are presented as No. (%) unless otherwise indicated.
Abbreviations: IQR, interquartile range; TB, tuberculosis.
Percentage calculated out of those who were completely evaluated for TB disease.
The evaluation coverage (21% vs 23%), TPT coverage (12% vs 15%), and overall coverage (9% vs 14%) were statistically different between Karachi and Peshawar, respectively (Table 2).
In multivariable regression, household contacts <2 years of age and contacts of extrapulmonary TB were less likely to complete clinical evaluation if verbally screened and less likely to initiate preventive treatment if eligible (Table 5). Compared to residents of Karachi, those in Peshawar were more likely to complete these steps of the cascade.
Factors Associated With Completion of Clinical Evaluation and Initiation of Preventive Treatment Among Household Contacts
| Characteristic | Unadjusted | Adjusted | ||||
|---|---|---|---|---|---|---|
| RR | (95% CI) | P Value | RR | (95% CI) | P Value | |
| Completing clinical evaluation (if verbally screened) | ||||||
| City | ||||||
| Peshawar | 1.06 | (1.06–1.07) | <.001 | 1.06 | (1.05–1.06) | <.001 |
| Contact sex | ||||||
| Male | 0.99 | (.99–1.00) | .43 | 0.99 | (.99–1.00) | .68 |
| Contact age group | ||||||
| <2 y | 0.95 | (.94–.96) | <.001 | 0.96 | (.95–.98) | <.001 |
| 2–4 y | 0.99 | (.99–1.00) | .67 | 0.99 | (.98–1.00) | .45 |
| 5–9 y | 0.99 | (.98–1.00) | .14 | 0.99 | (.98–.99) | .11 |
| 10–19 y | 1.00 | … | 1.00 | … | ||
| ≥20 y | 0.99 | (.98–1.00) | .07 | 0.99 | (.98–1.00) | .08 |
| Index sex | ||||||
| Male | 1.00 | (.99–1.01) | .16 | 1.00 | (.99–1.00) | .14 |
| Index age group | ||||||
| <2 y | 0.98 | (.97–1.00) | .09 | 0.98 | (.97–1.00) | .16 |
| 2–4 y | 0.99 | (.98–1.00) | .08 | 0.99 | (.98–1.00) | .18 |
| 5–9 y | 1.01 | (1.00–1.02) | <.001 | 1.01 | (1.01–1.02) | <.001 |
| 10–19 y | 1.00 | … | 1.00 | … | ||
| ≥20 y | 0.99 | (.98–.99) | .03 | 0.99 | (.99–1.00) | .18 |
| Index TB type | ||||||
| Pulmonary TB (bacteriologically confirmed) | 1.00 | … | 1.00 | … | ||
| Pulmonary TB (clinically diagnosed) | 0.99 | (.99–1.00) | .33 | 1.01 | (1.00–1.01) | <.001 |
| Extrapulmonary TB | 0.97 | (.96–.97) | <.001 | 0.98 | (.97–.99) | <.001 |
| Initiating preventive treatment (if eligible) | ||||||
| City | ||||||
| Peshawar | 1.06 | (1.05–1.07) | <.001 | 1.03 | (1.02–1.04) | <.001 |
| Contact sex | ||||||
| Male | 0.99 | (.99–1.00) | .84 | 0.99 | (.98–1.00) | .49 |
| Contact age group | ||||||
| 2–4 y | 0.94 | (.93–.95) | <.001 | 0.94 | (.92–.95) | <.001 |
| 5–9 y | 0.98 | (.97–.99) | .03 | 0.98 | (.97–1.00) | .06 |
| 10–19 y | 1.00 | … | 1.00 | … | ||
| ≥20 y | 0.95 | (.94–.96) | <.001 | 0.95 | (.94–.97) | <.001 |
| Index sex | ||||||
| Male | 0.99 | (.98–1.00) | .09 | 1.00 | (.99–1.01) | .54 |
| Index age group | ||||||
| <2 y | 0.89 | (.86–.91) | <.001 | 0.92 | (.89–.94) | <.001 |
| 2–4 y | 0.93 | (.91–.95) | <.001 | .96 | (.94–.98) | <.001 |
| 5–9 y | 0.93 | (.91–.94) | <.001 | .95 | (.94–.97) | <.001 |
| 10–19 y | 1.00 | … | 1.00 | … | ||
| ≥20 y | 0.99 | (.98–1.00) | .19 | .98 | (.97–.99) | <.001 |
| Index TB type | ||||||
| Pulmonary TB (bacteriologically confirmed) | 1.00 | … | 1.0 | … | ||
| Pulmonary TB (clinically diagnosed) | 0.92 | (.91–.93) | <.001 | 0.94 | (.93–.95) | <.001 |
| Extrapulmonary TB | 0.86 | (.85–.87) | <.001 | 0.87 | (.86–.89) | <.001 |
Abbreviations: CI, confidence interval; RR, risk ratio; TB, tuberculosis.
In multivariable regression, there was no association between occurrence of AEs and 3HP completion (risk ratio [RR], 1.04 [95% confidence interval {CI}: .98–1.10]; Table 5). Factors associated with 3HP completion were residence in Peshawar (RR, 1.35 [95% CI: 1.32–1.37]), index patient being a male (RR, 1.03 [95% CI: 1.01–1.05]), and index patient with extrapulmonary TB compared to bacteriologically positive pulmonary TB (RR, 1.10 [95% CI: 1.06–1.14]). Completion of 3HP among contacts was inversely associated with age of the index patient (Table 6).
Factors Associated With Treatment Completion Among Household Contacts Who Initiated Weekly Isoniazid and Rifapentine for 3 Months
| Characteristic | Unadjusted | Adjusted | ||||
|---|---|---|---|---|---|---|
| RR | (95% CI) | P Value | RR | (95% CI) | P Value | |
| City | ||||||
| Peshawar | 1.29 | (1.27–1.31) | <.001 | 1.35 | (1.32–1.37) | <.001 |
| Contact sex | ||||||
| Male | 1.02 | (1.00–1.04) | .02 | 1.02 | (1.00–1.02) | .07 |
| Contact age group | ||||||
| 2–4 y | 1.01 | (.98–1.05) | .39 | 0.99 | (.96–1.02) | .45 |
| 5–9 y | 1.01 | (.99–1.04) | .35 | 1.00 | (.98–1.03) | .97 |
| 10–19 y | 1.00 | … | 1.00 | … | ||
| ≥20 y | 0.95 | (.93–.97) | <.001 | 0.96 | (.94–.98) | .001 |
| Adverse events | ||||||
| Yes | 0.98 | (.93–1.04) | .53 | 1.04 | (.98–1.10) | .18 |
| Index sex | ||||||
| Male | 1.03 | (1.01–1.05) | .001 | 1.03 | (1.01–1.05) | .001 |
| Index age group | ||||||
| <2 y | 1.09 | (1.04–1.14) | <.001 | 1.16 | (1.10–1.22) | <.001 |
| 2–4 y | 1.04 | (1.01–1.08) | .02 | 1.08 | (1.04–1.12) | <.001 |
| 5–9 y | 1.03 | (1.00–1.05) | .08 | 1.04 | (1.01–1.07) | .004 |
| 10–19 y | 1.00 | … | 1.00 | … | ||
| ≥20 y | 0.91 | (.89–.93) | <.001 | 0.92 | (.90–.94) | <.001 |
| Index TB type | ||||||
| Pulmonary TB (bacteriologically confirmed) | 1.00 | … | 1.00 | … | ||
| Pulmonary TB (clinically diagnosed) | 0.96 | (.94–.98) | <.001 | 1.02 | (.99–1.05) | .17 |
| Extrapulmonary TB | 1.00 | (.97–1.03) | .97 | 1.10 | (1.06–1.14) | <.001 |
Abbreviations: CI, confidence interval; RR, risk ratio; TB, tuberculosis.
DISCUSSION
Our study found high acceptance and completion rates of 3HP among household contacts in 2 urban areas in Pakistan, demonstrating the scale-up of this short TPT regimen to be effective and safe in a programmatic setting. To our knowledge, this is the first report of the scale-up of 3HP in programs serving large urban areas in a high-TB-burden country.
The completion rates we observed were similar to or higher than those observed in randomized trials, observational studies, and other programmatic settings [11, 17, 19, 29–32]. We found that household contacts in Peshawar had significantly higher TPT coverage and completion rates than in Karachi. Notably, compared to Peshawar, Karachi has a 17.5 times larger area and 7.5 times the population. With fewer individuals receiving treatment in a smaller city, counselors and health workers provided robust follow-up services, including additional household visits and medicines delivery to homes when large families could not visit health facilities. Enablers such as transport reimbursements and counseling can support household contacts to complete treatment [33–36].
In both cities, treatment uptake was relatively high among those eligible for TPT. At scale, the major loss in the care cascade was at the first step, namely the screening of contacts to rule out TB disease, which is consistent with other reports in the literature [10, 37]. The program may need to expand the pool of testing facilities with flexible hours where contacts can complete the screening process.
Our study has some limitations; our assessment of treatment completion was based on pharmacy records and self-report or family reports. This could have resulted in an overestimation of adherence. Second, the program conducted systematic clinical follow-ups, without laboratory testing, and thus we used self-reported clinical AEs. The differences in the clinical AEs reported may be due to possible variations in cultural attributes between the cities.
A strength of this study is the diverse settings of the 2 cities and results may be generalizable to other urban centers in South Asia. To generate evidence and inform policymakers within the Ministry of Health, we engaged public and private health facilities. In addition, many health system–strengthening activities were undertaken. New recording and reporting tools for contact management and TPT were introduced when none existed. These interventions are known to be both effective and cost-effective [38].
In conclusion, we successfully scaled up a TPT program in 2 high-TB-burden cities. Our findings have relevant implications for TB prevention globally as programs aim to reach millions of household contacts to achieve the United Nations and End TB targets.
Supplementary Data
Supplementary materials are available at Clinical Infectious Diseases online. Consisting of data provided by the authors to benefit the reader, the posted materials are not copyedited and are the sole responsibility of the authors, so questions or comments should be addressed to the corresponding author.
Notes
Author Contributions. H. H., N. S., M. C. B., S. Ke., A. J. K., and A. A. M. conceptualized the study and wrote the protocol; M. J., S. F., F. M., S. N., S. S. S., N. S., F. A., S. Kh., S. M., J. A. S., and Z. I. collected data under supervision from H. H., A. A. D., M. S., M. C. B., S. Ke., A. J. K., and A. A. M.; H. H., M. J., S. F., and A. A. M. performed and reviewed the analysis; H. H. and A. A. M. wrote the initial draft of the manuscript. All authors helped interpret the findings and read and approved the final version of the manuscript.
Acknowledgments. The authors acknowledge all healthcare workers, patients, and household contacts who participated in this study.
Financial support. The study was supported by a grant from The Global Fund.
References
Author notes
A. J. K. and A. A. M. contributed equally to this work.
Potential conflicts of interest. The authors: No reported conflicts of interest. All authors have submitted the ICMJE Form for Disclosure of Potential Conflicts of Interest.

