


Abstract
Using antibiotics without a prescription is potentially unsafe and may increase the risk of antimicrobial resistance. We evaluated the effect of patient, health system, and clinical encounter factors on intention to use antibiotics without a prescription that were (1) purchased in the United States, (2) obtained from friends or relatives, (3) purchased abroad, or (4) from any of these sources.
The survey was performed January 2020–June 2021 in 6 publicly funded primary care clinics and 2 private emergency departments in Texas, United States. Participants included adult patients visiting 1 of the clinical settings. Nonprescription use was defined as use of antibiotics without a prescription; intended use was professed intention for future nonprescription antibiotic use.
Of 564 survey respondents (33% Black and 47% Hispanic or Latino), 246 (43.6%) reported prior use of antibiotics without a prescription, and 177 (31.4%) reported intent to use antibiotics without a prescription. If feeling sick, respondents endorsed that they would take antibiotics obtained from friends/relatives (22.3% of 564), purchased in the United States without a prescription (19.1%), or purchased abroad without a prescription (17.9%). Younger age, lack of health insurance, and a perceived high cost of doctor visits were predictors of intended use of nonprescription antibiotics from any of the sources. Other predictors of intended use were lack of transportation for medical appointments, language barrier to medical care, Hispanic or Latino ethnicity, and being interviewed in Spanish.
Patients without health insurance who report a financial barrier to care are likely to pursue more dangerous nonprescription antimicrobials. This is a harm of the US fragmented, expensive healthcare system that may drive increasing antimicrobial resistance and patient harm.
The use of antibiotics without a prescription (nonprescription use) can contribute to rising rates of antimicrobial resistance, one of the most serious threats to public health [1, 2]. At the individual level, important safety issues related to nonprescription antibiotic use include potential adverse drug reactions, drug interactions, diagnostic delays, masking of underlying infectious processes, superinfection, and disruption of the microbiome [3]. In our 2019 review of literature on nonprescription use in the United States, 31 studies reported the practice of obtaining antibiotics from local markets or ethnic stores, other countries, friends and relatives, and previously prescribed courses (leftover antibiotics); nonprescription antibiotic use was prevalent in all racial and ethnic groups [4]. Despite the considerable increase in awareness of antibiotic resistance in the past 2 decades, only 1 published intervention tried to decrease this unsafe practice in the United States; unfortunately, this led to increased acquisition of antibiotics without a prescription [5]. An in-depth, theory-driven exploration of the factors that drive nonprescription antibiotic use is an important precursor to future interventions [6, 7].
Relevant data have been scarce, limited to previous qualitative studies [8, 9]. A focus group study including immigrants mostly from Mexico found that participants’ previous experiences in countries with few restrictions on antibiotic acquisition influenced the acquisition of antibiotics in the United States. [8]. In another study, Latino community members reported that lack of health insurance, monetary constraints, and long waiting periods in the clinics were barriers to a physician visit [9]. In summary, previous studies were limited to Spanish speakers, included mainly Latin American immigrants with low levels of education, and mostly used qualitative research approaches. These prior studies did not examine the independent effects of patient factors (eg, health literacy), healthcare system factors (eg, access to care), or clinical encounter factors (eg, patient-provider communication) on the intention to use antibiotics without a prescription.
We surveyed patients about nonprescription antibiotic use while also measuring patient, clinical encounter, and healthcare system factors (Figure 1). We assessed the relationship between these factors and intended nonprescription use from 3 different antibiotic sources: antibiotics purchased in the United States without a prescription, antibiotics purchased abroad without a prescription, and antibiotics obtained from friends or relatives. Finally, we looked at the relationship among these factors and intended nonprescription use in general (combining all 3 categories of antibiotic sources into 1 for the purpose of this analysis).
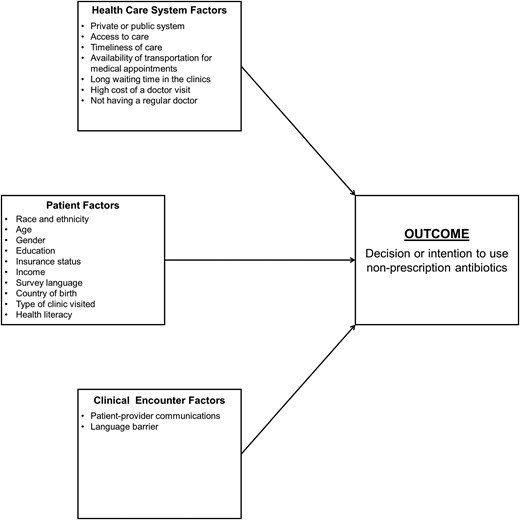
Mapping of the potential predictors of nonprescription antibiotic use to the Kilbourne Conceptual Framework of Health Disparities Research.
METHODS
The survey was conducted between January 2020 and June 2021 in the waiting rooms of 6 primary care clinics (continuity and same-day access) and 2 private emergency departments. Patients visiting these settings are ethnically and socioeconomically diverse. The primary care clinics are part of a public healthcare delivery system in a major urban area (Harris County, Houston, Texas), and the 2 emergency departments belong to a private practice network in a suburban area (Katy, Texas). Our multistage sampling design was selected to ensure economic, educational, racial, ethnic, and linguistic diversity.
The clinic staff gave a flyer to every patient who checked in for a primary care visit. The flyer introduced the study and asked the patient to approach or call the study research coordinator if interested. Research coordinators were present in the waiting areas to conduct the survey in person when permitted during the coronavirus disease 2019 (COVID-19) pandemic; in the months March 2020–May 2021, coordinators were excluded from waiting areas, and interviews were performed by phone after the patient had left the clinic. The survey interviews were completed anonymously in the respondent's preferred language (English or Spanish) while the research coordinator read the questions aloud and noted the participant's answers. As a reference point for discussing antibiotics, each respondent was provided a list of brand and generic names accompanied by color photos of commonly used antibiotics in the United States and Latin American countries. Participants were offered a payment of $15. Individuals younger than age 18 years and those unable to answer the survey questions were excluded. The study was approved by the Baylor College of Medicine institutional review board.
Survey Instrument
The survey instrument is available in the Appendix (see Appendix Survey Questions). Nonprescription use is defined as the consumption of antibiotics that were not prescribed to that individual for his or her current health condition; intended use is defined as a professed intention for future nonprescription antibiotic use [4]. Respondents were classified as nonprescription users if they reported having ever taken oral antibiotics without a prescription. Intended use of nonprescription antibiotics was measured by the question, “If you were feeling sick, would you take antibiotics in the following situations without contacting a doctor/nurse/dentist/clinic?” The situations presented to the participants were as follows: (1) you can buy antibiotics without a prescription in the United States; (2) friends or relatives give you antibiotics; and (3) you can buy antibiotics without a prescription in another country. Survey questions were mapped to factors in the Kilbourne conceptual framework of health disparities research (Figure 1). To inform development of an intervention to reduce nonprescription antibiotic use, we used the Kilbourne framework, which lays out a sequential process of detection, understanding, and reducing health disparities [10]. Our study focused on the first 2 phases (detection and understanding of health disparities) by identifying the determinants at patient, clinical encounter, and healthcare system levels.
For insurance status, we considered patients who rely on unique payor sources (Medicaid or county assistance) as uninsured for the purpose of these analyses. Those who did not have insurance or a unique payor source were classified as self-pay.
Question on overall health status, was derived from the Consumer Assessment of Healthcare Providers and Systems surveys [11]. Patient factors included age, sex, race and ethnicity, education, household income, health insurance status, and country of birth (Table 1).
Sociodemographic Characteristics of Respondents (n = 564)
| Characteristic | Value |
|---|---|
| Mean age, y (standard deviation) | 49.7 (13.6) |
| No. (%) of female respondents | 407 (72.2) |
| No. (%) of respondents of race and ethnicity | |
| African American or Black | 186 (33.0) |
| Hispanic or Latina/Latino | 263 (46.6) |
| Othera | 26 (4.6) |
| Non-Hispanic White | 89 (15.8) |
| No. (%) of respondents with education level | |
| Less than high school | 92 (16.3) |
| High school or GED | 225 (39.9) |
| Some college and above | 247 (43.8) |
| No. (%) of respondents with insurance status | |
| Private, Medicare | 207 (36.7) |
| Medicaid, Harris Health Financial Assistance programb | 319 (56.6) |
| Self-pay | 38 (6.7) |
| No. (%) of patients vising public vs. private healthcare system | |
| Private | 155 (27.5) |
| Public | 409 (72.5) |
| No. (%) of patients attending various clinic types | |
| Continuity clinic | 218 (38.7) |
| Emergency department | 155 (27.5) |
| Walk in clinic | 191 (33.8) |
| No. of respondents with income/total no. of respondents (%) | |
| <$20 000 | 254/564 (45.0) |
| ≥$20 000 but <$40 000 | 98/564 (17.4) |
| ≥$40 000 but <$60 000 | 34/564 (6.0) |
| ≥$60 000 but <$100 000 | 23/564 (4.1) |
| ≥$100 000 | 37/564 (6.6) |
| Don’t know/prefer not to say | 118/564 (20.9) |
| No. (%) of questionnaires completed in Spanish | 155 (27.5) |
| No. (%) of respondents born in the United States/Other | |
| United States | 360 (63.8) |
| Otherc | 204 (36.2) |
| Median years lived in United States for the respondents born in other countries (y) (range) | 23.0 (0–58) |
| No. (%) of respondents reporting use or intention to use nonprescription antibiotics | |
| Reported prior nonprescription use | 246 (43.6) |
| Reported intention to use nonprescription antibiotics | 177 (31.4) |
| Overall health statusd mean (standard deviation) | 3.3 (1.1) |
| No. (%) of respondents who completed survey | |
| Before COVID-19 pandemic | 198 (35.1) |
| During COVID -19 pandemic | 366 (64.9) |
Abbreviations: COVID-19, coronavirus disease 2019; GED, general educational development.
Includes: 10 Asian, 10 self-reported as multiracial or multiethnic, 4 American Indian, 2 declined.
County financial assistance program includes those who have benefits from a county allowing access to public clinic providers at either very low cost or no cost.
Includes: 1 Africa, 1 Barbados, 1 Canada, 1 Columbia, 1 Costa Rica, 6 Cuba, 1 Declined to provide, 1 Dominican Republic, 14 El Salvador, 6 Guatemala, 15 Honduras, 1 India, 2 Iran, 1 Jamaica, 2 Jordan, 2 Korea, 1 Lebanon, 131 Mexico, 2 Nicaragua, 3 Nigeria, 2 Pakistan, 1 Panama, 1 Peru, 1 Philippines, 1 Saudi Arabia, 3 Venezuela, 2 Vietnam (countries are listed in alphabetical order).
Score ranges from 1 to 5 (excellent = 1; poor = 5), with lower scores being more favorable.
To adjust for a potential confounding effect of the COVID-19 pandemic on the results, we created a binary variable that indicated whether the respondent was interviewed before or during the pandemic. We used March 2020 as the pandemic start date because that is when our outpatient clinics shut down.
Sample Size
The prevalence of nonprescription antibiotic use in previous studies conducted in the United States was 19% to 30%. If the maximum expected prevalence is 30%, to obtain a precision of 0.05, the sample size needed is 323. To adjust for possible nonresponse and to study the effect of multiple predictors on intended nonprescription use, we selected 564 respondents.
Survey Instrument Development
We assembled a community advisory board (CAB) of 6 ethnically diverse patient representatives from participating clinics. The proposed survey questions were shared with the CAB in English and Spanish. In response to input from our CAB and team members with expertise in sociocultural and health literacy issues, questionnaire items were modified for reading level, clarity, and appropriateness. The revised questionnaire was then pretested with a convenience sample of 20 English- and 15 Spanish-speaking individuals with various levels of education, and additional minor changes were made for the final version used in this study.
Statistical Analysis
We performed descriptive statistics on all study variables. The effect of patient, healthcare system, and clinical encounter factors were studied using appropriate tests for continuous (eg, t test or Mann-Whitney test, depending on data distribution) and categorical variables (χ2 tests or Fisher exact tests) by using the following 4 outcome variables: (1) intended use of antibiotics bought without a prescription in the United States; (2) intended use of antibiotics obtained from friends or relatives; (3) intended use of antibiotics bought without a prescription in other countries; and (4) intended nonprescription use of antibiotics from any of the previous 3 sources.
RESULTS
A total of 564 respondents completed the surveys. Before the COVID-19 pandemic (January–February 2020), the survey response rate was 92% of those who received the flyer when we recruited in person; we do not have the response rate for when we recruited by flyers during pandemic shutdowns. Data collection was completed in June 2021. Of 564 survey interviews, 198 were surveyed before the pandemic and 366 after the pandemic started. Table 1 shows the characteristics of the patient sample. Most respondents had medical coverage with Medicaid or the county financial assistance program (56.6%), followed by private insurance or Medicare (36.7%) and self-pay (6.7%). We had a high proportion of respondents who did not know or preferred not to report their household income (21%); therefore, we excluded this variable from the analyses.
Table 2 shows different barriers to medical appointments in the past 12 months. When asked about different barriers to medical appointments in the past 12 months, 150 (26.7%) reported that long waiting times were a problem. The high cost of doctor visits was reported as a problem (either major or minor) by 93 (16.6%) respondents (Table 2).
Patient-Reported Experiences (n = 564)
| No. (%) | |
|---|---|
| Barriers To Healthcare Access in The Past 12 Months (n = 561) | |
| For your medical appointments in the past 12 mo, how much of a problem is transportation? | |
| Not a problem | 471 (84.0) |
| Minor or major problem | 90 (16.0) |
| For your medical appointments in the past 12 mo, how much of a problem is long waiting times? | |
| Not a problem | 411 (73.3) |
| Minor or major problem | 150 (26.7) |
| For your medical appointments in the past 12 mo, how much of a problem is high cost of doctor visits? | |
| Not a problem | 468 (83.4) |
| Minor or major problem | 93 (16.6) |
| For your medical appointments in the past 12 mo, how much of a problem is a language barrier? | |
| Not a problem | 537 (95.7) |
| Minor or major problem | 24 (4.3) |
| For your medical appointments in the past 12 mo, how much of a problem is not having a regular doctor? | |
| Not a problem | 505 (90.0) |
| Minor or major problem | 56 (10.0) |
Nonprescription Antibiotic Use
Of 564 respondents, 247 (43.8%) reported prior use of nonprescription antibiotics. The proportion of nonprescription users was significantly higher among publicly funded clinic patients (48.4%) than among private clinic patients (31.6%), P < .001. Of all oral antibiotics used without a prescription, penicillins (mostly amoxicillin) were identified in half of all instances.
Intention to Use Antibiotics Without a Prescription
Overall, 177 (31.4%) of the respondents reported intended use of antibiotics without a prescription from 1 or more of these 3 sources if they were feeling sick (Figure 2). The proportion of intended use was significantly higher among publicly funded clinic patients (34.5%) than among private clinic patients (23.2%), P = .01. Of all surveyed patients, 126 (22.3%) reported that if they were feeling sick, they would take antibiotics obtained from friends or relatives without contacting a doctor/nurse/dentist/clinic (Figure 2). Intended use of antibiotics bought without a prescription in the United States if they felt sick was reported by 108 (19.1%) of the respondents and intended use of antibiotics bought without a prescription in other countries by 101 (17.9%) of the respondents (Figure 2).
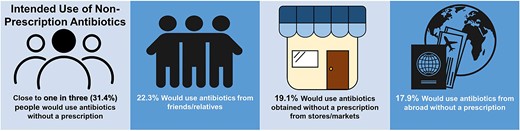
The prevalence of intended use of antibiotics without a prescription per each potential source of antibiotics (n = 564).
Predictors of Intention to Use Antibiotics Without a Prescription
Candidate predictors included age, sex, race and ethnicity, insurance status, as well as transportation, high cost of doctor visits, and language barrier as problems for medical appointments (Table 3). We did not find a significant confounding effect of COVID-19 pandemic on our results (Appendix Table 1). Younger age, lack of health insurance, and a perceived high costs of doctor visits were significant predictors of intended use of antibiotics without a prescription from any of the 3 sources (Table 3).
Comparison of Patient Characteristics Between Those Who Did and Did Not Report Overall Intended Use of Nonprescribed Antibiotics (From any Source)
| Reported Intention to Use Nonprescription Antibiotics | |||
|---|---|---|---|
| Characteristic | Yes N = 177 | No N = 387 | P Value |
| Mean age, y (standard deviation) | 47.7 (13.1) | 50.6 (13.8) | .02 |
| Female, No. (%) | 119 (67.2) | 288 (74.6) | .07 |
| No. (%) of respondents of race and ethnicity | .11 | ||
| African American or Black | 47 (26.6) | 139 (35.9) | … |
| Hispanic or Latina/Latino | 95 (53.7) | 168 (43.4) | … |
| Othera | 8 (4.5) | 18 (4.7) | … |
| Non-Hispanic White | 27 (15.3) | 62 (16.0) | … |
| No. (%) of respondents with education level | .43 | ||
| Less than high school | 29 (16.4) | 63 (16.3) | … |
| High school or GED | 64 (36.2) | 161 (41.6) | … |
| Some college and above | 84 (47.5) | 163 (42.1) | … |
| Private insurance or Medicare, No. (%) | 53 (29.9) | 154 (39.8) | .02 |
| Medicaid, Harris Health Financial Assistance program,b No. (%) | 110 (62.1) | 209 (54.0) | .07 |
| Self-pay, No. (%) | 14 (7.9) | 24 (6.2) | .45 |
| Surveyed in Spanish, No. (%) | 50 (28.2) | 105 (27.1) | .78 |
| No. (%) of respondents born in the United States | 111 (62.7) | 249 (64.3) | .71 |
| Median years lived in the United States for foreign-born respondents (IQR) | 20.0 (13.7–30.0) | 25.0 (18.0–32.0) | .07 |
| Overall health status mean (standard deviation) | 3.4 (1.1) | 3.2 (1.0) | .14 |
| Transportation is a problem for medical appointments in the past 12 mo, No (%) | 36 (20.3) | 54 (14.0) | .06 |
| Long waiting times is a problem for medical appointments in the past 12 mo, No (%) | 56 (31.6) | 94 (24.3) | .07 |
| High cost of doctor visits is a problem for medical appointments in the past 12 mo, No. (%) | 43 (24.3) | 50 (12.9) | .001 |
| Language barrier is a problem for medical appointments in the past 12 mo | 11 (6.2) | 13 (3.4) | .12 |
| Not having a regular doctor is a problem for medical appointments in the past 12 mo | 23 (13.0) | 33 (8.5) | .11 |
Boldface indicates statistical significance.
Abbreviations: GED, general educational development; IQR, interquartile range.
Includes: 10 Asian, 10 self-reported as multiracial or multiethnic, 4 American Indian, 2 declined.
County financial assistance program includes those who have benefits from a county allowing access to public clinic providers at either very low cost or no cost.
Factors that Predicted Nonprescription Antibiotic Use by Specific Sources of Antibiotics
Intended Use of Antibiotics Obtained From Friends or Relatives
Lack of health insurance, perceived high cost of doctor visits, and lack of transportation for medical appointments in the past 12 months were predictors of intended use of obtaining antibiotics from friends or relatives (Table 4).
Comparison of Patient Characteristics Between Those Who Did and Did Not Report Intended Use by Source of Nonprescription Antibiotics
| Reported Intention to Use Nonprescription Antibiotics from Relatives or Friendsa | |||
|---|---|---|---|
| Characteristic | Yes N = 126 | No N = 438 | P Value |
| No. (%) of respondents with insurance status | |||
| Private insurance or Medicare | 29 (23.0) | 178 (40.6) | .001 |
| Medicaid or Harris Health Financial Assistance Programb | 86 (68.3) | 233 (53.2) | .003 |
| Self-pay | 11 (8.7) | 27 (6.2) | .31 |
| Barriers to healthcare access in the past 12 mo, No. (%) | |||
| Transportation is a problem for medical appointments | 28 (22.2) | 62 (14.2) | .03 |
| High cost of doctor visits is a problem for medical appointments | 29 (23.0) | 64 (14.6) | .027 |
| Reported Intention to use Nonprescription Antibiotics From Stores or Markets in the United Statesc | |||
| Characteristic | Yes N = 108 | No N = 456 | P Value |
| Mean age (standard deviation) | 47.1 (12.7) | 50.3 (13.8) | .03 |
| No. (%) of respondents with insurance status | |||
| Private insurance or Medicare | 31 (28.7) | 176 (38.6) | .05 |
| Medicaid or Harris Health Financial Assistance Programb | 74 (68.5) | 245 (53.7) | .005 |
| Self-pay | 3 (2.8) | 35 (7.7) | .07 |
| Barriers to healthcare access in the past 12 mo, no. (%) | |||
| High cost of doctor visits is a problem for medical appointments | 29 (26.9) | 64 (14.0) | .001 |
| Reported Intention to Use Antibiotics Bought Without a Prescription From Abroadd | |||
| Characteristic | Yes N = 101 | No N = 463 | P Value |
| No. (%) of respondents of race and ethnicity | |||
| African American or Black | 13 (12.9) | 173 (37.4) | .001 |
| Hispanic or Latina/Latino | 70 (69.3) | 193 (41.7) | .001 |
| Othere | 3 (3.0) | 23 (5.0) | .43 |
| Non-Hispanic White | 15 (14.9) | 74 (16.0) | .78 |
| Surveyed in Spanish, No. (%) | 41 (40.6) | 114 (24.6) | .001 |
| No. (%) of respondents born in the United States | 50 (49.5) | 310 (67.0) | .001 |
| Barriers to healthcare access in the past 12 mo, No. (%) | |||
| Language barrier is a problem for medical appointments | 9 (8.9) | 15 (3.2) | .01 |
Boldface indicates statistical significance.
Age, sex, race and ethnicity, education level, survey language, country of birth, years lived in the United States for foreign born respondents, overall health status, long waiting times being a problem for medical appointments in the past 12 months, language barrier, and not having a regular doctor being a problem were not significantly different between those who did and did not endorse intention to use antibiotics from friends or relatives.
County financial assistance program includes those who have benefits from a county allowing access to public clinic providers at either very low cost or no cost.
Sex, race and ethnicity, education level, survey language, country of birth, years lived in the United States for foreign-born respondents, overall health status, long waiting times being a problem for medical appointments in the past 12 months, language barrier, and not having a regular doctor being a problem were not significantly different between those who did and did not endorse intention to use non-prescription antibiotics from stores or markets in the United States.
Sex, age, education level, insurance status, years lived in the United States for foreign-born respondents, overall health status, long waiting times being a problem for medical appointments in the past 12 months, high cost of doctor visits, and not having a regular doctor being a problem were not significantly different between those who did and did not endorse intention to use nonprescription antibiotics from abroad.
Includes: 10 Asian, 10 self-reported as multiracial or multiethnic, 4 American Indian, 2 declined.
Intended Use of Nonprescribed Antibiotics Obtained From Stores or Markets in the United States
Uninsured respondents who relied on Medicaid or a county financial assistance program were more likely to report intended use of antibiotics bought without a prescription (68.5% vs 53.7%; P = .005; Table 4). Younger age was another significant predictor for intended use of antibiotics bought without a prescription in the United States. Those who reported that high costs of doctor visit were a problem for medical appointments in the past 12 months were more likely to report intended use of nonprescribed antibiotics from the US markets and stores (26.9% vs 14.0%; P = .001).
Intended Use of Antibiotics Bought Without a Prescription From Abroad
Hispanic or Latino ethnicity and being surveyed in Spanish were significant predictors of intended use of antibiotics bought without a prescription abroad. Those who were born in the United States were less likely to report intended use of nonprescribed antibiotics from abroad (49.5% vs 67.0%; P < .001). Those who reported that the language barrier had been a problem for their medical appointments in the past 12 months were more likely to use antibiotics obtained from another country (Table 4).
DISCUSSION
Our survey of more than 500 patients attending public primary care clinics or private emergency departments (of whom one-third were Black and nearly one-half were Hispanic) found widespread use of antibiotics without a prescription. Nearly one-half (44%) of the people surveyed had taken antibiotics without a prescription in the past, and nearly 1 in 3 (31%) said they would take antibiotics without a prescription if they were feeling sick. We found several multilevel predictors of intended use that can inform future antibiotic stewardship and safety interventions. Most importantly, the high cost of doctor visits, lack of health insurance, and younger age were predictors of nonprescription use in general, from any of the 3 sources. Additional predictors emerged when looking at specific sources of nonprescription antibiotics, including lack of transportation, Hispanic or Latino ethnicity, surveyed in Spanish, being born in other countries, and encountering a language barrier with medical appointments.
Our study provides novel insights into predictors of intended use of nonprescription antibiotics from a racially, ethnically, and socioeconomically diverse sample of the US population, albeit from specific urban and nearby suburban areas. Previous research, mainly focused on Latino/Hispanic communities and migrant workers, reported that the lack of health insurance, difficulties in accessing the US healthcare system, and fear of deportation contributed to nonprescription antibiotic use [8, 9, 12–14]. Studies on predictors of nonprescription antibiotic use in persons who inject drugs found similar difficulties in accessing the US healthcare system and costs associated with doctor visits and antibiotic prescriptions [15], but also uncovered unique concerns around feeling mistreated or judged by clinicians [16]. The generalizability of the findings from these prior studies may be limited because of their focus on specific populations. In contrast, we observed that nonprescription antibiotic use is a public health problem across all demographic groups surveyed, both in publicly funded and private healthcare settings. Specifically, we found that 25.6% of patients with private insurance or Medicare reported intention to use nonprescription antibiotics.
Our findings are in line with the recent review in Europe finding that younger age groups have a higher propensity to use nonprescribed antibiotic use [17]. Although we did not ask about parental status, the financial and time demands of caring for children as well as the frequency of antibiotic use in pediatrics may have been a factor influencing younger adults’ predilection to use nonprescription antibiotics. The respondents who reported a language barrier in their medical appointments were more likely to obtain antibiotics without a prescription from other countries. Although we did not ask respondents to specify which countries would be their sources for nonprescription antibiotics, presumably, Spanish-speaking respondents might have access to antibiotics in the Spanish-speaking countries south of the United States. Previous studies also identified language barriers to be important factors influencing cross-border healthcare [18]. The implication of these findings is that as we design an intervention to reduce nonprescription antibiotic use, our patient-focused messaging needs to be tailored to resonate with various age groups and in different languages (English or Spanish). Addressing Spanish-speaking patients’ perceived language barrier in primary care appointments may also be an important component of our intervention.
Our survey has certain limitations. First, we relied on self-reported data, which may have underestimated the true prevalence rate of nonprescription antibiotic use resulting from social desirability bias or concern for legal consequences of obtaining and taking nonprescribed antibiotics. Potentially, concerns regarding the legality of nonprescription use of antibiotics could have influenced participation in the survey, which would also lead to our data being an underestimate of such activities. We do not know if this effect may differentially influence various subgroups of our participants. We identified variables that predict the outcome (intended use of nonprescription antibiotics) in the analyses; yet, as an observational study, associations reported should not be assumed to represent causal relationships. We did not perform surveys in languages other than English and Spanish; these are the 2 most common languages in our geographic area and in the United States in general. Although our sample is socioeconomically and ethnically diverse, our study was conducted in a multicultural urban area that may not represent the overall US population. However, as projected by Rice Kinder Institute for Urban Research, the demographics of the Houston area represent a bellwether for the future demographics of the United States by 2030 [19]. Because of the restrictions imposed by the pandemic, we used a consecutive nonprobability sampling technique. The impact of lost workdays on nonprescription antibiotic use will be explored in a follow-up study. Finally, we do not know about the extent of nonprescription antibiotic use beyond the populations we sampled. Our survey was performed in a healthcare setting and included individuals who were prone to seek healthcare advice. The prevalence of nonprescribed antibiotic use might be higher in surveys performed outside of a healthcare setting. Future studies are needed to expand geographic, racial, and linguistic diversity of the study population.
Our results suggest that nonprescription antibiotic use is a widespread problem in the United States, not limited to specific marginalized populations. Overuse of antibiotics is likewise a public health threat because of the relationship between excessive antibiotic use and antibiotic resistance [20]. Interventions to reduce nonprescription antibiotic use should focus on addressing the modifiable risk factors we identified, by reducing financial barriers to primary care visits, eliminating language barriers, and providing better access to care. Patient-directed messaging on this topic should be tailored to specific age groups and to the cultural and social needs of speakers of different primary languages. Community-based antimicrobial stewardship programs targeting multi-ethnic communities can use the data presented to help design interventions to improve patient safety and reduce the risk of antimicrobial resistance. For example, community pharmacists and health workers (ie, promotoras) can be involved in patient education on effective self-care treatments for common symptoms and the negative consequences of using antibiotics.
Our survey findings imply that policies to ensure basic insurance coverage of all residents could have the added benefit of reducing unsafe use of nonprescription antibiotics, thus supporting the cause of antibiotic stewardship.
Notes
Disclaimer. The contents presented herein do not represent the views of the US Department of Veterans Affairs or the US government.
Financial support. This work was supported by grant number R01HS026901 from the Agency for Healthcare Research and Quality. The content is solely the reponsibility of the authors and does not necessarily represent the official views of the Agency for Healthcare Research and Quality. B. W. T.'s work is supported in part by US Department of Veterans’ Affairs Health Services Research and Development Service (grant no. CIN 13-413) at the Center for Innovations in Quality, Effectiveness, and Safety. L. L.'s work is supported by a Ruth L. Kirschstein National Research Service Award (NRSA—T-32 6T32HC10031). The sponsors had no role in the design and conduct of the study; collection, management, analysis, and interpretation of the data; preparation, review, or approval of the manuscript; or decision to submit the manuscript for publication.
References
Author notes
Potential conflicts of interest. H. M. reports privately held stocks from Apple Inc. and Doximity. B. W. T. reports grants or contracts from VA Health Services Research & Development, Agency for Healthcare Research and Quality R18, Craig H. Neilson Foundation, Genentech, and Peptilogics, Inc; payment from George Washington ID Board for a Review Course; travel support for meeting attendance from VA Office of Research & Development and the Infectious Diseases Society of America; and an unpaid role on a DSMB for CSP #2004. L. G. reports grants or contracts from Agency for Healthcare Research and Quality (AHRQ) R18, Craig H. Neilsen Foundation, and a research education grant (1R25AA028203-01) from the National Institute on Alcohol Abuse and Alcoholism Award. All other authors report no potential conflicts.
All authors have submitted the ICMJE Form for Disclosure of Potential Conflicts of Interest. Conflicts that the editors consider relevant to the content of the manuscript have been disclosed.

