


Abstract
Efavirenz (EFV)- and dolutegravir (DTG)-based antiretroviral therapy (ART) is the former and current recommended regimen for treatment-naive individuals with human immunodeficiency virus type 1 (HIV-1). Whether they impact the immunological and neuropsychiatric profile differentially remains unclear.
This retrospective analysis included 258 participants enrolled during acute HIV-1 infection (AHI). Participants initiated 1 of 3 ART regimens during AHI: EFV-based (n = 131), DTG-based (n = 92), or DTG intensified with maraviroc (DTG/MVC, n = 35). All regimens included 2 nucleoside reverse-transcriptase inhibitors and were maintained for 96 weeks. CD4+ and CD8+ T-cell counts, mood symptoms, and composite score on a 4-test neuropsychological battery (NPZ-4) were compared.
At baseline, the median age was 26 years, 99% were male, and 36% were enrolled during Fiebig stage I–II. Plasma viral suppression at weeks 24 and 96 was similar between the groups. Compared with the EFV group, the DTG group showed greater increments of CD4+ (P < .001) and CD8+ (P = .015) T-cell counts but a similar increment of CD4/CD8 ratio at week 96. NPZ-4 improvement was similar between the 2 groups at week 24 but greater in the DTG group at week 96 (P = .005). Depressive mood and distress symptoms based on the Patient Health Questionnaire and distress thermometer were similar between the 2 groups at follow-up. Findings for the DTG/MVC group were comparable to those for the DTG group vs the EFV group.
Among individuals with AHI, 96 weeks of DTG-based ART was associated with greater increments of CD4+ and CD8+ T-cell counts and improvement in cognitive performance.
With the availability of combination antiretroviral therapy (ART), stable human immunodeficiency virus type 1 (HIV-1) suppression is readily achievable for most people with HIV (PWH) [1]. However, PWH on suppressive ART continue to show dysregulated immune function characterized by an inverted CD4/CD8 T-cell ratio and persistent elevation of plasma immune activation markers [2]. Cognitive and psychiatric manifestations remain common among treated PWH [3]. Apart from the persistence of HIV-1 reservoir and residual neuronal damage, side effects and neurotoxicity of ART may contribute to the persistence of neurological abnormalities in ART-treated PWH [4].
Most standard ART regimens consist of 3 antiretroviral agents, including 2 nucleoside reverse transcriptase inhibitors (NRTIs) plus either a nonnucleoside reverse transcriptase inhibitor (NNRTI), a protease inhibitor (PI), or an integrase strand transfer inhibitor (INSTI). Efavirenz (EFV), an NNRTI, was formerly the preferred first-line agent for treatment-naive PWH [5]. However, numerous studies have reported neuropsychiatric side effects associated with the use of EFV, including neurocognitive symptoms and sleep fragmentation [6, 7]. Dolutegravir (DTG) is a new-generation INSTI with a favorable profile of efficacy, safety, and tolerability [8]. Compared with EFV-based ART, DTG-based ART is associated with more rapid plasma HIV-1 suppression and higher probability of maintaining viral suppression [9, 10]. Furthermore, DTG-based ART is associated with greater increments in CD4+ T-cell count and CD4/CD8 ratio than EFV-based ART [11].
In 2018, the World Health Organization changed its preferred first-line ART regimen for treatment-naive PWH from EFV-based to DTG-based treatment [12]. However, post-marketing studies showed a higher-than-expected rate of DTG discontinuation due to psychiatric side effects [13, 14]. Moreover, in a post hoc analysis of a randomized control trial, EFV users surprisingly demonstrated a greater improvement in the CD4/CD8 ratio or a better multiple T-cell marker recovery than DTG users [15]. To date, EFV remains commonly used in low- and middle-income countries (LMICs) despite an increasing prevalence of NNRTI resistance [16]. Studies that directly compare the 2 drugs would help address the aforementioned concerns of DTG and facilitate the transition of initial ART to DTG-based regimens in LMICs.
Previously, we reported general safety and stable neuropsychiatric parameters after a planned transition to DTG-based ART among individuals who initiated and maintained ART since acute HIV-1 infection (AHI) [17, 18]. In the present analysis, we focus on the immunological and neuropsychiatric outcomes among individuals who commenced EFV- or DTG-based ART during AHI and maintained the same regimen over 96 weeks. Further, we determine whether an intensified DTG-based regimen with maraviroc (MVC) would demonstrate additional clinical or laboratory benefits.
METHODS
Data were collected as part of the RV254 Thai AHI cohort. Participants were included in the analysis if they were in Fiebig stages I–V [19] at study enrollment, started 1 of 3 ART regimens (EFV-based, DTG-based, or DTG/MVC-based) during AHI, and completed 96 weeks of follow-up without stopping or changing the initial ART regimen. All ART regimens included a backbone of 2 NRTIs. Between May 2009 and March 2017, a standard 3-drug EFV-based regimen was provided to all new participants. Since March 2017, initial ART was switched to a 3-drug DTG-based regimen. In addition, a subset of RV254 enrollees was randomized to receive 96 weeks of an intensified DTG-based regimen with MVC, a C-C chemokine receptor type 5 receptor antagonist. The purpose of randomization was to investigate the effect of intensified ART initiated during AHI on immunological recovery, cognition, and psychiatric outcomes.
Participants underwent regular measurements of plasma HIV-1 RNA and CD4+ and CD8+ T-cell levels at baseline (pre-ART) and then every 12–24 weeks. Cognitive and psychiatric assessments were performed at baseline and during subsequent visits post-ART. Acute retroviral syndrome (ARS) was defined as 3 or more signs or symptoms during AHI using a standardized checklist [20].
Neuropsychological Assessments
The 4-test battery measured fine motor speed and dexterity (nondominant hand Grooved Pegboard test; Lafayette Instrument Company, Lafayette, IN, USA), psychomotor speed (Color Trails 1 and Trail Making A; PAR, Inc, Lutz, FL, USA), and executive functioning (Color Trails 2; PAR, Inc, Lutz, FL, USA). Raw scores were standardized to z scores using Thai normative data [21], which were averaged to create an overall performance (NPZ-4) score. Mood assessments included the Patient Health Questionnaire-9 (PHQ-9) and Distress Thermometer (DT), each of which have been validated for use in Thailand [22, 23]. The PHQ-9 is a 9-item survey (score range, 0–27) derived from the Diagnostic and Statistical Manual of Mental Disorders, fourth edition, criteria for depression [24]. PHQ-9 scores ≥10 and ≥15 have been used to detect moderate and moderate to severe depression, respectively [24]. The moderate cutoff was used in this study. The DT is a self-reported measure of emotional stress that uses an image of a thermometer to guide severity ratings of stress and anxiety from 0 to 10.
Data Analyses
Results were reported as median and interquartile range (IQR) or frequency and percentage, as appropriate. Plasma viral suppression was defined as HIV-1 RNA level <50 copies/mL. Comparisons between groups were done using Mann–Whitney U tests or Fisher exact tests where appropriate. Linear regression modeling identified factors associated with the changes in CD4+ T-cell count and NPZ-4 scores from AHI to week 96. Logistic regression identified factors associated with CD4/CD8 ≥1 at week 96. In the ART group-based comparison, parameters from the EFV group were used as the reference. In the multivariable analyses, only variables with a P value <.05 in univariable analyses were included. Models were adjusted for Fiebig stage to control virological differences at baseline and to assess treatment effects. Post-estimate analyses including the Breush–Pagan/Cook–Weisberg test, variance inflation factor, Shapiro–Wilk W test, and goodness of fit test were performed. Additional generalized estimating equations (GEEs), which attenuate the effect of misspecified covariance structure with an autoregressive-1 correlation matrix and robust standard errors, tested if ART regimens were associated with CD4+ T-cell count, NPZ-4, and CD4/CD8 ≥1 at 96 weeks (Supplementary Table 2 A–C). The analyses were performed using StataCorp 2019. Stata Statistical Software: release-16 and RStudio Team (2021). RStudio: Integrated Development Environment for R. RStudio, PBC, Boston, MA.
Post-Antiretroviral Therapy Outcomes at Weeks 24 and 96
| Characteristics | EFV (n = 131) | DTG (n = 92) | DTG/MVC (n = 35) | EFV vs DTG P Value | EFV vs DTG/MVC P Value |
|---|---|---|---|---|---|
| Week 24 | |||||
| Plasma HIV-1 suppression,a n (%) | 121 (93) | 87 (97) | 32 (91) | .368 | .719 |
| CD4+ T-cell count, cells/mm3 | 593 (483–720) | 610 (510–811) | 702 (500–873) | .462 | .214 |
| CD8+ T-cell count, cells/mm3 | 598 (461–795) | 621 (475–845) | 779 (592–1096) | .308 | <.001 |
| CD4/CD8 ratio | 1.03 (0.76–1.34) | 0.93 (0.76–1.29) | 0.77 (0.66–1.19) | .416 | .004 |
| CD4/CD8 ≥1, n (%) | 70 (54) | 41 (46) | 11 (31) | .273 | .022 |
| NPZ-4 | 0.57 (0.06–1.02) | 0.64 (0.25–0.99) | 0.59 (0.26–0.97) | .422 | .713 |
| PHQ-9 | 5 (2–8) | 4 (2–8) | 4 (2–8) | .942 | .559 |
| PHQ-9 ≥10, n (%) | 19 (15) | 14 (16) | 4 (12) | 1.000 | .787 |
| Distress thermometer | 2.1 (1–4.5) | 1.5 (1–3.2) | 1.4 (0.8–2.7) | .079 | .099 |
| Week 96 | |||||
| Plasma HIV-1 suppression, n (%) | 126 (98) | 89 (98) | 34 (97) | 1 | .518 |
| CD4+ T-cell count, cells/mm3 | 645 (530–793) | 653 (552–863) | 677 (569–855) | .602 | .438 |
| CD8+ T-cell count, cells/mm3 | 580 (469–762) | 639 (473–858) | 779 (586–1142) | .129 | <.001 |
| CD4/CD8 ratio | 1.13 (0.86–1.45) | 1.05 (0.79–1.33) | 0.91 (0.67–1.14) | .110 | .003 |
| CD4/CD8 ≥1, n (%) | 71 (55) | 42 (47) | 11 (31) | .217 | .013 |
| NPZ-4 | 0.53 (0.03–0.91) | 0.71 (0.27–1.13) | 0.49 (−0.12 to 1.02) | .026 | .784 |
| PHQ-9 total score | 5 (1–8) | 5 (2–8) | 4 (3–6) | .923 | .816 |
| PHQ-9 ≥10, n (%) | 18 (14) | 13 (14) | 5 (14) | 1.000 | 1.000 |
| Distress thermometer | 2.0 (0.8–4) | 1.8 (0.9–3.5) | 1.5 (0.9–3.4) | .620 | .397 |
Median (interquartile range) is provided unless specified.
Abbreviations: DTG, dolutegravir; EFV, efavirenz; HIV, human immunodeficiency virus; MVC, maraviroc; PHQ-9, patient health questionnaire.
Defined as plasma HIV-RNA <50 copies/mL.
RESULTS
The analysis included 258 RV254 participants who had completed the week 96 assessment by March 2021 (Figure 1). The median age was 26 years (IQR, 23–31), 255 (99%) were male, and 157 (61%) had earned a bachelor’s degree or above. At enrollment, 92 (36%) were at early Fiebig stages (I–II) of AHI and 198 (77%) presented with symptoms of ARS. The estimated duration from HIV-1 transmission to ART initiation was 20 days (IQR, 13–26). Among them, 131 (50%), 92 (36%), and 35 (14%) initiated EFV-based, DTG-based, and DTG/MVC-based ART, respectively. All maintained the third agent (ie, EFV, DTG, or DTG/MVC) throughout 96 weeks of follow-up. Baseline characteristics by ART regimen are reported in Table 1. Sex ratio, educational attainment, and plasma HIV-1 level were similar across the 3 ART groups. Compared with the EFV group, the DTG/MVC group was slightly younger (26 years; IQR, 23–32 vs 24 years; IQR, 22–27; P = .017), whereas the DTG group had a lower frequency of early Fiebig stages (44% vs 22%, P = .001) and lower CD4+ T-cell count (405; IQR, 276–507 vs 332; IQR, 239–426; P = .006). At study baseline, the average NPZ-4 did not differ by group. However, the DTG and DTG/MVC groups scored lower (ie, less severe symptoms) in the PHQ-9 and DT than the EFV group.
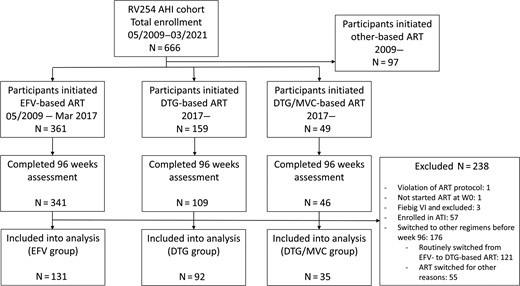
Participant selection. Abbreviations: AHI, acute human immunodeficiency virus type 1 infection; ART, antiretroviral therapy; ATI, analytical treatment interruption; DTG, dolutegravir; EFV, efavirenz; MVC, maraviroc.
Baseline Characteristics
| Characteristics | All Participants | EFV (n = 131) | DTG (n = 92) | DTG/MVC (n = 35) | EFV vs DTG P Value | EFV vs DTG/MVC P Value |
|---|---|---|---|---|---|---|
| Age, y | 26 (23–31) | 26 (23–32) | 26 (23–32) | 24 (22–27) | .743 | .017 |
| Sex, male, n (%) | 255 (99) | 128 (98) | 92 (100) | 35 (100) | .270 | 1.000 |
| Higher education, n (%) | 157 (61) | 83 (63) | 57 (62) | 17 (49) | .888 | .124 |
| Fiebig stage, n (%) | … | … | … | … | ||
| I–II (Ref) | 92 (36) | 58 (44) | 20 (22) | 14 (40) | .001 | .704 |
| III–V | 166 (64) | 73 (56) | 72 (78) | 21 (60) | ||
| Plasma HIV-1 RNA (log10 copies/mL) | 6.12 (5.34–6.84) | 5.91 (5.23–6.89) | 6.18 (5.57–6.84) | 6.04 (5.09–6.75) | .243 | .777 |
| CD4+ T-cell count, cells/mm3 | 359 (264–495) | 405 (276–507) | 332 (239–426) | 380 (276–511) | .006 | .559 |
| CD8+ T-cell count, cells/mm3 | 519 (319–959) | 532 (332–1108) | 455 (305–811) | 540 (334–941) | .098 | .906 |
| CD4/CD8 ratio | 0.71 (0.39–1.12) | 0.77 (0.38–1.12) | 0.71 (0.43–1.12) | 0.60 (0.35–0.93) | .891 | .670 |
| CD4/CD8 ≥1 | 80 (31) | 45 (34) | 27 (29) | 8 (23) | .469 | .226 |
| NPZ-4 composite score | 0.09 (−0.55 to 0.49) | 0.07 (−0.55 to 0.53) | 0.11 (−0.48 to 0.46) | 0.09 (−0.89 to 0.50) | .846 | .815 |
| PHQ-9 total score | 9 (5–13) | 9 (6–14) | 8 (4–13) | 6 (4–11) | .018 | .008 |
| PHQ-9 ≥10, n (%) | 105 (43) | 59 (49) | 36 (39) | 10 (29) | .165 | .051 |
| Distress thermometer | 5 (2.1–6.9) | 5.5 (3–7.5) | 3.7 (1.8–6) | 2.5 (1–6.5) | <.001 | .005 |
| Acute retroviral syndrome, n (%) | 198 (77) | 97 (74) | 78 (85) | 23 (66) | .069 | .395 |
| Estimated duration from HIV transmission to antiretroviral therapy initiation | 20 (13–26) | 19 (13–25) | 22 (14–27) | 18 (13–23) | .173 | .717 |
N = 258. Median (interquartile range) is provided unless specified.
Abbreviations: DTG, dolutegravir; EFV, efavirenz; HIV, human immunodeficiency virus; MVC, maraviroc; PHQ-9, patient health questionnaire.
Post-ART Outcomes
Outcomes at weeks 24 and 96 by ART regimen are shown in Table 2. Parameters of the EFV group were taken as a reference. The rates of viral suppression were similar across the 3 groups at follow-up. The DTG and DTG/MVC groups had CD4+ T-cell counts similar to those of the EFV group at weeks 24 and 96. Compared with the EFV group, the DTG group showed similar CD8+ T-cell count and CD4/CD8 ratio at weeks 24 and 96. In contrast, the DTG/MCV group showed higher CD8+ T-cell count and lower CD4/CD8 ratio than the EFV group at both week 24 and week 96. The NPZ-4 scores were similar between the 3 groups at week 24. At week 96, the DTG group, but not the DTG/MVC group, showed a higher NPZ-4 score than the EFV group (P = .026). All groups scored similarly in PHQ-9 and DT at weeks 24 and 96.
The absolute changes of outcome parameters by ART regimen are shown in Figure 2 and Supplementary Table 1. At week 24, both DTG and DTG/MVC groups had greater increments in CD4+ and CD8+ T-cell count than the EFV group (P < .05). At week 96, only the DTG group had a greater increment of CD4+ T-cell count than the EFV group (P = .013), whereas both DTG and DTG/MVC groups had greater increments in CD8+ T-cell count than the latter (P < .05). The increments of CD4/CD8 ratios from baseline to weeks 24 and 96 were similar between the 3 groups. All groups had similar improvement of NPZ-4 scores at week 24, but the DTG group had a greater increment of NPZ-4 score than the EFV group at week 96 (P = .005).
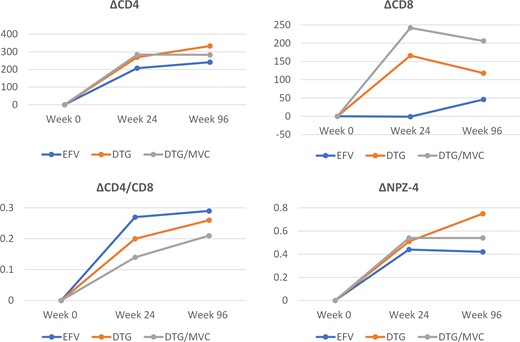
Changes of parameters over 96 weeks. Median values are presented. Abbreviations: DTG, dolutegravir; EFV, efavirenz; MVC, maraviroc.
Univariable and multivariable models were used to determine whether ART regimen demonstrates an independent relationship with the absolute changes of parameters at week 96. The changes in CD4+ T-cell count and NPZ-4 scores at week 96 were evaluated using linear regression. As the changes in CD8+ T-cell and CD4/CD8 ratio did not fulfill the criteria of a linear model, a logistic regression model taking CD4/CD8 ≥1 at week 96, which signifies a phenotype of better recovery of T-cell immunity [25], was used.
Table 3 presents the outcomes of linear regression analysis of CD4+ T-cell count. In the univariable analysis, baseline plasma HIV-1 RNA level, CD4+ and CD8+ T-cell counts, and a DTG-based regimen (vs EFV-based regimen) were associated with the change in CD4+ T-cell count. All of these factors remained independently associated with the change of CD4+ T-cell in the multivariable model. Specifically, the DTG-based regimen, but not the DTG/MVC regimen, was associated a greater increment of CD4+ T-cell (B = 60; 95% confidence interval [CI], 0.80–119; P = .047). Table 4 presents the outcomes of the logistic regression analyses for CD4/CD8 ratio. While age, Fiebig stages, baseline CD8+ T-cell level, and baseline CD4/CD8 ≥1 were independently associated with CD4/CD8 ≥1 at week 96 in the multivariable model, the DTG- and DTG/MVC-based regimens were not. Table 5 presents the outcomes of linear regression analyses for the change in NPZ-4 score at week 96. Age and a DTG-based regimen were associated with the change of NPZ-4 in both univariable and multivariable analysis, but DTG/MVC-based regimen was not. Compared with the EFV-based regimen, the DTG-based regimen was associated with a greater improvement in NPZ-4 score at week 96 (B = 0.27; 95% CI, 0.06–0.48; P = .013). In the multivariable GEEs analyses, DTG was independently associated with higher CD4+ T-cell level and NPZ-4 score but not CD4/CD8 ≥1 (Supplementary Table 2 A–C).
Factors Associated With CD4 Changes After 96 Weeks of Antiretroviral Therapy
| Characteristics | ΔCD4 Univariable | ΔCD4 Multivariable | ||
|---|---|---|---|---|
| Coefficient (95% CI) | P Value | Coefficient (95% CI) | P Value | |
| Sex, female | 252 (−15 to 519) | .064 | … | |
| Age | 0.5 (−4 to 5) | .823 | … | |
| Later Fiebig stage (III–V) | 32 (–28 to 93) | .291 | –43 (–107 to 21) | .190 |
| Baseline plasma human immunodeficiency virus type 1 RNA | 72 (49–96) | <.001 | 58 (29–87) | <.001 |
| Baseline CD4+ T-cell count (per 100 cells increase) | −53 (−39 to −67) | <.001 | –30 (–13 to –48) | .001 |
| Baseline CD8+ T-cell count (per 100 cells increase) | −7 (−2 to −11) | .002 | –5 (–1 to –10) | .028 |
| Baseline CD4/CD8 | 5 (−50 to 60) | .850 | … | |
| Antiretroviral therapy regimen (EFV vs DTG) | … | … | … | |
| ȃEFV | Ref | … | … | |
| ȃDTG | 83 (20–146) | .010 | 60 (1–119) | .047 |
| ȃDTG/MVC | 74 (−14 to 161) | .098 | 65 (–14 to 143) | .105 |
Abbreviations: CI, confidence interval; DTG, dolutegravir; EFV, efavirenz; MVC, maraviroc.
Factors Associated With CD4/CD8 Ratio ≥1 at Week 96 After Antiretroviral Therapy
| Characteristics | Univariable | Multivariable | ||
|---|---|---|---|---|
| OR (95% CI) | P Value | OR (95% CI) | P Value | |
| Sex, male | NA | NA | NA | |
| Age | 1.07 (1.02–1.11) | .003 | 1.04 (0.99–1.10) | .094 |
| Later Fiebig stages (III–V) | 0.67 (0.40–1.13) | .133 | 2.54 (1.18–5.49) | .017 |
| Baseline plasma human immunodeficiency virus type 1 RNA | 0.80 (0.64–1.00) | .056 | … | |
| Baseline CD4+ T-cell count (per 100 cells increase) | 1.16 (1.01–1.34) | .035 | 1.15 (0.96–1.39) | .135 |
| Baseline CD8+ T-cell count (per 100 cells increase) | 0.92 (0.88–0.97) | .001 | 0.95 (0.90 −1.00) | .054 |
| Baseline CD4/CD8 ≥1 | 11.28 (5.29–24.06) | <.001 | 10.86 (4.35–27.15) | <.001 |
| Antiretroviral therapy regimen (EFV vs DTG) | ||||
| EFV | Ref. | … | ||
| DTG | 0.79 (0.46–1.37) | .401 | 0.73 (0.38–1.38) | .330 |
| DTG/MVC | 0.50 (0.23–1.06) | .070 | 0.61 (0.25–1.45) | .262 |
Abbreviations: CI, confidence interval; DTG, dolutegravir; EFV, efavirenz; MVC, maraviroc; OR, odds ratio.
Factors Associated With the Change of NPZ-4 96 Weeks After Antiretroviral Therapy
| Characteristics | Univariable | Multivariable | ||
|---|---|---|---|---|
| Coefficient (95% CI) | P Value | Coefficient (95% CI) | P Value | |
| Sex, male | −0.44 (−1.27 to 0.40) | .301 | … | |
| Age | 0.02 (0.007–0.04) | .005 | 0.02 (0.007–0.04) | .005 |
| Later Fiebig stages (III–V) | 0.02 (−0.18 to 0.22) | .841 | −0.03 (−0.23 to 0.17) | .792 |
| Baseline plasma human immunodeficiency virus type 1 RNA | 0.08 (−0.004 to 0.17) | .061 | … | |
| Baseline CD4+ T-cell count (per 100 cells increase) | −0.04 (−0.10 to 0.007) | .093 | … | |
| Baseline CD8+ T-cell count (per 100 cells increase) | 0.006 (−0.008 to 0.02) | .417 | … | |
| Baseline CD4/CD8 ratio | −0.09 (−0.27 to 0.09) | .341 | … | |
| Antiretroviral therapy regimen (EFV vs DTG) | ||||
| ȃEFV | Ref | … | … | |
| ȃDTG | 0.26 (0.05–0.47) | .014 | 0.27 (0.06–0.48) | .013 |
| ȃDTG/MVC | 0.04 (−0.24 to 0.33) | .774 | 0.10 (−0.19 to 0.38) | .497 |
Abbreviations: CI, confidence interval; DTG, dolutegravir; EFV, efavirenz; MVC, maraviroc.
DISCUSSION
In this analysis, we compared the T-cell profile and neuropsychiatric outcomes among individuals who initiated EFV- or DTG-based ART during AHI. EFV- and DTG-based ART regimens are the prior and current preferred regimens, respectively, for treatment-naive PWH in LMICs. Understanding the potential difference in treatment outcomes between them is crucial for frontline clinicians and policy makers, particularly in settings with limited supplies of DTG. To date, it has been generally accepted that different ART regimens are equally effective in promoting immunological recovery if HIV-1 suppression is sustained. Whether different ART regimens alter immunological recovery and the inflammatory profile remains inconclusive [11]. Comparing such effects by ART regimens is often challenging as personal factors including age, duration of HIV-1 infection, nadir CD4+ T-cell level, and history of opportunistic infection may modify treatment outcomes. Different adverse effect profiles of antiretroviral agents could also affect medication adherence and indirectly impact treatment outcomes.
The RV254 cohort provides a unique opportunity to examine the differential effects of ART regimens in a more controlled setting. First, RV254 participants were diagnosed and treated during AHI, resulting in a uniformly short duration of HIV infection before treatment. Although the 3 ART groups differed by Fiebig staging, the duration of infection was highly homogeneous and ranged from days to weeks. Second, the participants were mostly young and without comorbidities other than HIV-1 infection, minimizing drug–drug interactions that may confound the treatment outcomes. The effects of DTG-based regimen were additionally evaluated with GEE analysis that handles unmeasured dependence between outcomes.
Compared with an EFV-based regimen, DTG-based ART is associated with faster [26] and more effective HIV-1 suppression [26, 27] and a greater increment in CD4+ T-cell counts [26, 27] in treatment-naive PWH with chronic infection. In this study, the rates of plasma viral suppression were similar between the 2 at weeks 24 and 96. However, the DTG group showed a greater increase in CD4+ T-cell level than the EFV group. The association between DTG-based regimen and greater increment of CD4+ level remained independent in the multivariable analysis. Other factors of statistical significance included higher plasma viral load and lower CD4+ and CD8+ T-cell levels at baseline. Collectively, these non-ART factors suggest that CD4+ T-cell recovery is, at least in part, inversely associated with the severity of HIV-1 viremia and CD4+ T-cell depletion during AHI. This contrasts with the association between lower nadir CD4+ T-cell level, a marker of T-cell exhaustion, and less CD4 T-cell count recovery despite suppressive ART in chronic infection [28].
The DTG group also showed a greater increment in CD8+ T-cell than the EFV group at follow-up. CD4/CD8 ratios, the change of CD4/CD8 ratio from baseline, and the frequency of CD4/CD8 ≥1 were statistically similar between the 2 ART groups. Analysis of CD4/CD8 ≥1 by ART regimen in the multivariable analysis supports the absence of ART effect on CD4/CD8 ratio among our participants. Owing to the nonlinearity of CD8+ T-cell data, we did not test the association between DTG and a greater increment in CD8+ T-cell level in the multivariable analysis. However, such association appears reasonable given that the DTG group had a greater increment in CD4+ T-cell level than the EFV group, but the CD4/CD8 ratio was similar between them. In the literature, INSTI-based regimens are generally associated with a higher rate of CD4/CD8 normalization than EFV-based regimens [11, 29]. The benefits could be related to better virologic control, superior resistance barrier, and potential differences in microbial translocation and systemic inflammation between different ART regimens [30].
Vivid dreams, insomnia, and mood changes are frequent complaints with EFV use [31]. EFV users also report more symptoms of neurotoxicity compared with other antiretroviral agents [32]. While recent studies highlight the neurological side effects of INSTI [33], studies directly comparing EFV- and DTG-based ART generally report fewer neuropsychiatric side effects of the latter [14, 34]. We previously reported the neuropsychiatric outcomes before and after a planned ART transition to DTG-based regimens among RV254 participants on suppressive ART [18]. In that analysis, 80% of the participants were on EFV-based ART pre-switch. The analysis revealed a modest increase in the PHQ-9 score and improvement in NPZ-4 score post-transition. In the current analysis, both EFV and DTG groups scored similarly in PHQ-9 and DT at weeks 24 and 96, suggesting similar depression and distress symptoms between the 2 regimens. Both groups showed similar NPZ-4 scores and degrees of improvement at week 24. Intriguingly, the DTG group showed a greater degree of improvement than the EFV group from baseline to week 96, suggesting a delayed difference in cognitive performance between them.
Several factors may contribute to the delayed difference in cognitive performance in treated PWH, including central nervous system penetrance that suppresses the compartmentalized viral replication and the adverse neurological effects or neurotoxicity of ART. The former is less likely in RV254, given the likely absence of central nervous system compartmentalization [35] and rare cerebral spinal fluid viral escape after initiating ART during AHI [36]. In the latter case, the initial improvement in test performance may be secondary to HIV-1 suppression but later offset by the adverse effects of EFV after week 24 [32]. Nonetheless, it should be stressed that the NPZ-4 difference between the 2 groups was 0.18 standard deviations only at week 96, and this value may not be clinically relevant.
Adding MVC to a standard ART regimen has been hypothesized to reduce HIV reservoir size [37] and improve cognitive performance in PWH [38]. Given that the HIV-1 reservoir is rapidly established post-transmission, individuals with AHI might benefit from an intensified ART regimen as their initial treatment. In the current analysis, the DTG/MVC group did not outperform the DTG group in terms of immunological and neurocognitive outcomes. Comparison of the DTG/MVC group with the EFV group revealed greater increments in CD4+ and CD8+ T-cell counts but similar CD4/CD8 ratios and similar scores in the mood questionnaires. Similar to the DTG group, the DTG/MVC group showed a greater improvement in NPZ-4 than the EFV group, although it did not reach statistical significance. Taken together, these findings do not support any benefit of MVC-intensified ART during AHI.
This study has limitations. RV254 participants are mainly young, healthy males apart from HIV infection. The cohort excludes individuals with active psychiatric conditions. Such settings may overlook certain adverse effects that are specifically associated with age or other comorbidities. Potentially confounding factors, such as hepatitis C status and substance use, may differ between the ART groups and were not examined. Excluding participants who switched to another ART regimen before week 96 could overlook the more severe neuropsychiatric impacts among participants not tolerating EFV or DTG. The 96-week study end point could be too short for ART toxicity to develop. In addition, our 4-test battery focuses on motor, psychomotor, and executive functions and is insensitive to other cognitive deficits. Last, the analysis did not control for the NRTI backbone that may affect inflammatory profiles [39, 40].
CONCLUSIONS
Among individuals who initiated ART during AHI, DTG-based ART was associated with greater increments in CD4+ and CD8+ T-cell counts, but not the CD4/CD8 ratio, compared with EFV-based regimens at 96 weeks post-treatment. EFV and DTG users demonstrated similar ratings of depression and anxiety/distress symptoms at weeks 24 and 96 post-ART. They showed a similar improvement in cognitive test performance at week 24; however, at week 96, DTG users showed a greater degree of improvement than EFV users. An intensified DTG-based regimen with MVC did not result in any additional benefit in the measured parameters. Together with the greater barrier to resistance of DTG, our analysis supports the use of a DTG-based regimen in LMICs where second- and third-line ART is less readily available. Future studies should look into the immunological characteristics of increased T-cell levels among DTG users, plus the potential adverse cognitive effect of EFV after long-term usage.
Supplementary Data
Supplementary materials are available at Clinical Infectious Diseases online. Consisting of data provided by the authors to benefit the reader, the posted materials are not copyedited and are the sole responsibility of the authors, so questions or comments should be addressed to the corresponding author.
Notes
Author Contributions. V. V., S. Spudich, R. P., and J. A. designed the RV254 cohort protocol. S. V., D. H., and N. P. operated the protocol. P. C., S. Spudich, and D. H. designed the current study. P. C., E. K., D. C., C. S., S. Sriplienchan, and J. A. performed the clinical follow-ups for the participants. P. C., B. Y., and S. P. performed the statistical analysis. All authors contributed to the manuscript and reviewed the final version.
Acknowledgments. We thank the RV254/South East Asia Research Collaboration in HIV 010 participants, the International NeuroHIV Cure Consortium that is funded by the National Institute of Mental Health, and staff from the Thai Red Cross AIDS Research Centre, Chulalongkorn University, and Armed Forces Research Institute of Medical Sciences for their valuable contributions to this study. We are grateful to the Thai Government Pharmaceutical Organization, ViiV Healthcare, Gilead Sciences, and Merck for providing the antiretroviral medications for this study.
Disclaimer. The views expressed are those of the authors and should not be construed to represent the positions of the US Army, US Department of Defense (DOD), or the Department of Health and Human Services, the National Institutes of Health (NIH), or the Henry M. Jackson Foundation for the Advancement of Military Medicine, Inc. The investigators have adhered to the policies for protection of human subjects as prescribed in AR 70–25.
Financial support. The RV254/South East Asia Research Collaboration in HIV 010 study is supported by cooperative agreements (WW81XWH-18-2-0040) between the Henry M. Jackson Foundation for the Advancement of Military Medicine, Inc., and the US Department of Defense (DOD) and by an intramural grant from the Thai Red Cross AIDS Research Centre. This research was funded, in part, by the U.S. NIAID (AAI20052001), The National Institute of Mental Health (NIMH) (R01MH106466), National Institute of Neurological Disorders and Stroke (NINDS) (R01NS084911), and NIMH support of the International NeuroHIV Cure Consortium. Antiretroviral therapy for RV254/SEARCH 010 participants was supported by the ThaiGovernment Pharmaceutical Organization, Gilead Sciences, Merck, and ViiV Healthcare.
References
Author notes
Potential conflicts of interest. J. A. has received honoraria for participating in advisory meetings for ViiV Healthcare, Merck, Gilead, Roche, and AbbVie and reports that RV254/SEARCH 010 study participants received antiretroviral drugs from the Thai Government Pharmaceutical Organization, Gilead Science, Merck, and ViiV Healthcare. V. V. reports grants from NIH and the US Alzheimer's Association to the University of California–San Francisco (UCSF) for research including one NIH grant directly linked to the current work. He has also received personal fees from ViiV Healthcare and Merck outside the submitted work and payment for lectures for Continuing Medical Education paid to himself from the International AIDS Society-USA. Spudich reports grants from NIH–NIMH and NINDS during the conduct of the study and nonfinancial support from ViiV Healthcare, Inc, in the form of medications for a clinical trial directed by S. Spudich; study medications were provided to the AIDS Clinical Trials Group for the clinical trial, outside the submitted work. R. P. reports grants from NIH–NIMH. All other authors report no potential conflicts.
All authors have submitted the ICMJE Form for Disclosure of Potential Conflicts of Interest. Conflicts that the editors consider relevant to the content of the manuscript have been disclosed.

