


Abstract
Influenza virus and SARS-CoV-2 are significant causes of respiratory illness in children.
Influenza- and COVID-19–associated hospitalizations among children <18 years old were analyzed from FluSurv-NET and COVID-NET, 2 population-based surveillance systems with similar catchment areas and methodology. The annual COVID-19–associated hospitalization rate per 100 000 during the ongoing COVID-19 pandemic (1 October 2020–30 September 2021) was compared with influenza-associated hospitalization rates during the 2017–2018 through 2019–2020 influenza seasons. In-hospital outcomes, including intensive care unit (ICU) admission and death, were compared.
Among children <18 years, the COVID-19–associated hospitalization rate (48.2) was higher than influenza-associated hospitalization rates: 2017–2018 (33.5), 2018–2019 (33.8), and 2019–2020 (41.7). The COVID-19–associated hospitalization rate was higher among adolescents 12–17 years old (COVID-19: 59.9; influenza range: 12.2–14.1), but similar or lower among children 5–11 (COVID-19: 25.0; influenza range: 24.3–31.7) and 0–4 (COVID-19: 66.8; influenza range: 70.9–91.5) years old. Among children <18 years, a higher proportion with COVID-19 required ICU admission compared with influenza (26.4% vs 21.6%; P < .01). Pediatric deaths were uncommon during both COVID-19– and influenza-associated hospitalizations (0.7% vs 0.5%; P = .28).
In the setting of extensive mitigation measures during the COVID-19 pandemic, the annual COVID-19–associated hospitalization rate during 2020–2021 was higher among adolescents and similar or lower among children <12 years compared with influenza during the 3 seasons before the COVID-19 pandemic. COVID-19 adds substantially to the existing burden of pediatric hospitalizations and severe outcomes caused by influenza and other respiratory viruses.
Influenza virus and severe acute respiratory syndrome coronavirus 2 (SARS-CoV-2) are significant causes of respiratory illness and can cause severe illness, including death, in children [1–5]. Annual influenza vaccination is approved and recommended for persons 6 months and older without contraindications [6], whereas coronavirus disease 2019 (COVID-19) vaccines are currently authorized or approved for persons 5 years and older [7]. Influenza-associated hospitalization rates are typically highest among adults aged 65 years and older, followed during some seasons by adults aged 50–64 years and during others by children 0–4 years old [8]. COVID-19–associated hospitalization rates are similarly higher among adults compared with children [9]. However, data comparing influenza- versus COVID-19–associated hospitalizations among children are limited [10, 11]. Such data are useful for evaluating the impact of mitigation measures and for interpreting disease burden measures, which can provide useful context to inform COVID-19 vaccine recommendations for children younger than 5 years old. We compared hospitalization rates, clinical characteristics, and outcomes among children younger than 18 years old hospitalized with influenza or COVID-19 in the United States.
METHODS
The Influenza Hospitalization Surveillance Network (FluSurv-NET) [8] and the Coronavirus Disease 2019–Associated Hospitalization Surveillance Network (COVID-NET) [12, 13] conduct population-based surveillance for laboratory-confirmed influenza- and COVID-19–associated hospitalizations, respectively. FluSurv-NET was initiated in 2003–2004. COVID-NET was initiated in March 2020 using the FluSurv-NET infrastructure [12]. During 2017–2018 through 2020–2021, FluSurv-NET was conducted in select counties in 14 states participating in the Emerging Infections Program (California, Colorado, Connecticut, Georgia, Maryland [Baltimore metropolitan area], Minnesota, New Mexico, New York, Oregon, and Tennessee) or the Influenza Hospitalization Surveillance Project (Iowa [2020–2021 only], Michigan, Ohio, and Utah), with a catchment population of approximately 29 million persons. COVID-NET conducts surveillance in all FluSurv-NET counties and statewide in Maryland, with a catchment population of approximately 32 million persons.
FluSurv-NET surveillance is conducted during each influenza season (1 October through 30 April) and COVID-NET surveillance is conducted year-round [8, 13]. A FluSurv-NET or COVID-NET case is defined as a hospitalized patient who is a resident of the system’s catchment area, with a positive influenza (rapid antigen detection, molecular assay, direct or indirect immunofluorescence assay, or viral culture) or SARS-CoV-2 (rapid antigen detection or molecular assay) test during or within 14 days before hospitalization. Influenza virus or SARS-CoV-2 testing is performed at the discretion of healthcare practitioners or according to hospital testing practices. Trained surveillance staff identify all catchment area residents hospitalized with influenza or COVID-19 using laboratory, hospital, and reportable conditions databases.
Medical records were abstracted using standardized data-collection forms to obtain information on demographics, clinical characteristics, interventions (invasive mechanical ventilation [IMV] and extracorporeal membrane oxygenation), and outcomes (intensive care unit [ICU] admission, pneumonia, and death from any cause) during an influenza- or COVID-19–associated hospitalization.
Obesity status was determined using body mass index (≥ 95th percentile for sex and age), International Classification of Diseases, Tenth Revision, Clinical Modification (ICD-10-CM), discharge diagnosis codes, and problem lists. Acute symptoms at admission were abstracted from history and physical examination notes; the list of abstracted symptoms varied by surveillance platform and year. Acute respiratory or febrile symptoms (fever, congestion/runny nose, cough, shortness of breath, sore throat, upper respiratory illness or influenza-like illness, and wheezing) were abstracted for all FluSurv-NET seasons and for COVID-NET. Additional symptoms abstracted for FluSurv-NET by season and for COVID-NET are detailed in Table 1 and Supplementary Table 1.
Demographic and Clinical Characteristics of Children <18 Years Old Hospitalized With Influenza or COVID-19: FluSurv-NET and COVID-NET
| FluSurv-NET | COVID-NET | FluSurv-NET | COVID-NET | |||||
|---|---|---|---|---|---|---|---|---|
| 0–4 Years (n = 3906) | 5–11 Years (n = 2013) | 12–17 Years (n = 855) | 0–4 Years (n = 1293) | 5–11 Years (n = 698) | 12–17 Years (n = 1470) | 0–17 Years (n = 6774) | 0–17 Years (n = 3461) | |
| Age, median (IQR), years | 1 (0.6–2) | 7 (6–9) | 14 (13–16) | 1 (0.1–2) | 8 (6–10) | 15 (14–17) | 3 (1–7) | 9 (1–15) |
| Sex | ||||||||
| Male | 2231 (57.1) | 1166 (57.9) | 419 (49.0) | 694 (53.7) | 379 (54.3) | 625 (42.5) | 3816 (56.3) | 1698 (49.1) |
| Female | 1674 (42.9) | 847 (42.1) | 436 (51.0) | 599 (46.3) | 319 (45.7) | 845 (57.5) | 2957 (43.7) | 1763 (50.9) |
| Race/ethnicity | ||||||||
| American Indian or Alaska Native, NH | 61 (1.6) | 20 (1.0) | 11 (1.3) | 15 (1.2) | 7 (1.0) | 18 (1.2) | 92 (1.4) | 40 (1.2) |
| Asian or Pacific Islander, NH | 267 (6.8) | 93 (4.6) | 46 (5.4) | 76 (5.9) | 28 (4.0) | 51 (3.5) | 406 (6.0) | 155 (4.5) |
| Black, NH | 1065 (27.3) | 575 (28.6) | 216 (25.3) | 394 (30.5) | 258 (37.0) | 482 (32.8) | 1856 (27.4) | 1134 (32.8) |
| Hispanic | 1022 (26.2) | 445 (22.1) | 195 (22.8) | 350 (27.1) | 186 (26.6) | 407 (27.7) | 1662 (24.5) | 943 (27.2) |
| White, NH | 1155 (29.6) | 748 (37.2) | 333 (38.9) | 362 (28.0) | 188 (26.9) | 436 (29.7) | 2236 (33.0) | 986 (28.5) |
| Insurance status | ||||||||
| Private insurance | 1459 (37.4) | 933 (46.3) | 380 (44.4) | 569 (44.0) | 271 (38.8) | 626 (42.6) | 2772 (40.9) | 1466 (42.4) |
| Federal insurance | 2588 (66.3) | 1212 (60.2) | 513 (60.0) | 791 (61.2) | 460 (65.9) | 908 (61.8) | 4313 (63.7) | 2159 (62.4) |
| Other insurance | 45 (1.2) | 15 (0.7) | 5 (0.6) | 37 (2.9) | 29 (4.2) | 42 (2.9) | 65 (1.0) | 108 (3.1) |
| Uninsured | 79 (2.0) | 49 (2.4) | 19 (2.2) | 47 (3.6) | 10 (1.4) | 50 (3.4) | 147 (2.2) | 107 (3.1) |
| Symptoms | ||||||||
| Symptom onset to admission, median (IQR), days | 3 (1–5) | 3 (1–5) | 2 (1–4) | 2 (1–4) | 3 (1–5) | 4 (2–7) | 3 (1–5) | 3 (1–6) |
| Any symptom(s) | 3810 (97.5) | 1948 (96.8) | 806 (94.3) | 1104 (85.4) | 596 (85.4) | 1060 (72.1) | 6564 (96.9) | 2760 (79.7) |
| Fever | 3364 (86.1) | 1705 (84.7) | 655 (76.6) | 781 (60.4) | 380 (54.4) | 531 (36.1) | 5724 (84.5) | 1692 (48.9) |
| Congestion | 2693 (68.9) | 1101 (54.7) | 404 (47.3) | 583 (45.1) | 149 (21.3) | 267 (18.2) | 4198 (62.0) | 999 (28.9) |
| Cough | 3129 (80.1) | 1561 (77.5) | 626 (73.2) | 531 (41.1) | 247 (35.4) | 475 (32.3) | 5316 (78.5) | 1253 (36.2) |
| Shortness of breath | 1694 (43.4) | 745 (37.0) | 316 (37.0) | 325 (25.1) | 137 (19.6) | 444 (30.2) | 2755 (40.7) | 906 (26.2) |
| Sore throata | 92 (10.0) | 396 (19.7) | 283 (33.1) | 18 (9.6) | 103 (14.8) | 231 (15.7) | 771 (20.4) | 352 (14.9) |
| Upper respiratory illnessb | 591 (15.1) | 277 (13.8) | 139 (16.3) | 85 (6.6) | 11 (1.6) | 35 (2.4) | 1007 (14.9) | 131 (3.8) |
| Wheezing | 661 (16.9) | 346 (17.2) | 132 (15.4) | 110 (8.5) | 47 (6.7) | 47 (3.2) | 1139 (16.8) | 204 (5.9) |
| Any febrile or respiratory symptom | 3770 (96.5) | 1924 (95.6) | 780 (91.2) | 989 (76.5) | 483 (69.2) | 769 (52.3) | 6474 (95.6) | 2241 (64.8) |
| Altered mental state/confusion | 133 (3.4) | 121 (6.0) | 68 (8.0) | 35 (2.7) | 46 (6.6) | 75 (5.1) | 322 (4.8) | 156 (4.5) |
| Seizure | 330 (8.4) | 123 (6.1) | 34 (4.0) | 55 (4.3) | 43 (6.2) | 31 (2.1) | 487 (7.2) | 129 (3.7) |
| Other symptom(s)c | 836 (66.8) | 490 (79.9) | 257 (83.4) | 818 (63.3) | 490 (70.2) | 922 (62.7) | 1583 (72.9) | 2230 (64.4) |
| No symptoms | 96 (2.5) | 65 (3.2) | 49 (5.7) | 189 (14.6) | 102 (14.6) | 410 (27.9) | 210 (3.1) | 701 (20.3) |
Data are presented as n (%) unless otherwise indicated. FluSurv-NET data include the 2017–2018, 2018–2019, and 2019–2020 seasons. Surveillance is conducted during 1 October–30 April each season. The FluSurv-NET catchment area includes California, Colorado, Connecticut, Georgia, Maryland (Baltimore Metropolitan Area), Michigan, Minnesota, New Mexico, New York, Ohio, Oregon, Tennessee, and Utah. Detailed clinical data on hospitalized cases from Maryland were unavailable for the 2019–2020 influenza season and were not included. COVID-NET data during 1 October 2020–30 September 2021 are included. The COVID-NET catchment area includes California, Colorado, Connecticut, Georgia, Iowa, Maryland (entire state), Michigan, Minnesota, New Mexico, New York, Ohio, Oregon, Tennessee, and Utah. Abbreviations: COVID-19, coronavirus disease 2019; COVID-NET, COVID-19–Associated Hospitalization Surveillance Network; FluSurv-NET, Influenza Hospitalization Surveillance Network; IQR, interquartile range; NH, non-Hispanic.
Data on sore throat were collected for children of all ages but reported only among children ages ≥3 years (for FluSurv-NET: n = 920 children ages 3–4 and n = 3788 ages 3–17 years; for COVID-NET: n = 188 ages 3–4 and n = 2356 ages 3–17 years).
Upper respiratory illness was included as a symptom if there was a note in the medical chart referring to a patient having “upper respiratory illness” or “influenza-like illness”.
Symptoms listed above this row were collected by COVID-NET and by FluSurv-NET during all seasons. Other symptoms collected by COVID-NET were myalgia, chest pain, loss of taste, loss of smell, diarrhea, conjunctivitis, fatigue, headache, rash, nausea/vomiting, abdominal pain, and hemoptysis; for children <2 years old symptoms also included apnea, cyanosis, decreased vocalization/stridor, dehydration, hypothermia, inability to eat/poor feeding, and lethargy. Other symptoms collected by FluSurv-NET only during the 2017–2018 season were myalgia, chest pain, diarrhea, conjunctivitis, fatigue, headache, nausea/vomiting, and rash. Denominators for percentages for other symptoms for FluSurv-NET for the 2017–2018 season were for ages 0–4 (n = 1251), ages 5–11 (n = 613), ages 12–17 (n = 308), and ages 0–17 years (n = 2172). No additional symptoms were collected for FluSurv-NET during the 2018–2019 or 2019–2020 seasons.
Monthly hospitalization counts were determined for influenza (October–April during the 2017–2018 through 2020–2021 influenza seasons) and COVID-19 (March 2020–September 2021). Unadjusted influenza- and COVID-19–associated hospitalization rates per 100 000 children were calculated by dividing the total number of hospitalizations by National Center for Health Statistics population denominators [14]. The COVID-19–associated hospitalization rate was calculated for a 1-year period (1 October 2020–30 September 2021). This annual rate was compared with influenza-associated hospitalization rates during 1 October–30 April of each of the 2017–2018 through 2019–2020 influenza seasons. Influenza occurs seasonally in the United States, with low detection during May–September [15, 16], suggesting few influenza-associated hospitalizations are missed outside the October–April surveillance window. Thus, influenza-associated hospitalization rates during October–April were used to represent annual rates. Weekly hospitalization rates per 100 000 children were calculated for influenza (overall and by influenza virus type) and COVID-19. In a post hoc analysis, preliminary influenza- and COVID-19–associated hospitalization rates per 100 000 children during the current season, 1 October 2021–9 April 2022, were calculated.
The frequencies of select characteristics and outcomes were calculated for children hospitalized with influenza (2017–2018 through 2019–2020 influenza seasons), and COVID-19 (1 October 2020–30 September 2021). Children with laboratory-confirmed influenza or COVID-19 may have been hospitalized primarily for other reasons but found incidentally to have influenza or COVID-19. We conducted sensitivity analyses to determine whether severe outcomes differed by symptom status (presence of ≥1 symptom at admission) for both influenza and COVID-19, and by admission reason for COVID-19 (these data were not available in FluSurv-NET). For COVID-NET, the primary admission reason was determined from the chief complaint and history of present illness.
P values were calculated using Pearson chi-square or Wilcoxon rank-sum tests. Statistical significance was set at α = .05; all tests were 2-sided. For hospitalization rates and select analyses of characteristics and outcomes, 95% confidence intervals (CIs) for binomial proportions were calculated using the Clopper-Pearson method. Statistical analyses were performed in SAS version 9.4 (SAS Institute).
FluSurv-NET and COVID-NET surveillance activities were reviewed by the Centers for Disease Control and Prevention (CDC) and conducted consistent with applicable federal law and CDC policy [eg, 45 CFR Part 46.102(l)(2), 21 CFR Part 56; 42 USC §241(d); 5 USC §552a; 44 USC §3501 et seq]. Sites participating in FluSurv-NET and COVID-NET obtained human subjects and ethics approvals from their respective state and local health department and academic partner institutional review boards as needed.
RESULTS
From October 2017 until February 2020, monthly influenza-associated hospitalization counts followed a typical seasonal pattern (Figure 1); during March–April 2020, influenza-associated hospitalizations decreased abruptly, coinciding with the 16 March 2020 release of national guidance for slowing the spread of COVID-19, which included school closures and other mitigation measures [17]. Subsequently, during 1 October 2020–30 April 2021, only 9 influenza-associated hospitalizations among children were reported to FluSurv-NET. Starting in March 2020 (when COVID-NET surveillance was initiated) through September 2021, COVID-19–associated hospitalizations were identified in children each month (range: 22–470 hospitalizations).
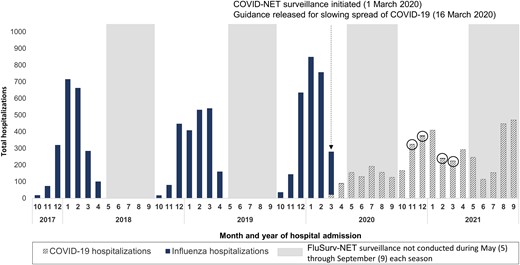
Counts of COVID-19– and influenza-associated hospitalizations by month among children <18 years old: FluSurv-NET and COVID-NET, October 2017–September 2021. The 9 influenza-associated hospitalizations reported to FluSurv-NET during 1 October 2020–30 April 2021 are circled to improve visibility. The FluSurv-NET catchment area includes California, Colorado, Connecticut, Georgia, Iowa (2020–2021 season only), Maryland (Baltimore Metropolitan Area), Michigan, Minnesota, New Mexico, New York, Ohio, Oregon, Tennessee, and Utah. The COVID-NET catchment area includes California, Colorado, Connecticut, Georgia, Iowa, Maryland (entire state), Michigan, Minnesota, New Mexico, New York, Ohio, Oregon, Tennessee, and Utah. Guidance for slowing the spread of COVID-19 was released on 16 March 2020, after which school closures began (see, eg, https://www.cdc.gov/mmwr/volumes/69/wr/mm6915e2.htm). Abbreviations: COVID-19, coronavirus disease 2019; COVID-NET, COVID-19–Associated Hospitalization Surveillance Network; FluSurv-NET, Influenza Hospitalization Surveillance Network.
Among all children, influenza-associated hospitalization rates during the 3 seasons before the COVID-19 pandemic (2017–2018 through 2019–2020; rate range: 33.5–41.7; 95% CI of highest-burden season [2019–2020]: 40.2–43.3) were lower than 1 annual COVID-19–associated hospitalization rate observed during October 2020–September 2021 of the ongoing COVID-19 pandemic (48.2; 95% CI: 46.6–49.8) (Figure 2; Supplementary Table 2). However, differences were observed by age. Among children 0–4 years old, the influenza-associated hospitalization rate for the 2019–2020 season (91.5) was higher than, and for the 2017–2018 season (71.0) and 2018–2019 season (70.9) rates were similar to, the COVID-19–associated hospitalization rate (66.8). Among children 5–11 years old, influenza-associated hospitalization rates (2017–2018 through 2019–2020: 24.3–31.7) were similar to the COVID-19–associated hospitalization rate (25.0). Among adolescents (12–17 years old), influenza-associated hospitalization rates (2017–2018 through 2019–2020: 12.2–14.1) were lower than the COVID-19–associated hospitalization rate (59.9).
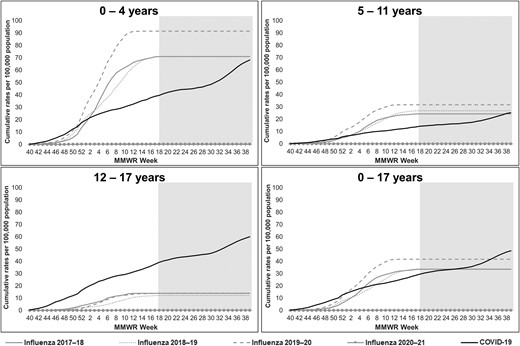
Cumulative influenza- and COVID-19–associated hospitalization rates per 100 000 children <18 years old, by age group: FluSurv-NET and COVID-NET, 2017–2021. Each season, FluSurv-NET surveillance is conducted from MMWR week 40 (around October 1) of one year to MMWR week 18 (around April 30) of the subsequent year. The gray-shaded area on each panel indicates weeks during which FluSurv-NET surveillance was not conducted but COVID-NET surveillance was conducted. FluSurv-NET rate lines were extended beyond week 18 for ease of comparison with COVID-NET rate lines. The COVID-NET surveillance period of October 2020–September 2021 begins at MMWR week 40 of year 2020 and ends at MMWR week 39 of year 2021. MMWR week 53 for year 2020 is combined with MMWR week 52 for consistency with other years. Abbreviations: COVID-19, coronavirus disease 2019; COVID-NET, COVID-19–Associated Hospitalization Surveillance Network; FluSurv-NET, Influenza Hospitalization Surveillance Network.
During 1 October 2021–9 April 2022, the preliminary COVID-19–associated hospitalization rate among all children was higher than influenza-associated hospitalization rates during October–April of 2017–2018 through 2021–2022 and was also higher than the annual COVID-19–associated hospitalization rate during October 2020–September 2021 (Supplementary Figure 2A). Increases in the COVID-19–associated hospitalization rate were largely driven by increased rates among infants 0–6 months old (Supplementary Figure 2B).
Weekly influenza-associated hospitalization rates peaked in February during all 3 seasons before the COVID-19 pandemic (peak weekly rate range: 2.4–4.0). Rates varied by influenza virus type (Supplementary Figure 1). The highest weekly rate of COVID-19 during October 2020–September 2021 (1.8) occurred in September 2021.
Among 6774 children hospitalized with influenza during 2017–2018 through 2019–2020 and 3461 children hospitalized with COVID-19 during October 2020–September 2021, the median age was lower for influenza (3 years; interquartile range [IQR]: 1–7 years) than COVID-19 (9 years; IQR: 1–15 years) (Table 1). Other demographic characteristics were similar. Overall, 6564 children with influenza (96.9%) and 2760 children with COVID-19 (79.7%) had 1 or more symptom at admission. A higher proportion of children with influenza had 1 or more respiratory or febrile symptom compared with those with COVID-19 (95.6% vs 64.8%). Other common symptoms among children with influenza versus COVID-19 included nausea/vomiting (40.1% vs 34.4%), fatigue (29.1% vs 19.0%), and diarrhea (13.8% vs 15.8%) (Supplementary Table 1).
Overall, 3774 children hospitalized with influenza (55.7%) and 1857 children hospitalized with COVID-19 (53.7%) had 1 or more underlying medical condition (Table 2). Asthma/reactive airway disease, neurologic disorder, and obesity were the most prevalent conditions for influenza and COVID-19. A higher proportion of children with influenza compared with COVID-19 had asthma (23.6% vs 16.3%) or chronic lung disease (6.0% vs 3.3%), but lower proportions had diabetes (1.2% vs 3.8%) or obesity (17.5% vs 35.0%).
Underlying Medical Conditions, Interventions, and Outcomes of Children <18 Years Old Hospitalized With Influenza or COVID-19: FluSurv-NET and COVID-NET
| FluSurv-NET | COVID-NET | FluSurv-NET | COVID-NET | Pa | |||||
|---|---|---|---|---|---|---|---|---|---|
| 0–4 Years (n = 3906) | 5–11 Years (n = 2013) | 12–17 Years (n = 855) | 0–4 Years (n = 1293) | 5–11 Years (n = 698) | 12–17 Years (n = 1470) | 0–17 Years (n = 6774) | 0–17 Years (n = 3461) | ||
| Underlying medical conditions | |||||||||
| Any underlying medical condition(s) | 1722 (44.1) | 1383 (68.7) | 669 (78.2) | 476 (36.8) | 468 (67.0) | 913 (62.1) | 3774 (55.7) | 1857 (53.7) | .05 |
| Asthma/reactive airway disease | 554 (14.2) | 723 (35.9) | 321 (37.5) | 63 (4.9) | 161 (23.1) | 340 (23.1) | 1598 (23.6) | 564 (16.3) | <.01 |
| Chronic lung disease | 192 (4.9) | 141 (7.0) | 72 (8.4) | 39 (3.0) | 35 (5.0) | 41 (2.8) | 405 (6.0) | 115 (3.3) | <.01 |
| Chronic metabolic disease | 82 (2.1) | 93 (4.6) | 96 (11.2) | 31 (2.4) | 46 (6.6) | 128 (8.7) | 271 (4.0) | 205 (5.9) | <.01 |
| Diabetes mellitus | 8 (0.2) | 28 (1.4) | 45 (5.3) | 9 (0.7) | 26 (3.7) | 97 (6.6) | 81 (1.2) | 132 (3.8) | <.01 |
| Blood disorders/hemoglobinopathy | 152 (3.9) | 153 (7.6) | 88 (10.3) | 51 (3.9) | 68 (9.7) | 64 (4.4) | 393 (5.8) | 183 (5.3) | .29 |
| Sickle cell disease | 103 (2.6) | 116 (5.8) | 63 (7.4) | 33 (2.6) | 52 (7.4) | 44 (3.0) | 282 (4.2) | 129 (3.7) | .29 |
| Cardiovascular disease | 289 (7.4) | 135 (6.7) | 63 (7.4) | 133 (10.3) | 75 (10.7) | 104 (7.1) | 487 (7.2) | 312 (9.0) | <.01 |
| Congenital heart disease | 186 (4.8) | 71 (3.5) | 28 (3.3) | 69 (5.3) | 28 (4.0) | 24 (1.6) | 285 (4.2) | 121 (3.5) | .08 |
| Neurologic disorder | 474 (12.1) | 423 (21.0) | 211 (24.7) | 127 (9.8) | 154 (22.1) | 207 (14.1) | 1108 (16.4) | 488 (14.1) | <.01 |
| Immunocompromised condition | 149 (3.8) | 187 (9.3) | 118 (13.8) | 45 (3.5) | 62 (8.9) | 72 (4.9) | 454 (6.7) | 179 (5.2) | <.01 |
| Renal disease | 47 (1.2) | 57 (2.8) | 29 (3.4) | 13 (1.0) | 12 (1.7) | 38 (2.6) | 133 (2.0) | 63 (1.8) | .62 |
| Gastrointestinal/liver disease | 21 (0.5) | 26 (1.3) | 14 (1.6) | 21 (1.6) | 24 (3.4) | 30 (2.0) | 61 (0.9) | 75 (2.2) | <.01 |
| Obesityb | 168 (13.6) | 304 (18.6) | 157 (21.7) | 36 (15.1) | 167 (30.7) | 458 (41.4) | 629 (17.5) | 661 (35.0) | <.01 |
| Prematurec | 374 (12.5) | 0 | 0 | 142 (12.9) | 0 | 0 | 374 (12.5) | 142 (12.9) | .78 |
| No underlying medical conditions | 2184 (55.9) | 630 (31.3) | 186 (21.8) | 817 (63.2) | 230 (33.0) | 557 (37.9) | 3000 (44.3) | 1604 (46.3) | .05 |
| Interventions and outcomes | |||||||||
| Hospital length of stay, median (IQR), days | 2 (1–3) | 2 (1–4) | 2 (1–4) | 2 (1–4) | 3 (2–6) | 3 (2–6) | 2 (1–4) | 3 (2–5) | <.01 |
| Pneumoniad | 687 (17.6) | 378 (18.8) | 143 (16.7) | 89 (6.9) | 93 (13.3) | 279 (19.0) | 1208 (17.8) | 461 (13.3) | <.01 |
| ICU admission | 810 (20.7) | 425 (21.1) | 229 (26.8) | 304 (23.5) | 203 (29.1) | 406 (27.6) | 1464 (21.6) | 913 (26.4) | <.01 |
| IMV | 209 (5.4) | 92 (4.6) | 55 (6.4) | 76 (5.9) | 50 (7.2) | 90 (6.1) | 356 (5.3) | 216 (6.2) | .04 |
| ECMO | 14 (0.4) | 10 (0.5) | 4 (0.5) | 4 (0.3) | 1 (0.1) | 9 (0.6) | 28 (0.4) | 14 (0.4) | .95 |
| Died during hospitalization | 19 (0.5) | 12 (0.6) | 6 (0.7) | 10 (0.8) | 3 (0.4) | 12 (0.8) | 37 (0.5) | 25 (0.7) | .28 |
Data are presented as n (%) unless otherwise indicated. FluSurv-NET data include the 2017–2018, 2018–2019, and 2019–2020 seasons. Surveillance is conducted during 1 October–30 April each season. The FluSurv-NET catchment area includes California, Colorado, Connecticut, Georgia, Maryland (Baltimore Metropolitan Area), Michigan, Minnesota, New Mexico, New York, Ohio, Oregon, Tennessee, and Utah. Detailed clinical data on hospitalized cases from Maryland were unavailable for the 2019–2020 influenza season and were not included. COVID-NET data during 1 October 2020–30 September 2021 are included. The COVID-NET catchment area includes California, Colorado, Connecticut, Georgia, Iowa, Maryland (entire state), Michigan, Minnesota, New Mexico, New York, Ohio, Oregon, Tennessee, and Utah. Abbreviations: BMI, body mass index; COVID-19, coronavirus disease 2019; COVID-NET, COVID-19–Associated Hospitalization Surveillance Network; ECMO, extracorporeal membrane oxygenation; FluSurv-NET, Influenza Hospitalization Surveillance Network; ICD-10-CM, International Classification of Diseases, Tenth Revision, Clinical Modification; ICU, intensive care unit; IMV, invasive mechanical ventilation; IQR, interquartile range.
P values are for the comparison of children aged 0–17 years in FluSurv-NET versus COVID-NET.
Obesity status is determined for nonpregnant persons ≥2 years old by calculated BMI (≥ 95th percentile for sex and age), obesity or morbid obesity selected as an underlying medical condition, or ICD-10-CM code E66.0, E66.09, E66.1, E66.8, E66.9, E66.01, E66.2, or Z68.4 entered as a discharge diagnosis. Percentages for obesity are calculated for pediatric cases with nonmissing obesity data for FluSurv-NET: ages 2–4 (n = 1233), ages 5–11 (n = 1631), ages 12–17 (n = 723), ages 2–17 years (n = 3587); and for COVID-NET: ages 2–4 (n = 239), ages 5–11 (n = 544), ages 12–17 (n = 1107), ages 2–17 years (n = 1890).
Percentages for premature are calculated for children ages 0–2 years for FluSurv-NET (n = 2986) and for COVID-NET (n = 1105).
A standardized pneumonia case definition is used, which includes a combination of radiographic findings of bronchopneumonia, air space opacity, consolidation, lobar or interstitial infiltrate within 3 days of hospital admission for FluSurv-NET and at any time during hospitalization for COVID-NET, and either an ICD-10-CM–coded discharge diagnosis of pneumonia or documentation of pneumonia on hospital discharge summary.
The median hospital length of stay was lower for children with influenza compared with COVID-19 (2 vs 3 days; P < .01) (Table 2). A higher proportion of children with influenza compared with COVID-19 had pneumonia (17.8% vs 13.3%; P < .01), but lower proportions required IMV (5.3% vs 6.2%; P = .04) or ICU admission (21.6% vs 26.4%; P < .01). The proportion of children with influenza vs COVID-19 who died during hospitalization was similar (0.5% vs 0.7%, P = .28).
In sensitivity analyses, proportions experiencing severe outcomes were similar when examining the following hospitalization categories: all influenza- or COVID-19–associated hospitalizations, influenza- or COVID-19–associated hospitalizations with 1 or more symptom at admission (96.9% of 6774 influenza hospitalizations and 79.7% of 3461 COVID-19 hospitalizations), and COVID-19–associated hospitalizations with COVID-19 as the primary admission reason (74.9% of COVID-19–associated hospitalizations) (Table 3). Among COVID-19–associated hospitalizations, proportions with pneumonia or ICU admission increased modestly with increasing age when restricted to hospitalizations with 1 or more symptom at admission or COVID-19 as the primary admission reason. However, other severe outcomes such as IMV and in-hospital death were similar across the hospitalization categories.
Interventions and Outcomes Among Children <18 Years Old Hospitalized With Influenza or COVID-19 by Symptom Status and Reason for Admission: FluSurv-NET and COVID-NET
| Interventions and Outcomes | COVID-NET All Hospitalizations | COVID-NET ≥1 Symptom at Admissiona | COVID-NET Admission Primarily for COVID-19b | FluSurv-NET All Hospitalizations | FluSurv-NET ≥1 Symptom at Admissiona | |||||
|---|---|---|---|---|---|---|---|---|---|---|
| n | % (95% CI)c | n | % (95% CI)c | n | % (95% CI)c | n | % (95% CI)c | n | % (95% CI)c | |
| Ages 0–17, n | 3461 | 2760 | 2594 | 6774 | 6564 | |||||
| ȃLOS, median (IQR) | 3 (2–5) | 3 (2–5) | 3 (2–5) | 2 (1–4) | 2 (1–4) | |||||
| ȃPneumoniad | 461 | 13.3 (12.2–14.5) | 457 | 16.6 (15.2–18.0) | 452 | 17.4 (16.0–18.9) | 1208 | 17.8 (16.9–18.8) | 1200 | 18.3 (17.4–19.2) |
| ȃICU admission | 913 | 26.4 (24.9–27.9) | 811 | 29.4 (27.7–31.1) | 781 | 30.1 (28.3–31.9) | 1464 | 21.6 (20.6–22.6) | 1419 | 21.6 (20.6–22.6) |
| ȃIMV | 216 | 6.2 (5.5–7.1) | 162 | 5.9 (5.0–6.8) | 146 | 5.6 (4.8–6.6) | 356 | 5.3 (4.7–5.8) | 341 | 5.2 (4.7–5.8) |
| ȃECMO | 14 | 0.4 (.2–.7) | 12 | 0.4 (.2–.8) | 12 | 0.5 (.2–.8) | 28 | 0.4 (.3–.6) | 28 | 0.4 (.3–.6) |
| ȃDied in hospital | 25 | 0.7 (.5–1.1) | 18 | 0.7 (.4–1.0) | 18 | 0.7 (.4–1.1) | 37 | 0.5 (.4–.8) | 35 | 0.5 (.4–.7) |
| Ages 0–4, n | 1293 | 1104 | 1106 | 3906 | 3810 | |||||
| ȃLOS, median (IQR) | 2 (1–4) | 2 (1–4) | 2 (1–4) | 2 (1–3) | 2 (1–3) | |||||
| ȃPneumoniad | 89 | 6.9 (5.6–8.4) | 88 | 8.0 (6.4–9.7) | 89 | 8.0 (6.5–9.8) | 687 | 17.6 (16.4–18.8) | 684 | 18.0 (16.7–19.2) |
| ȃICU admission | 304 | 23.5 (21.2–25.9) | 270 | 24.5 (21.9–27.1) | 269 | 24.3 (21.8–27.0) | 810 | 20.7 (19.5–22.0) | 788 | 20.7 (19.4–22.0) |
| ȃIMV | 76 | 5.9 (4.7–7.3) | 59 | 5.3 (4.1–6.8) | 58 | 5.2 (4.0–6.7) | 209 | 5.4 (4.7–6.1) | 201 | 5.3 (4.6–6.0) |
| ȃECMO | 4 | 0.3 (.1–.8) | 3 | 0.3 (.1–.8) | 3 | 0.3 (.1–.8) | 14 | 0.4 (.2–.6) | 14 | 0.4 (.2–.6) |
| ȃDied in hospital | 10 | 0.8 (.4–1.4) | 8 | 0.7 (.3–1.4) | 9 | 0.8 (.4–1.5) | 19 | 0.5 (.3–.8) | 19 | 0.5 (.3–.8) |
| Ages 5–11, n | 698 | 596 | 573 | 2013 | 1948 | |||||
| ȃLOS, median (IQR) | 3 (2–6) | 3 (2–6) | 3 (2–6) | 2 (1–4) | 2 (1–4) | |||||
| ȃPneumoniad | 93 | 13.3 (10.9–16.1) | 92 | 15.4 (12.6–18.6) | 93 | 16.2 (13.3–19.5) | 378 | 18.8 (17.1–20.6) | 375 | 19.3 (17.5–21.1) |
| ȃICU admission | 203 | 29.1 (25.7–32.6) | 193 | 32.4 (28.6–36.3) | 191 | 33.3 (29.5–37.4) | 425 | 21.1 (19.3–23.0) | 408 | 20.9 (19.2–22.8) |
| ȃIMV | 50 | 7.2 (5.4–9.3) | 39 | 6.5 (4.7–8.8) | 36 | 6.3 (4.4–8.6) | 92 | 4.6 (3.7–5.6) | 89 | 4.6 (3.7–5.6) |
| ȃECMO | 1 | 0.1 (.0–.8) | 1 | 0.2 (.0–.9) | 1 | 0.2 (.0–1.0) | 10 | 0.5 (.2–.9) | 10 | 0.5 (.2–.9) |
| ȃDied in hospital | 3 | 0.4 (.1–1.3) | 2 | 0.3 (.0–1.2) | 1 | 0.2 (.0–1.0) | 12 | 0.6 (.3–1.0) | 10 | 0.5 (.2–.9) |
| Ages 12–17, n | 1470 | 1060 | 915 | 855 | 806 | |||||
| ȃLOS, median (IQR) | 3 (2–6) | 3 (2–6) | 3 (2–6) | 2 (1–4) | 2 (1–4) | |||||
| ȃPneumoniad | 279 | 19.0 (17.0–21.1) | 277 | 26.1 (23.5–28.9) | 270 | 29.5 (26.6–32.6) | 143 | 16.7 (14.3–19.4) | 141 | 17.5 (14.9–20.3) |
| ȃICU admission | 406 | 27.6 (25.3–30.0) | 348 | 32.8 (30.0–35.7) | 321 | 35.1 (32.0–38.3) | 229 | 26.8 (23.8–29.9) | 223 | 27.7 (24.6–30.9) |
| ȃIMV | 90 | 6.1 (5.0–7.5) | 64 | 6.0 (4.7–7.6) | 52 | 5.7 (4.3–7.4) | 55 | 6.4 (4.9–8.3) | 51 | 6.3 (4.7–8.2) |
| ȃECMO | 9 | 0.6 (.3–1.2) | 8 | 0.8 (.3–1.5) | 8 | 0.9 (.4–1.7) | 4 | 0.5 (.1–1.2) | 4 | 0.5 (.1–1.3) |
| ȃDied in hospital | 12 | 0.8 (.4–1.4) | 8 | 0.8 (.3–1.5) | 8 | 0.9 (.4–1.7) | 6 | 0.7 (.3–1.5) | 6 | 0.7 (.3–1.6) |
Data are presented as n (%) unless otherwise indicated. FluSurv-NET data include the 2017–2018, 2018–2019, and 2019–2020 seasons. Surveillance is conducted during 1 October–30 April each season. The FluSurv-NET catchment area includes California, Colorado, Connecticut, Georgia, Maryland (Baltimore Metropolitan Area), Michigan, Minnesota, New Mexico, New York, Ohio, Oregon, Tennessee, and Utah. Detailed clinical data on hospitalized cases from Maryland were unavailable for the 2019–2020 influenza season and were not included. COVID-NET data during 1 October 2020–30 September 2021 are included. The COVID-NET catchment area includes California, Colorado, Connecticut, Georgia, Iowa, Maryland (entire state), Michigan, Minnesota, New Mexico, New York, Ohio, Oregon, Tennessee, and Utah. Abbreviations: CI, confidence interval; COVID-19, coronavirus disease 2019; COVID-NET, COVID-19-Associated Hospitalization Surveillance Network; ECMO, extracorporeal membrane oxygenation; FluSurv-NET, Influenza Hospitalization Surveillance Network; ICD-10-CM, International Classification of Diseases, Tenth Revision, Clinical Modification; ICU, intensive care unit; IMV, invasive mechanical ventilation; IQR, interquartile range; LOS, hospital length of stay in days; SARS-CoV-2, severe acute respiratory syndrome coronavirus 2.
Includes COVID-NET or FluSurv-NET hospitalized patients who had ≥1 symptom present at hospital admission. The list of symptoms collected varied by surveillance platform and year. Acute respiratory or febrile symptoms were abstracted for all FluSurv-NET seasons and for COVID-NET and are defined as fever, congestion/runny nose, cough, shortness of breath, sore throat, upper respiratory illness or influenza-like illness, and wheezing. Other symptoms abstracted for all FluSurv-NET seasons and for COVID-NET are altered mental state/confusion and seizure. Other symptoms collected by COVID-NET were myalgia, chest pain, loss of taste, loss of smell, diarrhea, conjunctivitis, fatigue, headache, rash, nausea/vomiting, abdominal pain, and hemoptysis; for children <2 years symptoms also included apnea, cyanosis, decreased vocalization/stridor, dehydration, hypothermia, inability to eat/poor feeding, and lethargy. Other symptoms collected by FluSurv-NET during the 2017–18 season were myalgia, chest pain, diarrhea, conjunctivitis, fatigue, headache, nausea/vomiting, and rash.
Reason for admission is only collected in COVID-NET and includes the following categories: COVID-19 as the primary reason for admission, obstetrics/labor and delivery, inpatient surgery or procedures, psychiatric admission needing acute medical care, trauma, other, or unknown. If the chief complaint or history of present illness documents fever/respiratory illness, COVID-19–like illness, or a suspicion for COVID-19, a case is categorized as having COVID-19 as the primary reason for admission. If the chart specifically indicates that the positive SARS-CoV-2 test was an incidental finding or that the admission was likely not COVID-19 related, the “other, specify” reason for the admission is marked and the admission is noted as “admission likely not COVID-19-related per notes.” For other cases where the “other, specify” reason for admission is marked, an algorithm was developed which incorporates physician review of the free text provided to determine if COVID-19 was likely a primary reason for admission.
Exact 95% CIs for binomial proportions were calculated using the Clopper-Pearson method.
A standardized pneumonia case definition is used, which includes a combination of radiographic findings of bronchopneumonia, air space opacity, consolidation, lobar or interstitial infiltrate within 3 days of hospital admission, and either an ICD-10-CM–coded discharge diagnosis of pneumonia or documentation of pneumonia on hospital discharge summary.
DISCUSSION
Among children younger than 18 years old, the COVID-19–associated hospitalization rate during 1 year of the ongoing COVID-19 pandemic was higher than influenza-associated hospitalization rates during each of the 3 seasons before the pandemic, with differences observed by age group. Severe outcomes such as ICU admission, IMV, and in-hospital death were generally similar among children with COVID-19 compared with influenza. Influenza has long been recognized as an important cause of severe respiratory illness in children in the United States and globally [1, 18]. These data add to the growing literature demonstrating that COVID-19 is also an important cause of severe disease among children.
Prevention measures such as physical distancing, mask usage, and virtual learning likely contributed to historically low levels of influenza circulation during the 2020–2021 influenza season in the United States [19] and globally [20]. The influenza- and COVID-19–associated hospitalization rates among children during 2020–2021 would likely have been higher without mitigation measures. While influenza activity typically displays a seasonal pattern, peaking during December–March in the Northern Hemisphere [15, 19], COVID-19–associated hospitalizations occurred throughout 2020–2021 and no distinct seasonality can yet be distinguished. During the 2009 influenza A H1N1 pandemic (April 2009–April 2010), the H1N1pdm09 virus similarly circulated without distinct seasonality, resulting in spring and fall activity waves. Notably, H1N1pdm09-associated hospitalization and death rates were highest among children and younger adults [21]. In subsequent seasons, H1N1pdm09 displayed a typical seasonal circulation pattern, with decreasing pediatric burden as population immunity levels increased. Given the relatively condensed annual period during which seasonal influenza viruses circulate, peak weekly hospitalization rates were higher for influenza during 2017–2020 compared with COVID-19 during October 2020–September 2021, despite similar annual hospitalization rates. Co-circulation of influenza and SARS-CoV-2, along with other respiratory viruses, could exacerbate winter surges in pediatric hospitalizations, posing challenges to healthcare capacity [22, 23].
While more than 95% of hospitalized children with influenza had a respiratory or febrile symptom, approximately one-third of children with COVID-19 did not, and overall, 1 in 5 children with COVID-19 did not have any symptoms at admission. Large proportions of children with influenza or COVID-19 had nonrespiratory symptoms, highlighting a range of symptom presentations among children hospitalized with influenza and COVID-19. Relying on respiratory or febrile symptoms alone could result in missed opportunities to detect influenza or SARS-CoV-2 infections. Respiratory virus testing can help distinguish between these viruses and guide treatment and infection-prevention decisions [24–26]. There were also differences in the prevalence of underlying conditions among children with influenza versus COVID-19, which may, in part, be driven by differences in median age. The prevalence of obesity was approximately double among children with COVID-19 compared with influenza. Notably, the proportion of children with COVID-19 who were obese (35%) was similar to findings from another study of hospitalized children with COVID-19 (32%) [27] and higher than the national obesity prevalence among persons 2–19 years old (22% in 2020) [28].
Our analysis and others demonstrate that both influenza and COVID-19 can cause severe disease in children [4, 5]. Among hospitalized children, 22% with influenza and 26% with COVID-19 required ICU admission and 5% with influenza and 6% with COVID-19 required IMV. Proportions experiencing severe outcomes were generally similar when restricting to those with 1 or more symptom of influenza or COVID-19 at admission. Another analysis of COVID-19 hospitalizations among children younger than 18 years old during July–August 2021, when the B.1.617.2 (Delta) variant of SARS-CoV-2 was predominant, showed similar findings, with 29.5% requiring ICU admission and 7.9% requiring IMV [27]. Data on COVID-19 treatment in children are limited, but treatment may be indicated for hospitalized children who have an emergent or increasing need for supplemental oxygen [26]. To decrease the risk of severe complications, early antiviral treatment is recommended for children with suspected influenza who are hospitalized or at higher risk for influenza-associated complications, including children younger than 5 years old and those with underlying medical conditions [29].
Influenza vaccines are safe and effective at preventing hospitalizations and were available to children 6 months and older during all seasons included in this analysis [6, 30]. Based on national survey data, influenza vaccination coverage estimates among children 6 months and older ranged from 51% to 63% during the 2012–2013 to 2018–2019 seasons [31]. During 2019–2020, influenza vaccination averted an estimated 13 798 hospitalizations among children 6 months and older [30]. Adolescents were the only children eligible to receive COVID-19 vaccination for a portion of the time period covered in this analysis: approvals differed over time by age (12–15 and 16–17 years) [7]. As of 30 September 2021, 47% of US adolescents were considered up to date with all recommended COVID-19 doses [32]. COVID-19 vaccines are both safe and effective at preventing hospitalizations among adolescents and children 5–11 years old [33–36]. Increased COVID-19 vaccination coverage among children following the Emergency Use Authorization for COVID-19 vaccines in children 5–11 years old in October 2021 may contribute to differences in the relative rates of pediatric COVID-19– versus influenza-associated hospitalizations over time.
Several limitations should be considered. First, FluSurv-NET and COVID-NET cases may have been hospitalized for reasons other than influenza or COVID-19 [2]. This may have been more common for COVID-19 due to SARS-CoV-2 screening practices, which were universal among hospitalized patients at some facilities during certain time periods. While influenza or COVID-19 may not have been the primary reason for admission for all hospitalizations, such cases were included in rate calculations because the use of a standard and consistent surveillance case definition allows for robust monitoring of trends over time. Among cases with influenza or SARS-CoV-2 incidentally identified, it is unclear what impact the infection had on the decision to hospitalize a patient, the hospitalization course, or in-hospital outcomes. In sensitivity analyses limited to hospitalizations with 1 or more symptom at admission or COVID-19 as the primary reason for admission, proportions of children with severe outcomes were similar to proportions when all hospitalizations were included. Second, COVID-19– and influenza-associated hospitalizations might have been missed because case identification was reliant on clinician-directed or facility-based testing practices and test availability. Underdetection of influenza was likely greater than COVID-19 due to underutilization of seasonal influenza testing [30]. Third, the impact of extensive mitigation measures during the COVID-19 pandemic, and differential availability of COVID-19 vaccines by age group and time period, could not be measured and likely affects the comparison of influenza- to COVID-19–associated hospitalization rates. Fourth, only deaths occurring during hospitalizations were captured, which may miss out-of-hospital deaths associated with influenza or COVID-19 [37]. Fifth, the FluSurv-NET and COVID-NET catchment areas include approximately 9–10% of the US population and findings may not be generalizable to the entire country. Last, this analysis assessed COVID-19–associated hospitalization rates during a single year of the ongoing COVID-19 pandemic and did not capture rate fluctuations that have occurred due to the changing epidemiology of SARS-CoV-2, including the emergence of variants of concern.
The Omicron variant of SARS-CoV-2 emerged rapidly during December 2021 and resulted in a peak COVID-19 weekly hospitalization rate approximately 5 times as high as the peak hospitalization rate during the period of Delta variant predominance among children 0–4 years old, a group not yet eligible for COVID-19 vaccination [38]. Indeed, in a post hoc analysis that included months during which the Omicron variant was predominant in the United States, preliminary COVID-19–associated hospitalization rates among children during October 2021–April 2022 were higher than COVID-19–associated hospitalization rates observed during October 2020–September 2021 and influenza-associated hospitalization rates observed during the 2017–2018 through 2021–2022 seasons.
Influenza and SARS-CoV-2 are important causes of severe disease among children. Vaccines can help prevent illness and attenuate disease severity for both influenza and COVID-19. Prevention and mitigation measures, including vaccination of all eligible persons, are crucial to protect children, including those who are not yet eligible for or are too young for vaccination. Without such measures, co-circulation of influenza virus and SARS-CoV-2, along with other respiratory viruses, could exacerbate hospitalization surges and overwhelm healthcare capacity, particularly during winter months.
Supplementary Data
Supplementary materials are available at Clinical Infectious Diseases online. Consisting of data provided by the authors to benefit the reader, the posted materials are not copyedited and are the sole responsibility of the authors, so questions or comments should be addressed to the corresponding author.
Notes
Acknowledgments. Gretchen Rothrock, Jeremy Roland, Joelle Nadle, Pam Kirley (California Emerging Infections Program); Isaac Armistead, Sarah McLafferty (Colorado Department of Public Health and Environment); Adam Misiorski, Amber Maslar, Carol Lyons, Daewi Kim, Maria Correa, Paula Clogher, Tessa Carter (Connecticut Emerging Infections Program, Yale School of Public Health); Allison Roebling, Annabel Patterson, Asmit Joseph, Chandler Surell, Emily Fawcett, Grayson Kallas, Jana Manning, Jeremiah Williams, Katelyn Ward, Marina Bruck, Rayna Ceaser, Siyeh Gretzinger, Stephanie Lehman, Taylor Eisenstein (Georgia Emerging Infections Program, Georgia Department of Public Health, Atlanta Veterans Affairs Medical Center); Suzanne Segler (Division of Infectious Diseases, Emory University School of Medicine, Georgia Emerging Infections Program, Georgia Department of Public Health); Alicia Brooks, Cindy Zerrlaut, David Blythe, Elisabeth Vaeth (Maryland Department of Health); Michelle Wilson, Rachel Park (Maryland Emerging Infections Program, The Johns Hopkins Bloomberg School of Public Health); Alexander Kohrman, Chloe Brown, Jim Collins, Justin Henderson, Shannon Johnson, Sierra Peguies-Khan, Sue Kim, Val Tellez Nunez (Michigan Department of Health and Human Services); Alexandra Warzecha, Alison Babb, Amanda Gordon, Austin Bell, Claire Henrichsen, Cynthia Kenyon, Elizabeth Corey, Emily Holodnick, Emma Contestabile, Erica Bye, Grace Hernandez, Jackie Johnson, Jade Van Kley, Jennifer Gilbertson, Jill Reaney, Kathryn Como-Sabetti, Kayla Bilski, Kelli Aarstad, Kieu My Phipps, Lisa Nguyen, Natalie Bullis, Richie Xu, Samantha Siebman (Minnesota Department of Health); Chelsea McMullen, Emily Hancock, Jasmyn Sanchez, Kathy Angeles, Mayvilynne Poblete, Melissa Christian, Melissa Judson, Nancy Eisenberg, Sarah Khanlian, Sarah Lathrop, Sarah Shrum Davis, Sunshine Martinez, Wickliffe Omondi, Yadira Salazar-Sanchez, Yassir Talha (New Mexico Emerging Infections Program); Murtada Khalifa (CDC Foundation, New Mexico Department of Health); Cory Cline, Daniel Sosin (New Mexico Department of Health); Adam Rowe, Grant Barney, Kerianne Engesser, Suzanne McGuire (New York State Department of Health); Christina Felsen, Christine Long, Maria Gaitán, RaeAnne Kurtz, Sophrena Bushey, Thomas Peer, Virginia Cafferky (University of Rochester School of Medicine and Dentistry); Ann Salvator, Julie Freshwater (Ohio Department of Health); Ama Owusu-Dommey, Nasreen Abdullah, Nicole West, Sam Hawkins (Public Health Division, Oregon Health Authority); Anise Elie, Bentley Akoko, Danielle Ndi, John Ujwok, Karen Leib, Kathy Billings, Katie Dyer, Manideepthi Pemmaraju, Terri McMinn, Tiffanie Markus, Victoria Umutoni (Vanderbilt University Medical Center); Amanda Carter, Andrea George, Andrea Price, Andrew Haraghey, Ashley Swain, Caitlin Shaw, Ian Buchta, Jake Ortega, Laine McCullough, Mary Hill, Ryan Chatelian, Tyler Riedesel (Salt Lake County Health Department); Sonja Nti-Berko, Alvin Shultz (Emerging Infections Program); Mimi Puckett (Council of State and Territorial Epidemiologists).
Disclaimer. The conclusions, findings, and opinions expressed by the authors do not necessarily reflect the official position of the US Department of Health and Human Services, the US Public Health Service, the Centers for Disease Control and Prevention, or the authors’ affiliated institutions.
Financial support. This work was supported by the Centers for Disease Control and Prevention through an Emerging Infections Program cooperative agreement (grant number CK17–1701) and through a Council of State and Territorial Epidemiologists (CSTE) cooperative agreement (grant number NU38OT000297–02–00). L. L. reports grants from Michigan Department of Health and Human Services, during the conduct of the study. L. R. reports a CSTE Federal Grant from Michigan Department of Health and Human Services, during the conduct of the study. E. S. and L. M. B. report grants from CSTE, for the population-based Influenza Hospitalization Surveillance Project (IHSP) and COVID-NET activities (funded personnel and equipment for data collection activities) during the conduct of the study.
References
Author notes
M. J. D. and D. U. contributed equally to this work.
Potential conflicts of interest. E. J. A. reports grants from Pfizer, Merck, PaxVax, Micron, Sanofi-Pasteur, Janssen, MedImmune, and GlaxoSmithKline (all for clinical trials); personal fees from Sanofi-Pasteur, Pfizer, Medscape, Kentucky Bioprocessing, Inc, Sanofi-Pasteur, and Janssen (all for consulting); and participation on a personal fees for participating on a Data Safety Monitoring Board for Kentucky Bioprocessing, Inc, and Sanofi-Pasteur outside the submitted work. His institution has also received funding from the National Institute of Health to conduct clinical trials of Moderna and Janssen COVID-19 vaccines, unrelated to this work. W. S. reports personal fees from VBI Vaccines, outside the submitted work. N. B. A. reports an Emerging Infections Program cooperative agreement from the Centers for Disease Control and Prevention (CDC) outside the submitted work. K. T. reports grants from CDC/CSTE related to flu surveillance activities unrelated to this work. A. W. reports multiple grants from CDC/CSTE for flu surveillance (eg, Youth in Agriculture, Enhancing Laboratory Capacity) outside the submitted work. R. L. reports a position as an associate editor of Red Book (American Academy of Pediatrics Report of the Committee on Infectious Diseases). L. M. B. reports receipt of Epidemiology and Laboratory Capacity (ELC) and Immunizations and Vaccines for Children (VFC) grant funding from CDC to support vaccine-preventable disease epidemiology staffing, outside the submitted work. All other authors report no potential conflicts. All authors have submitted the ICMJE Form for Disclosure of Potential Conflicts of Interest. Conflicts that the editors consider relevant to the content of the manuscript have been disclosed.

