


Abstract
Clinical differences between critical illness from influenza infection vs coronavirus disease 2019 (COVID-19) have not been well characterized in pediatric patients.
We compared demographics, clinical characteristics, and outcomes of US children (aged 8 months to 17 years) admitted to the intensive care or high-acuity unit with influenza or COVID-19. Using mixed-effects models, we assessed the odds of death or requiring life support for influenza vs COVID-19 after adjustment for age, sex, race and Hispanic origin, and underlying conditions including obesity.
Children with influenza (n = 179) were younger than those with COVID-19 (n = 381; median, 5.2 years vs 13.8 years), less likely to be non-Hispanic Black (14.5% vs 27.6%) or Hispanic (24.0% vs 36.2%), and less likely to have ≥1 underlying condition (66.4% vs 78.5%) or be obese (21.4% vs 42.2%), and a shorter hospital stay (median, 5 days vs 7 days). They were similarly likely to require invasive mechanical ventilation (both 30.2%), vasopressor support (19.6% and 19.9%), or extracorporeal membrane oxygenation (2.2% and 2.9%). Four children with influenza (2.2%) and 11 children with COVID-19 (2.9%) died. The odds of death or requiring life support in children with influenza vs COVID-19 were similar (adjusted odds ratio, 1.30; 95% confidence interval, .78–2.15; P = .32).
Despite differences in demographics and clinical characteristics of children with influenza or COVID-19, the frequency of life-threatening complications was similar. Our findings highlight the importance of implementing prevention measures to reduce transmission and disease severity of influenza and COVID-19.
Influenza and severe acute respiratory syndrome coronavirus 2 (SARS-CoV-2) are respiratory viruses that can cause severe illness and death. Coronavirus disease 2019 (COVID-19) first emerged in China and was initially detected in the United States in January 2020. Although severe COVID-19 is less common in children than in adults, children are at risk for it [1]; as of 27 April 2022, 1017 US children had died of COVID-19 [2]. Influenza can also cause life-threatening illness, especially in young children [3–5].
Influenza and COVID-19 are vaccine-preventable diseases, with evidence that vaccination effectively prevents critical influenza infection in children [5, 6] and severe COVID-19 in patients aged 12–18 years [6]. The influenza vaccine is approved in and recommended for all children aged ≥6 months. As of April 2022, COVID-19 vaccines were under investigation for children aged 6 months to 4 years, are available under emergency use authorization for children aged 5–15 years, and are approved for those aged ≥16 years; COVID-19 vaccination is recommended for all children aged ≥5 years [7, 8].
Data comparing the clinical characteristics and outcomes of children with influenza and those with COVID-19 are limited [9–13]. Given the overlap in their clinical presentation, being able to communicate to healthcare providers, policy makers, and parents about the risk and prognosis of severe COVID-19 compared with influenza could help inform public health policies around mitigation measures such as vaccines, school closures, and masks. Thus, we compared the clinical characteristics and outcomes of children admitted to pediatric intensive care units with severe influenza to those with COVID-19, analyzing data from 2 nationwide US pediatric cohorts.
METHODS
We used data from the Pediatric Intensive Care Influenza (PICFLU) study (17 US pediatric hospitals in 14 states) and the Overcoming COVID-19 Public Health Surveillance Registry (52 US pediatric hospitals in 25 states), 2 studies funded by the US Centers for Disease Control and Prevention (CDC) that enrolled patients admitted to the intensive care unit or high-acuity unit (hereafter, ICU) with influenza infection or COVID-19, respectively. Sites are shown in Supplementary Figure 1. Both study protocols were approved by the Boston Children’s Hospital Institutional Review Board (IRB), which served as the single IRB for enrolling sites, and by each site IRB. Both studies were reviewed by the CDC and were conducted consistent with applicable federal law and CDC policy. At least 1 parent/guardian consented for enrollment for the PICFLU study. Overcoming COVID-19 was a public health surveillance registry developed to assess severe COVID-19 in children and included a waiver of consent.
PICFLU
Children aged 8 months to 17 years with influenza were enrolled in a multicenter vaccine effectiveness study of critical influenza illness [5]. As previously described [5], active surveillance was conducted from 19 December 2019 to 9 March 2020 for critical acute respiratory illness. We defined critical acute respiratory illness as admission to the ICU with ≥1 sign of systemic illness (temperature ≥38°C or ≤35°C, leukocytosis, elevated C-reactive protein or procalcitonin, or altered mental status) and ≥1 sign of acute respiratory illness (cough, shortness of breath, tachypnea or retractions, invasive or noninvasive mechanical ventilation, need for oxygen to maintain at least 92% saturation, or pulmonary infiltrate or hyperinflation on chest imaging). We excluded children who presented >10 days after illness onset and those receiving chronic ventilator support, awaiting lung transplant, previously enrolled in the study, with no respiratory specimen collection within 72 hours of hospitalization, or who were pregnant.
Overcoming COVID-19
Patients aged <21 years hospitalized with evidence of SARS-CoV-2 detection or multisystem inflammatory syndrome in children (MIS-C) were enrolled in Overcoming COVID-19, a nationwide active surveillance network registry [1, 8, 9]. For this study, we included patients from the Overcoming COVID-19 cohort if they were aged 8 months to 17 years at admission and admitted to an ICU with ≥1 sign of systemic illness (as defined above for PICFLU) from 15 March 2020 to 31 December 2020 with symptomatic SARS-CoV-2 infection confirmed by real-time reverse-transcription polymerase chain reaction prior to, or within 72 hours of, hospitalization. We excluded patients diagnosed with MIS-C as defined by CDC criteria [14], those admitted to the ICU with asymptomatic SARS-CoV-2 infection (eg, detected on admission and/or pre-operative screening), those receiving chronic ventilator support, and those with codetection with influenza.
Data Collection for Both Studies
Details of the data collection for both studies, variables of interest, and viral and bacterial coinfection collection details are included in the Supplementary Material [15–22].
Statistical Analyses
In our descriptive analysis, we used absolute and relative frequencies to characterize categorical variables and medians and interquartile ranges (IQRs) to characterize continuous variables. We used the Pearson χ2 test (categorical variables) or linear regression with robust standard errors (continuous variables) to compare children with influenza to those with COVID-19. We used generalized linear mixed-effects models with a logistic link and study site as a random effect to estimate adjusted odds ratios for predictors of a composite measure of life-threatening illness including death or need for life-supporting interventions (vasopressors, invasive mechanical ventilation, or extracorporeal membrane oxygenation [ECMO]). We also assessed predictors of vasopressor use or invasive mechanical ventilation separately. In all 3 models, we included the following predictors: illness (influenza or COVID-19), age, sex, race and Hispanic origin, presence of any underlying condition, presence of a respiratory condition, presence of a nonrespiratory condition, and obesity. The significance threshold was set at α = 0.05. We performed all analyses using R (version 4.0.2).
RESULTS
Demographics, Clinical Characteristics, and Laboratory Values
We compared 179 children with influenza infection to 381 with COVID-19. Of 2110 patients enrolled in the Overcoming COVID-19 registry, 1729 did not meet our eligibility criteria: 850 were diagnosed with MIS-C, 154 were aged <8 months, 512 were aged ≥18 years, 66 tested negative or were asymptomatic for SARS-CoV-2, 139 were not admitted to the ICU, 7 were receiving chronic ventilator support, and 1 tested positive for influenza and SARS-CoV-2. In addition, we excluded 1 patient from PICFLU who was receiving chronic ventilator support.
Children with COVID-19 were older than those with influenza; almost half of the children with influenza were aged 8–59 months, while 83.7% of those with COVID-19 were aged 5–17 years, and more than half comprised the oldest age group, 13–17 years (Figure 1). The proportion of males was higher in both cohorts (Table 1). Children with influenza were more likely to be non-Hispanic White, while children with COVID-19 were more likely to be non-Hispanic Black or Hispanic (Table 1). The frequencies of children from the Northeast and Midwest were similar within each group, but the proportion of children from the South was higher in the COVID-19 group (Table 1). When restricting to a comparison between patients from the 16 sites who participated in PICFLU and Overcoming COVID-19, differences in age, race, or ethnicity persisted (Supplementary Table 1).
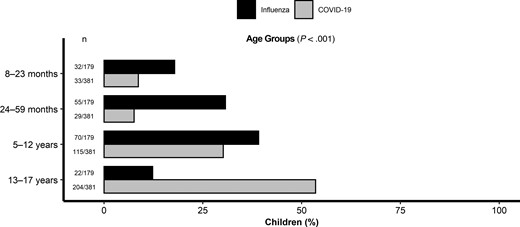
Age distribution of critically ill children with influenza (n = 179) compared with those with COVID-19 (n = 381). Abbreviation: COVID-19, coronavirus disease 2019.
Comparison of Demographics, Clinical Characteristics, and Laboratory Values Within 48 Hours of Admission of Critically Ill Children With Influenza and Those With Coronavirus Disease 2019
| Characteristic | Influenza (n = 179) | Coronavirus Disease 2019 (n = 381) | P Value |
|---|---|---|---|
| Age, median (IQR), years | 5.2 (2.5–9.8) | 13.8 (8.0–16.4) | <.001 |
| Male, n (%) | 112 (62.6) | 214 (56.2) | .15 |
| Race and Hispanic origin, n (%) | |||
| ȃNon-Hispanic White | 101 (56.4) | 94 (24.7) | <.001 |
| ȃNon-Hispanic Black | 26 (14.5) | 105 (27.6) | |
| ȃNon-Hispanic other | 9 (5.0) | 22 (5.8) | |
| ȃHispanic | 43 (24.0) | 138 (36.2) | |
| ȃUnknown | 0 (0) | 23 (6.0) | |
| Site region, n (%) | |||
| ȃNortheast | 60 (33.5) | 95 (24.9) | <.001 |
| ȃMidwest | 64 (35.8) | 87 (22.8) | |
| ȃSouth | 29 (16.2) | 139 (36.5) | |
| ȃWest | 26 (14.5) | 60 (15.7) | |
| Underlying condition, n (%) | |||
| ȃAt least 1 underlying condition | 119 (66.4) | 299 (78.5) | .002 |
| ȃRespiratory (including asthma) | 71 (39.7) | 143 (37.5) | .63 |
| ȃAsthma | 40 (22.4) | 85 (22.3) | .99 |
| ȃCardiovascular | 13 (7.3) | 47 (12.3) | .07 |
| ȃNeurological/neuromuscular | 59 (33.0) | 92 (24.1) | .028 |
| ȃOncologic/immunosuppressive | 3 (1.7) | 47 (12.3) | <.001 |
| ȃRenal/urologic | 7 (3.9) | 34 (8.9) | .034 |
| ȃGastrointestinal/hepatic | 27 (15.1) | 81 (21.3) | .084 |
| ȃEndocrine/metabolic (excluding obesity) | 37 (20.7) | 104 (27.3) | .092 |
| ȃBody mass index–based obesity, a n (%) | 27/126 (21.4) | 147/348 (42.2) | <.001 |
| ȃPulmonary infiltrates on chest radiography within first 24 hours, n (%) | 88 (49.2) | 189 (49.6) | .92 |
| ȃBilateral infiltrates, n (%) | 57/88 (64.8) | 143/189 (75.7) | .06 |
| Laboratory results at admission, median (IQR) | |||
| ȃC-reactive protein, mg/dL | 3.9 (1.3–9.7)b | 6.1 (1.8–15.0)c | .18 |
| ȃWhite blood cell count, ×103/mL | 8.9 (5.7–13.8)d | 8.7 (5.4–12.1)e | .40 |
| ȃAbsolute neutrophil count, ×103/mL | 7.3 (3.7–10.8)f | 5.4 (3.1–8.8)g | .032 |
| ȃAbsolute lymphocyte count, ×103/mL | 0.8 (0.5–1.8)h | 1.2 (0.7–2.2)i | .003 |
| ȃNeutrophil-to-lymphocyte ratio | 6.7 (2.5–14.4)j | 3.9 (2.2–8.2)k | <.001 |
| ȃPlatelet count, ×103/mL | 217 (163–298)l | 196 (139–274)m | .014 |
Bold values represent p-values that meet our significance threshold as described in the methods comparing differences between the COVID-19 and influenza groups.
Abbreviation: IQR, interquartile range.
Body mass index was not calculated for 53 influenza and 33 coronavirus disease 2019 patients because the patients were aged <2 years or missing a height or weight measurement.
n = 70.
n = 228.
n = 125.
n = 111.
n = 105.
n = 335.
n = 119.
n = 325.
n = 105.
n = 340.
n = 113.
n = 335.
Most children with influenza or COVID-19 had ≥1 underlying medical condition (119, 66.4% vs 299, 78.5%; P = .002). Underlying respiratory conditions were the most common condition in both groups, with similar frequencies (Table 1). One-third of children with influenza had a neurologic/neuromuscular condition compared with nearly one-fourth of children with COVID-19 (P = .03). Obesity was more frequent in children aged ≥2 years with COVID-19 compared with those with influenza (42.2% vs 21.4%, respectively; P < .001). Almost half of the children in each group had pulmonary infiltrates on chest radiography within the first 24 hours of admission (Table 1). When comparing laboratory values at admission, children with influenza had a significantly higher neutrophil to lymphocyte ratio and platelet count than those with COVID-19 (Table 1).
Antiviral Use and Strain Types
The frequency of antiviral use was higher in children with influenza; 169 of 179 (94.4%) influenza patients received antivirals (oseltamivir, n = 168; peramivir, n = 14; baloxivir, n = 1), whereas only 153 of 381 (40.2%) COVID-19 patients received an antiviral (remdesivir). Of the 179 influenza cases, 106 were influenza A (89, H1N1; 2, H3N2; and 15, unspecified A), 70 were B, and 3 were coinfections with influenza A and B. All COVID-19 cases occurred in the pre-Delta and pre-Omicron eras.
Clinical Presentation, Severity, and Outcomes
Fever was the most common symptom in children with influenza and COVID-19 (92.7% and 69.6%, respectively), followed by cough (91.6% and 55.4%, respectively; Figure 2). Compared with children with influenza, those with COVID-19 were less likely to present with fever, cough, fatigue or decreased activity, shortness of breath, congestion or runny nose, vomiting, headache, body ache or myalgia, sore throat, and confusion or altered mental status. The frequencies of diarrhea and seizures did not significantly differ between groups (Figure 2). The organ involvement is compared in Figure 3, with 310 of 381 (81.4%) in the COVID-19 cohort having respiratory involvement compared with 100% in PICFLU. However, the number of organ systems involved was similar between the influenza and COVID-19 groups, each with a median (IQR) 3 (2, 3) organ systems involved during hospitalization.

Symptoms at presentation of critically ill children with influenza (n = 179) compared with those with COVID-19 (n = 381). Abbreviation: COVID-19, coronavirus disease 2019.

Comparison of multiorgan involvement in children with severe influenza (A) and children with coronavirus disease 2019 (B).
While we did not identify statistically significant differences in pediatric sequential organ failure assessment score and the proportion meeting the pediatric acute respiratory distress syndrome criteria between groups, the pediatric logistic organ dysfunction-2 score was significantly higher in children with influenza (score based on characteristics within 48 hours of admission, P = .03; Table 2). Noninvasive mechanical ventilation was more frequently used in children with influenza compared with those with COVID-19 (75, 41.9% vs 93, 24.4%; P < .001). In contrast, children in the 2 groups had similar rates of vasopressor use, invasive mechanical ventilation, and ECMO (Table 2).
Severity Scores and Outcomes of Critically Ill Children With Influenza Compared With Those With Coronavirus Disease 2019
| Characteristic | Influenza (n = 179) | Coronavirus Disease 2019 (n = 381) | P Value |
|---|---|---|---|
| Outcome | |||
| ȃNoninvasive mechanical ventilation,an (%) | 75 (41.9) | 93 (24.4) | <.001 |
| ȃInvasive mechanical ventilation,bn (%) | 54 (30.2) | 115 (30.2) | 1.00 |
| ȃMedian days (IQR) | 4 (2–10) | 5 (2–10) | .65 |
| ȃVasopressor-dependent shock,c n (%) | 35 (19.6) | 76 (19.9) | .91 |
| ȃ Extracorporeal membrane oxygenation, n (%) | 4 (2.2) | 11 (2.9) | .66 |
| ȃ Intensive care unit LOS,d median (IQR), days | 2 (2–5) | 4 (2–8) | .014 |
| ȃHospital LOS,d median (IQR), days | 5 (3–10) | 7 (3–14) | .004 |
| ȃIn-hospital death, n (%) | 4 (2.2) | 11 (2.9) | .66 |
| Severity score | |||
| ȃPediatric sequential organ failure assessment,e median (IQR) | 3 (1–6) | 3 (0–5) | .095 |
| ȃPediatric logistic organ dysfunction-2,e median (IQR) | 2 (0–4) | 1 (0–3) | .03 |
| ȃPediatric acute respiratory distress syndrome criteria met, n (%) | 33 (18.4) | 79 (20.7) | .53 |
Abbreviations: IQR, interquartile range; LOS, length of stay.
Noninvasive ventilation includes bilevel positive airway pressure or continuous positive airway pressure >5 during intensive care unit (ICU) or high-acuity unit stay and for daily ventilation checks at days 1, 2, 3, 4, 5, 6, 7, 14, 21, and 28.
Invasive ventilation includes endotracheal tube or tracheostomy use during ICU or high-acuity unit stay and for daily ventilation checks at days 1, 2, 3, 4, 5, 6, 7, 14, 21, and 28.
Vasopressor-dependent shock was defined as vasopressor use during ICU or high-acuity unit stay and for pediatric logistic organ dysfunction at days 1, 2, 3, 4, 5, 6, 7, 14, 21, and 28.
Children with influenza (n = 4) or coronavirus disease 2019 (n = 11) who died during hospitalization were not included.
Based on clinical laboratory values within 48 hours of admission.
Children with influenza had a shorter hospital and ICU stay (median [IQR], 5 days [3–10 days] and 2 days [2–5 days], respectively) than those with COVID-19 (7 days [3–14 days] and 4 days [2–8 days], respectively). However, for children aged 8–23 months and 5–12 years, no differences were noted between the 2 groups in lengths of hospital and ICU stay (Figure 4). Overall, 4 children (2.2%) with influenza and 11 children (2.9%) with COVID-19 died during hospitalization.
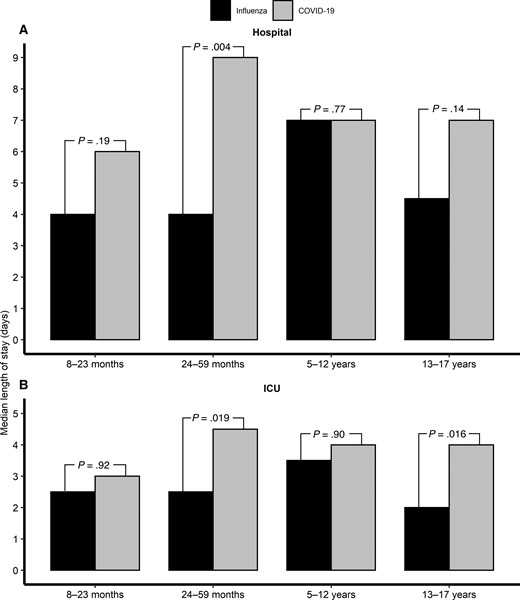
Median length of hospital stay (A) and ICU stay (B) by age group of critically ill children with influenza (n = 179) compared with those with COVID-19 (n = 381). Abbreviations: COVID-19, coronavirus disease 2019; ICU, intensive care unit.
Viral Codetections and Bacterial Coinfections
A total of 175 children with influenza (97.8%) underwent additional viral testing, and another virus was detected in 30 (17.1%), with rhinovirus and respiratory syncytial virus being the most common (Table 3). Of the 170 children with COVID-19 (44.6%) who underwent additional viral testing, another virus was detected in 19 (11.2%), with rhinovirus being the most common. Adjudicated community-onset bacterial coinfections were diagnosed in 15.6% and 9.2% of children with influenza and COVID-19, respectively.
Viral Codetections and Bacterial Coinfections in Critically Ill Children With Influenza or Coronavirus Disease 2019
| Group | Influenza (n = 179) | Coronavirus Disease 2019 (n = 381) |
|---|---|---|
| Any viral codetection, n (%) | 30/175 (17.1) | 19/170 (11.2) |
| ȃRhinovirus/enterovirus | 11/175 (6.3)a | 14/160 (8.8) |
| ȃRespiratory syncytial virus | 11/175 (6.3) | 0/161 (0.0) |
| ȃAdenovirus | 2/175 (1.1) | 7/162 (4.3) |
| ȃNon–severe acute respiratory syndrome coronavirus 2 coronavirus | 2/175 (1.1) | 1/112 (0.9) |
| ȃMetapneumovirus | 3/175 (1.7) | 1/160 (0.6) |
| ȃParainfluenza | 3/175 (1.7) | 1/159 (0.6) |
| Positive bacterial specimens (≤72 hours), n (%) | 28 (15.6) | 35 (9.2) |
| ȃRespiratory (tracheal or sputum) | 18 (10.1) | 13 (3.4) |
| ȃBlood | 13 (7.3) | 11 (2.9) |
| ȃUrine | 1 (0.6) | 8 (2.1) |
| ȃOtherb | 1 (0.6) | 5 (1.3) |
Single-plex for rhinovirus only.
Other positive bacterial specimens include group A Streptococcus pharyngeal swab (n = 0 in influenza, n = 2 [0.5%] in coronavirus disease 2019 [COVID-19]), Clostridioides difficile polymerase chain reaction from stool sample (n = 0 in influenza, n = 1 [0.3%] in COVID-19), Chlamydia trachomatis nucleic acid amplification test from urine sample (n = 0 in influenza, n = 1 [0.3%] in COVID-19), peritoneal fluid post appendix rupture (n = 0 in influenza, n = 1 [0.1%] in COVID-19), sample from retropharyngeal abscess (n = 1 [0.6%] in influenza, n = 0 in COVID-19).
Multivariable Analysis of Outcomes
Our multivariable models did not identify statistically significant differences in the adjusted odds of invasive mechanical ventilation, vasopressor use, or a composite outcome of life-threatening illness between children with influenza and those with COVID-19 (Table 4). However, across both conditions, younger age and other underlying medical conditions were associated with higher odds of invasive mechanical ventilation, whereas the odds of invasive mechanical ventilation were lower in Hispanic children compared with non-Hispanic White children. Further, the presence of ≥1 underlying condition was a significant predictor of vasopressor use.
Mixed-Effects Models of Vasopressor Use, Invasive Mechanical Ventilation, and Severe Illness in Critically Ill Children With Influenza or Coronavirus Disease 2019
| Characteristic | Vasopressor Use | Invasive Mechanical Ventilation | Life-Threatening Illnessa |
|---|---|---|---|
| Adjusted Odds Ratio (95% Confidence Interval), P Value | |||
| Illness | |||
| ȃInfluenza | Reference | Reference | Reference |
| ȃCoronavirus disease 2019 | 0.90 (.50–1.62), P = .72 | 1.19 (.70–2.03), P = .51 | 1.30 (.78–2.15), P = .32 |
| Age in years | 1.02 (.98–1.07), P = .37 | 0.96 (.92–.99), P = .04 | 0.97 (.94–1.01), P = .12 |
| Sex | |||
| ȃMale | Reference | Reference | Reference |
| ȃFemale | 1.05 (.67–1.63), P = .84 | 0.93 (.63–1.38), P = .72 | 0.91 (.62–1.32), P = .61 |
| Race and Hispanic origin | |||
| ȃNon-Hispanic White | Reference | Reference | Reference |
| ȃNon-Hispanic Black | 0.84 (.45–1.56), P = .57 | 0.79 (.46–1.35), P = .40 | 0.84 (.50–1.40), P = .50 |
| ȃNon-Hispanic other | 0.51 (.16–1.62), P = .26 | 0.53 (.20–1.38), P = .19 | 0.62 (.26–1.50), P = .29 |
| ȃHispanic | 0.88 (.50–1.56), P = .67 | 0.52 (.31–.87), P = .014 | 0.72 (.44–1.18), P = .19 |
| ȃUnknown | 2.76 (.97–7.87), P = .057 | 0.81 (.28–2.33), P = .69 | 1.17 (.44–3.16), P = .75 |
| Underlying condition | |||
| ȃAt least 1 underlying condition | 2.05 (1.01–4.17), P = .047 | 1.09 (.56–2.12), P = .80 | 1.42 (.77–2.63), P = .26 |
| ȃRespiratory (including asthma) | 0.76 (.46–1.24), P = .27 | 1.29 (.83–2.01), P = .25 | 1.17 (.77–1.78), P = .48 |
| ȃOther underlying conditionb | 0.85 (.50–1.45), P = .54 | 1.82 (1.10–3.02), P = .02 | 1.25 (.78–1.99), P = .35 |
| Body mass index–based obesityc | 0.91 (.54–1.52), P = .72 | 1.11 (.70–1.76), P = .66 | 0.95 (.61–1.46), P = .80 |
Bold values represent findings that meet our significance threshold as defined by the methods.
Life-threatening illness is defined as vasopressor-dependent shock, invasive mechanical ventilation, extracorporeal membrane oxygenation, or in-hospital death.
Includes cardiovascular, neurological/neuromuscular, oncologic, immunosuppressive, renal, urologic, gastrointestinal, hepatic, endocrine, and metabolic conditions.
Children aged <2 years were considered not obese.
DISCUSSION
In this multicenter comparison of US children admitted to the ICU with influenza or COVID-19, the prevalence of life-threatening illness was similar between the 2 cohorts after adjusting for significant differences in demographics and clinical characteristics. Mortality was uncommon, but approximately one-third of these critically ill children were intubated for respiratory failure and approximately one-fifth required vasopressors in both cohorts. The frequency of viral codetection and bacterial coinfection in both cohorts was low. This study highlights that both influenza and COVID-19 are associated with critical illness in children and that prevention strategies are essential.
Early in the pandemic, Song et al reported similar frequencies of hospitalization, ICU admission, and mechanical ventilation between influenza and COVID-19 in US children; however, their study included 1 center and only a minority of children with influenza or COVID-19 were hospitalized (21% and 17%, respectively) [13]. A second single-center study also reported no differences in invasive mechanical ventilation or death [11] but had limited numbers of severe cases. Our findings differ from a study in critically ill adults hospitalized with influenza or COVID-19 across 2 academic centers that reported COVID-19 to be associated with worse respiratory outcomes [23]. Another study of hospitalized adults [24] reported patients with COVID-19 to have fewer underlying conditions, increased need for ICU care and mechanical ventilation, and much higher mortality than those with influenza infection. Similar to that adult study, we showed that adolescents (aged 13–17 years) and preschoolers (aged 24–59 months) had longer hospital and ICU stays with COVID-19 than with influenza. Our finding that children with COVID-19 were older compared with those with influenza is also consistent with 3 other studies from the United States, United Kingdom, and Mexico City [10, 11, 13].
The age difference in children with severe influenza vs COVID-19 might be related to several factors, such as differences in preexisting humoral and innate immunity, viral factors, and transmission risks. It is important to note that influenza has been an endemic disease with yearly epidemics and that a high proportion of children have been vaccinated or likely previously infected. An ideal comparison of virus pathogenicity would compare unvaccinated cohorts and those with similar history of prior infections. However, we did not have a sufficient sample size of unvaccinated influenza cases or cases with a history of prior infections in either group to restrict analysis to these subgroups. However, we suspect such analysis might show less frequent progression to critical illness with COVID-19 vs influenza, in contrast with our study findings. With SARS-CoV-2 vaccination of older children, there has been a shift toward higher hospitalization rates among young children with the Omicron variant [25], which we did not assess as our cohort was limited to 2020. Furthermore, even though the children with COVID-19 were older, we did note that children aged 24–59 months with COVID-19 had longer hospital and ICU lengths of stay compared with children with influenza. Therefore, further studies are warranted to document if these differences continue.
We noted that a higher frequency of children with COVID-19 were Hispanic or non-Hispanic Black compared with children with influenza, which has been reported. Specifically, Hispanic and non-Hispanic Black children had higher cumulative rates of COVID-19–associated hospitalizations [26]. Although our findings could be influenced by higher numbers of hospitals from the US South in the COVID-19 cohort, they are similar to findings from a nationwide study of children admitted to ICUs in the United Kingdom that found that children with COVID-19 were more often Black or Asian compared with children with influenza [10]. We also documented that the frequency of obesity in children aged >2 years was higher in the COVID-19 group, which is consistent with the study from the United Kingdom and a retrospective French study comparing COVID-19 and influenza [10, 12]. In the 2009 H1N1 influenza pandemic, obesity was recognized as a risk factor for severe influenza [27], and it continues to be a risk factor for severe COVID-19 [28]. Our study reinforces the importance of collecting comprehensive demographic data to help delineate the relative impact of environmental exposures and social factors that underlie disease risk.
Fever was the most common symptom in both groups, but children with influenza were more likely to present with fever than those with COVID-19. The higher frequency of fever in children with influenza has also been reported when compared with other common respiratory viruses [29]. The second most common symptom in both groups was cough but, once again, this symptom was more frequent in children with influenza. In a study of hospitalized adults comparing influenza and COVID-19, Zhang et al also reported that fever and cough were the 2 most common symptoms for both viruses [30]. Also, a study of hospitalized children in Mexico City noted that fever and cough were the most common clinical manifestations, but cough was more than twice as common in children with influenza (76% vs 30%) [11]. Differentiating COVID-19 and influenza by symptoms is therefore difficult, and testing is needed to accurately diagnose the causative pathogen in children with acute respiratory illness when both viruses cocirculate.
Our comparative evaluation had notable strengths and limitations. Both the influenza and COVID-19 cohorts were multicenter, geographically diverse, and limited to children admitted to the ICU, allowing comparison of acute severe respiratory illnesses. The sites overlapped (94% of PICFLU sites were in Overcoming COVID-19), but the COVID-19 cohort had more sites and had waiver of consent, while not all eligible influenza-positive patients consented to PICFLU participation. Furthermore, the inclusion criteria between the studies were different. Both studies required admission to the ICU with ≥1 sign of systemic illness defined in the same way; however, the PICFLU cohort inclusion required respiratory involvement. The influenza cohort was enrolled over 1 season and the COVID-19 cohort was enrolled during the pre-Delta and pre-Omicron eras. Future studies to determine if severity differences between these newer variants and other influenza seasons exist in children should be conducted. Infants aged <8 months, who are at higher risk of severe COVID-19, were excluded in this analysis because the PICFLU cohort was restricted to children aged ≥8 months because this is the earliest age at which children could have been fully vaccinated [5]. Some of the differences in severity may also be explained by the fact that all children with COVID-19 had not received SARS-CoV-2 vaccination because enrollment preceded vaccine authorization. In contrast, some children with influenza were either fully (69 of 179, 39.0%) or partially (17 of 179, 9.5%) vaccinated, which likely attenuated influenza severity [5]. Therefore, the similarities in the severity and outcomes of children with influenza or COVID-19 should be interpreted with caution until future studies include a cohort of COVID-19–vaccinated children. The study designs were different. The COVID-19 data were obtained solely via chart review rather than parent/guardian interviews. Consequently, signs and symptoms for COVID-19 may be underreported. Moreover, viral testing for children with COVID-19 and bacterial cultures for both groups were ordered at the discretion of the providers, and coinfection may be underappreciated. In addition, the COVID-19 cases were pre-Delta and pre-Omicron variant circulation, and we did not compare severity by influenza strains.
In conclusion, despite notable differences in the demographic and clinical characteristics of unvaccinated children with COVID-19 in the pre-Delta and pre-Omicron variant eras compared with children with influenza admitted to the ICU, both viruses were associated with critical illness and the need for life-saving measures. Prevention measures for both influenza and COVID-19, such as vaccination and nonpharmaceutical interventions, are essential to reduce transmission and severe outcomes in children.
Supplementary Data
Supplementary materials are available at Clinical Infectious Diseases online. Consisting of data provided by the authors to benefit the reader, the posted materials are not copyedited and are the sole responsibility of the authors, so questions or comments should be addressed to the corresponding author.
Notes
Overcoming COVID-19 Investigators (listed in PubMed, and ordered by US state)
The study group members listed here were closely involved with the design, implementation, and oversight of the Overcoming COVID-19 study. Alabama: Children’s of Alabama, Birmingham: Michele Kong. Arizona: University of Arizona, Tucson: Mary Glas Gaspers, Katri V. Typpo. Arkansas: Arkansas Children’s Hospital, Little Rock: Ronald C. Sanders Jr., Katherine Irby, Peter Mourani. California: Children’s Hospital of Orange County, Orange County: Adam J. Schwarz. California: Miller Children’s & Women’s Hospital Long Beach, Long Beach: Christopher J. Babbitt. California: Rady Children’s Hospital, San Diego: Helen Harvey. California: University of California–San Francisco Benioff Children’s Hospital Oakland, Oakland: Natalie Z. Cvijanovich. California: University of California–San Francisco Benioff Children’s Hospital, San Francisco: Matt S. Zinter. Colorado: Children’s Hospital Colorado, Aurora: Aline B. Maddux, Christina M. Osborne, Sara Shankman, Peter M. Mourani, Emily Port, Kevin A. Van. Connecticut: Connecticut Children’s, Hartford: Christopher L. Carroll. Connecticut: Yale New-Haven Children’s Hospital, New Haven: John S. Giuliano, Jr. Florida: Holtz Children’s Hospital, Miami: Gwenn E. McLaughlin. Georgia: Children's Healthcare of Atlanta at Egleston, Atlanta: Keiko M. Tarquinio. Illinois: Ann & Robert H. Lurie Children’s Hospital of Chicago, Chicago: Kelly N. Michelson, Bria M. Coates. Indiana: Riley Hospital for Children, Indianapolis: Courtney M. Rowan. Iowa: University of Iowa Stead Family Children’s Hospital, Iowa City: Kari Wellnitz, Guru Bhoojhawon. Kentucky: University of Louisville and Norton Children’s Hospital, Louisville: Janice E. Sullivan, Vicki L. Montgomery, Kevin M. Havlin. Louisiana: Children's Hospital of New Orleans, New Orleans: Tamara T. Bradford. Maryland: Johns Hopkins Children’s Hospital, Baltimore: Becky J. Riggs, Melania M. Bembea. Massachusetts: Boston Children’s Hospital, Boston: Adrienne G. Randolph, Margaret M. Newhams, Sabrina R. Chen, Cameron C. Young, Suden Kucukak, Kristin L. Moffitt, Mari M. Nakamura. Massachusetts: MassGeneral Hospital for Children, Boston: Ryan W. Carroll, Phoebe H. Yager, Neil D. Fernandes. Michigan: University of Michigan CS Mott Children’s Hospital, Ann Arbor: Heidi R. Flori. Michigan: Children’s Hospital of Michigan, Detroit: Sabrina M. Heidemann. Minnesota: University of Minnesota Masonic Children’s Hospital, Minneapolis: Janet R. Hume. Minnesota: Mayo Clinic, Rochester: Emily R. Levy. Mississippi: Children’s Hospital of Mississippi, Jackson: Charlotte V. Hobbs, Lora Martin, Lacy Malloch, Kengo Inagaki, Anita Dhanrajani. Missouri: Children’s Mercy Hospital, Kansas City: Jennifer E. Schuster, Abigail Kietzman, Shannon Hill. Missouri: Washington University in St. Louis, St. Louis: Philip C. Spinella. Nebraska: Children’s Hospital & Medical Center, Omaha: Melissa L. Cullimore, Russell J. McCulloh. New Jersey: Hackensack University Medical Center, Hackensack: Katharine N. Clouser. New Jersey: Cooperman Barnabas Medical Center, Livingston: Shira J. Gertz. New Jersey: Bristol-Myers Squibb Children's Hospital, New Brunswick: Lawrence C. Kleinman, Simon Li, Steven M. Horwitz. New York: Hassenfeld Children’s Hospital at New York University Langone, New York: Adam J. Ratner, Heda Dapul, Vijaya L. Soma. New York: Kings County Hospital, Brooklyn: Michael A. Keenaghan. New York: Maria Fareri Children's Hospital, Valhalla: Aalok R. Singh. New York: Stony Brook University Hospital, Stony Brook: Ilana Harwayne-Gidansky, Saul R. Hymes. New York: State University of New York Downstate Medical Center University Hospital, Brooklyn: Sule Doymaz. North Carolina: University of North Carolina at Chapel Hill, Chapel Hill: Stephanie P. Schwartz, Tracie C. Walker. Ohio: Nationwide Children’s Hospital, Columbus: Mark W. Hall. Ohio: University Hospitals Rainbow Babies and Children's Hospital, Cleveland: Steven L. Shein, Amanda N. Lansell. Ohio: Akron Children’s Hospital, Akron: Ryan A. Nofziger. Ohio: Cincinnati Children’s Hospital, Cincinnati: Mary A. Staat. Pennsylvania: Children’s Hospital of Philadelphia, Philadelphia: Julie C. Fitzgerald, Scott Weiss. Pennsylvania: Penn State Children’s Hospital, Hershey: Neal J. Thomas. Pennsylvania: University of Pittsburgh Medical Center Children’s Hospital of Pittsburgh: Ericka L. Fink, Joseph A. Carcillo. South Carolina: Medical University of South Carolina Children’s Health, Charleston: Elizabeth H. Mack, Laura S. Smallcomb. Tennessee: Monroe Carell Jr. Children’s Hospital at Vanderbilt, Nashville: Natasha B. Halasa, Laura Stewart, Meena Golchha, Yesenia Romero, Haya Hayek. Texas: Texas Children’s Hospital, Houston: Laura L. Loftis. Texas: University of Texas Health Science Center, Houston: Alvaro Coronado Munoz. Texas: University of Texas Southwestern, Children’s Medical Center Dallas, Dallas: Cindy Bowens, Mia Maamari. Utah: Primary Children’s Hospital, Salt Lake City: Hillary Crandall. Washington: Seattle Children’s Hospital, Seattle: Lincoln S. Smith, John K. McGuire. CDC COVID-19 Response Team on Overcoming COVID-19: Manish M. Patel, Leora R. Feldstein, Mark W. Tenforde, Ashley M. Jackson.
Disclaimer. The findings and conclusions presented here are those of the authors and do not necessarily represent the official position of the US Centers for Disease Control and Prevention (CDC).
Financial support. This study was funded by the CDC under a contract to Boston Children’s Hospital (75D30120C07725-01).
References
Author notes
M. M. P. and A. G. R. contributed equally to this work.
A complete list of members and affiliations is provided in the Acknowledgments section.
Potential conflicts of interest. N. B. H. reports grants or contracts from Sanofi and Quidell outside of the submitted work and an educational grant for honorarium from Genentech. M. M. B. reports grants or contracts from the National Institutes of Health (NIH)/National Institute of Neurological Disorders and Stroke, Grifols Investigator Sponsored Research Grant, and NIH/ Eunice Kennedy Shriver National Institute of Child Health and Human Development (NICHD) outside of the submitted work and paid to institution. B. M. C. reports grants or contracts from the NIH, American Thoracic Society, and American Lung Association outside the submitted work and paid to institution and payment to author for expert testimony from Triplett Woolf Garretson, LLC. N. Z. C. reports grants or contracts from the NIH outside of the submitted work. H. R. F. reports grants or contracts from the NIH, National Heart, Lung, and Blood Institute (NHLBI), and NICHD outside of the submitted work; support for attending meetings and/or travel from the Society of Critical Care Medicine; participation on a data and safety monitoring board (DSMB) for a cardiothoracic surgery trial (single center) and a DSMB for an intrathecal chemotherapy trial; an unpaid position on the Michigan Thoracic Society Executive Committed and Pediatric Acute Lung Injury and Sepsis Investigators network Executive Committee; and the following other financial or nonfinancial interests: Lucira Health advisory committee and Aerogen Pharma advisory unfunded. M. W. H. reports grants or contracts from the NIH and royalties from Kiadis outside of the submitted work; participation on a DSMB or advisory board for AbbVie and La Jolla Pharmaceuticals (payment to author); and leadership or fiduciary role on the American Board of Pediatrics (payment to author). J. R. H. reports grants or contracts from the NIH–NICHD outside of the submitted work and participation on a DSMB for an institutional study at the University of Minnesota (no financial reimbursements). M. K. reports grants or contracts from the NIH outside of the submitted work to institution. E. R. L. reports grants or contracts from the NIH outside of the submitted work and paid to institution. M. M. Nakamura reports grants or contracts from Gilead for participation in their remdesivir trial. R. A. N. reports grants or contracts from the NIH outside of the submitted work. C. M. R. reports grants or contracts from the NIH outside of the submitted work and payment for honoraria to author for the Contemporary Critical Care Complications of SCT/Cellular Therapies Conference by MD Anderson. J. E. S. reports grants or contracts from Merck outside of the submitted work and paid to institution. M. S. Z. reports grants or contracts from the NIH outside of the submitted work and paid to institution. A. G. R. reports grants or contracts from the National Institute of Allergy and Infectious Diseases to institution outside of the submitted work; royalties or licenses from UpToDate as a Pediatric Critical Care Section Editor paid to author; and is an unpaid treasurer for International Sepsis Forum. M. L. C. reports grants or contracts to institution for projects unrelated to this work from the CDC. J.C.F. reports an NIH award unrelated to this study and paid to institution. C. V. H. reports payment or honoraria as a consultant for Biofire (bioMérieux). G. E. M. reports payment for expert testimony in a malpractice case involving influenza related death. All remaining authors: No reported conflicts of interest. All authors have submitted the ICMJE Form for Disclosure of Potential Conflicts of Interest. Conflicts that the editors consider relevant to the content of the manuscript have been disclosed.

