


Abstract
Nontuberculous mycobacteria are environmental organisms that cause infections leading to chronic, debilitating pulmonary disease, among which Mycobacterium avium complex (MAC) is the most common species.
We described patterns of macrolide-based multidrug antibiotic therapies for MAC pulmonary disease (MAC-PD) in US Medicare beneficiaries with bronchiectasis between January 2006 and December 2014. MAC therapy was defined as a multidrug regimen containing a macrolide plus ≥1 other drug targeting MAC-PD (rifamycin, ethambutol, fluoroquinolone, or amikacin) prescribed concomitantly for >28 days.
We identified 9189 new MAC therapy users, with a mean age (standard deviation) of 74 (6 years) at the start of therapy; 75% female and 87% non-Hispanic white. A guideline-based regimen (a macrolide, ethambutol, and rifamycin, with or without amikacin) was prescribed for 51% of new MAC therapy users at treatment start, of whom 41% were continuing guideline-based therapy at 6 months, and only 18% at 12 months. Of all new MAC therapy users, by 18 months only 11% were still receiving MAC treatment, 55% had discontinued therapy, and 34% were censored owing to death or the end of the study period.
Overall, nearly half of new MAC therapy users were prescribed a non–guideline-recommended macrolide-based therapy, including regimens commonly associated with promoting macrolide resistance. Treatment discontinuation was common, and once discontinued, only a few beneficiaries resumed therapy at a later time. Our study adds important data to the current literature on treatment patterns for MAC-PD among older US populations. Future research should examine treatment patterns using more contemporary data sources.
Nontuberculous mycobacteria (NTM) are ubiquitous environmental organisms that can cause chronic, debilitating pulmonary disease primarily in older individuals [1, 2], of which Mycobacterium avium complex (MAC) is the most frequently encountered pathogens [2–4]. MAC pulmonary disease (MAC-PD) commonly occurs in the setting of chronic underlying lung disease, such as chronic obstructive pulmonary disease and bronchiectasis [5, 6]. Though not communicable, MAC infection may cause extensive destruction and progressive inflammatory damage of lung tissues as well as airway dilation.
MAC-PD often requires aggressive, long-term, multidrug antibiotic therapy, and can be extremely difficult to manage. The standard guideline-based therapy (GBT) targeted for MAC-PD is an 18–24-month period of treatment with ≥3 antibiotics, including a macrolide, rifamycin, and ethambutol [2, 7]. For advanced disease or for patients in whom the GBT fails, a parenteral agent, most commonly amikacin, is often added. In either case, guidelines recommend >12 months of therapy after conversion to culture negative.
Several non-US studies have reported poor adherence to guidelines [8, 9]. US population-based data on MAC therapy are scarce [2, 10], and the use of evidence-based therapy is limited. The proportion of US patients who initiate and continue GBT for >12 months is unknown [11]. Longitudinal, population-based data on treatment practices are needed in light of recent guidelines. Therefore, we described patterns of macrolide-based multidrug antibiotic therapy prescribed to first-time MAC therapy users among US Medicare beneficiaries with bronchiectasis between January 2009 and December 2014.
METHODS
We used US Medicare data from the Centers for Medicare and Medicaid Services (parts A and B plus D, but not part C) between 1 January 2006 and 31 December 2014. We leveraged an existing study population from our prior work [12, 13], of Medicare beneficiaries aged ≥65 years with bronchiectasis, identified by codes 494.0 or 494.1 (bronchiectasis with or without acute exacerbation) from the International Classification of Diseases, Ninth Revision, Clinical Modification (ICD-9-CM). We excluded those with a diagnosis of cystic fibrosis, human immunodeficiency virus (HIV) infection, or a history of organ transplantation during the baseline period, because patients with these conditions typically represent a different spectrum of MAC-PD than those without (Figure 1). The baseline period was the time between data start (1 January 2006) or beneficiaries’ Medicare enrollment and their MAC therapy start date.
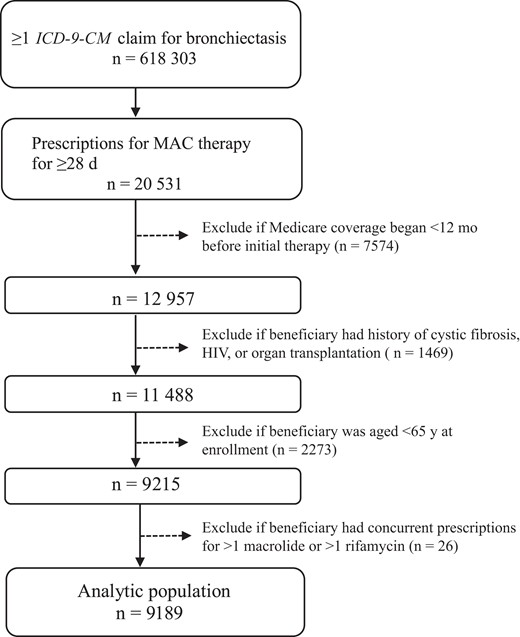
Flow diagram for the analytic population: 9189 Medicare beneficiaries prescribed macrolide-based multidrug therapy for the initial treatment of presumptive pulmonary Mycobacterium avium complex (MAC) between January 2006 and December 2014.The claims were based on diagnosis codes for bronchiectasis from the International Classification of Diseases, Ninth Revision, Clinical Modification (ICD-9-CM) (code 494.0 or 494.1: bronchiectasis with or without acute exacerbation). Prescriptions for MAC therapy included a macrolide plus ≥1 other antibiotic drug targeted for MAC infection: rifamycin (rifampin or rifabutin), ethambutol, fluoroquinolone, and amikacin. Cystic fibrosis was defined as ICD-9-CM codes 277.00–277.09, human immunodeficiency virus (HIV) infection as ICD-9-CM code 042, and history of organ transplantation as ICD-9-CM code V42.0, V42.1, V42.6, V42.7, or V42.8.
We identified a cohort of first-time MAC therapy users. We defined a MAC treatment regimen as a prescription of an ≥28-day supply of an antibiotic drug regimen containing a macrolide (azithromycin or clarithromycin) plus an overlapping ≥28 day-supply of ≥1 of the following: rifamycin (rifampin or rifabutin), ethambutol, fluoroquinolone (ciprofloxacin, levofloxacin, or moxifloxacin), or intravenous/inhaled amikacin. This regimen is highly specific to MAC-PD, as this combination is not used for any other infections other than few much rarer NTM species. MAC therapy users were individuals who received a MAC treatment regimen during the study period; we did not use a diagnosis code–based definition because of poor sensitivity shown in previous studies [14, 15]. We required ≥12 months of observation in Medicare without evidence of MAC therapy for eligibility to enter our cohort of first-time MAC therapy users. National Drug Codes were used to identify antibiotic drugs of interest [12]. The pharmacy variable “days supply” was used to estimate the duration of each prescription.
The treatment start date was defined as the start date of the first regimen meeting the treatment criteria (ie, the start date of the first overlapping prescription). Treatment end date was estimated by adding the number of days of supply to the treatment start date. A macrolide-based multidrug antibiotic treatment episode was considered “ended” when the beneficiary no longer met the MAC therapy definition, and the prescription was not refilled within 30 days of the end of the drug supply. This 30-day time frame allowed for delayed refills to not be considered a lapse in treatment. If a new MAC treatment regimen was started after an episode ended, the subsequent treatment was considered a separate episode. A regimen change during a treatment episode was defined as any change in the composition of companion drugs while still meeting the MAC therapy definition. We excluded those with an erroneous concurrent prescription for both macrolides (azithromycin and clarithromycin) or both rifamycins (rifabutin and rifampin). Observations were censored if <18 months had elapsed between therapy initiation and either death or data end (31 December 2014).
Using descriptive statistics, we examined beneficiaries’ demographic and clinical characteristics. We examined MAC therapy regimens prescribed at treatment start by individual drugs and drug combinations, as well as treatment duration. We defined GBT as a therapy regimen containing a macrolide, rifamycin, and ethambutol, with or without amikacin. We illustrated treatment regimens at treatment initiation and 6, 12, and 18 months after treatment start. To consider the possibility that those receiving short-term therapy (<31 days) may have been treated for a condition other than MAC-PD, we examined the demographic factors, the proportion with an ICD-9-CM diagnosis code for NTM (ICD-9-CM code 031.0: pulmonary mycobacteria), and the proportion with a diagnosis code for Pseudomonas infection (ICD-9-CM code 482.1:Pseudomonas pneumonia or 41.7 :Pseudomonas, unspecified site) during the baseline period. All analyses were performed using SAS statistical software 9.4 (SAS Institute; https://www.sas.com). This study was reviewed and approved by the institutional review board at Oregon Health & Science University.
RESULTS
Of the 618 303 Medicare beneficiaries with a bronchiectasis claim, 20 531 (3.3%) used macrolide-based multidrug antibiotic therapy for MAC-PD for ≥28 days (Figure 1). Of the 20 531, we excluded 7574 (36.9%) with Medicare coverage <12 months between Medicare observation start and MAC therapy initiation, 1469 (7.2%) with a diagnosis of cystic fibrosis, HIV, or a history of organ transplantation, and 2273 (11.1%) who were aged <65 years at Medicare enrollment. We excluded an additional 26 beneficiaries (0.1%) with a concurrent prescription for >1 macrolide or >1 rifamycin in their first treatment regimen, leaving an analytic population of 9189 beneficiaries. Our analytic population had a mean age (standard deviation [SD]) of 78.1 (6.2) years at treatment start, and was mostly female (74.9%) and non-Hispanic white (87.0%) (Table 1). Chronic obstructive pulmonary disease/emphysema (78.4%) was the most common comorbid conditions during the baseline period.
Baseline Demographic and Clinical Characteristics of 9198 US Medicare Beneficiaries Prescribed Macrolide-Based Multidrug Antibiotic Therapy for Presumptive Mycobacterium avium Complex Pulmonary Infection Between January 2006 and December 2014
| Characteristic | Beneficiaries, No (%) |
|---|---|
| Demographic characteristics | |
| ȃAge at treatment start, mean (SD), y | 78.1 (6.2) |
| ȃFemale sex | 6881 (74.9) |
| ȃRace/ethnicity | |
| ȃȃWhite | 7998 (87.0) |
| ȃȃAsian | 500 (5.4) |
| ȃȃHispanic | 388 (4.2) |
| ȃȃBlack | 202 (2.2) |
| ȃȃNorth American Native | 23 (0.3) |
| ȃȃUnknown | <10 (<0.1) |
| ȃTime in Medicare since age 65 y, mean (SD), y | 7.0 (2.2) |
| Clinical characteristicsa,d | |
| ȃChronic obstructive pulmonary disease/emphysema | 7140 (78.4) |
| ȃOral corticosteroid useb | 5652 (61.5) |
| ȃGastroesophageal reflux | 5355 (58.3) |
| Pulmonary NTM infection | 4252 (46.3) |
| ȃAsthma | 2941 (32.0) |
| ȃDiabetes mellitus | 2817 (30.7) |
| ȃRheumatologic disease | 2342 (25.5) |
| ȃPseudomonas infection | 897 (9.8) |
| ȃLung cancer | 823 (9.0) |
| ȃPrimary immune deficiency | 606 (6.6) |
| ȃAllergic bronchopulmonary aspergillosis | 92 (1.0) |
| ȃα1-Antitrypsin deficiency | 44 (0.5) |
| ȃPrimary ciliary dyskinesia | 11 (0.1) |
| ȃSilicosis | <10 (<0.1) |
| ȃChronic kidney disease | <10 (<0.1) |
| ȃCharlson Comorbidity Index score, mean (SD) [16] | 2.3 (1.7) |
| Healthcare utilization, mean (SD), no. per year | |
| ȃClinician office visits | 5.8 (5.4) |
| ȃVisits to pulmonologist | 1.6 (2.0) |
| ȃAny hospitalizations | 1.3 (1.3) |
| ȃHospitalizations due to respiratory illness | 0.7 (1.0) |
| ȃVisits to infectious disease specialists | 0.7 (1.2) |
| ȃAcute respiratory exacerbationsc | 0.7 (1.0) |
Abbreviations: NTM, nontuberculous mycobacteria; SD, standard deviation.
Data represent no. (%) of beneficiaries unless otherwise specified.
National Drug Codes for oral corticosteroids were used to identify the use of oral corticosteroid during the baseline period (eg, ≥1 oral corticosteroid dispensed within 12 months before the start of M. avium complex therapy).
Prescriptions for antibiotics typically used for acute respiratory exacerbation (erythromycin, azithromycin, clarithromycin, inhaled tobramycin, levofloxacin, moxifloxacin, ciprofloxacin, amoxicillin, amoxicillin/clavulanate, or doxycycline) for ≥7 but ≤28 days.
Comorbidities were identified by Medicare claims based on International Classification of Diseases, Ninth Revision, Clinical Modification, codes during the baseline period.
The 9198 beneficiaries in our cohort were treated for a mean (SD) of 140.5 (160.9) days on their initial treatment regimen before changing or stopping the regimen. Of these, 2086 (22.7%) continued on a second regimen for a mean (SD) of 171.6 (166.1) days, and 511 (5.6%) started a third regimen (mean duration [SD], 166.4 [156.3] days) during the initial treatment episode. The most commonly prescribed drugs in the initial regimen were azithromycin (68.0%) and ethambutol (66.7%) (Table 2). The most commonly prescribed regimen (n = 4 690 [51.1%]) was the GBT (a macrolide, rifamycin, and ethambutol, with or without amikacin), used for a mean duration (SD) of 175.6 (172.5) days. Among the GBT regimens, a regimen containing azithromycin, ethambutol, and rifampin was most common (n = 2637 [28.7%]), used for mean (SD) of 188.7 (177.7) days.
Individual Drugs and Drug Regimens Prescribed to Treat Mycobacterium avium Complex Pulmonary Infection Among 9198 Medicare Beneficiaries (Initial Treatment Regimen Prescribed Between January 2006 and December 2014)
| Drug or Regimen | Beneficiaries, No. (%) | Treatment Duration, Median (IQR), d |
|---|---|---|
| Individual drugs | ||
| ȃMacrolide | 9189 (100) | 66.0 (31.0–186.0) |
| ȃȃAzithromycin | 6245 (68.0) | 64.0 (32.0–182.0) |
| ȃȃClarithromycin | 2945 (32.0) | 73.0 (31.0–193.0) |
| Ethambutol | 6128 (66.7) | 96.0 (34.5–254.0) |
| ȃRifamycin | 5627 (61.2) | 81.0 (31.0–240.0) |
| ȃȃRifampin | 4800 (52.2) | 97.5 (35.0–260.0) |
| ȃȃRifabutin | 827 (9.0) | 59.0 (31.0–151.0) |
| ȃAmikacin (inhaled or intravenous) | 125 (1.4) | 59.0 (37.0–99.0) |
| Fluoroquinolone | 2475 (26.9) | 42.0 (31.0–71.0) |
| Drug regimens | ||
| ȃGuideline-based therapy | 4690 (51.1) | 105.0 (38.0–269.0) |
| ȃȃAzithromycin + ethambutol + rifampin | 2637 (28.7) | 121.0 (51.0–291.0) |
| ȃȃClarithromycin + ethambutol + rifampin | 1420 (15.5) | 101.0 (37.0–262.0) |
| ȃȃAzithromycin + ethambutol + rifabutin | 382 (4.2) | 62.0 (31.0–172.0) |
| ȃȃClarithromycin + ethambutol + rifabutin | 246 (2.7) | 62.0 (31.0–142.0) |
| ȃȃAzithromycin + ethambutol + rifabutin + amikacin | <10 (<0.1) | 206.0 (59.0–237.0) |
| ȃȃClarithromycin + ethambutol + rifampin + amikacin | <10 (<0.1) | 63.0 (29.0–97.0) |
| ȃNon–guideline-based therapy | ||
| ȃMacrolide ± ethambutol | 1153 (12.5) | 86.0 (31.0, 221.0) |
| ȃȃAzithromycin + ethambutol | 729 (7.9) | 87.0 (31.0–87.0) |
| ȃȃClarithromycin + ethambutol | 424 (4.6) | 83.5 (31.0–200.0) |
| ȃOther regimens | 3346 (36.4) | 42.0 (31.0–83.0) |
| ȃȃAzithromycin + fluoroquinolone | 1723 (18.8) | 41.0 (32.0–60.0) |
| ȃȃClarithromycin + fluoroquinolone | 380 (4.1) | 45.0 (31.0–86.0) |
| ȃȃAzithromycin + rifampin | 363 (4.0) | 55.0 (31.0–130.0) |
| ȃȃClarithromycin + rifampin | 225 (2.5) | 42.0 (31.0–106.0) |
| ȃȃAzithromycin + ethambutol + fluoroquinolone | 119 (1.3) | 91.0 (31.0–175.0) |
| ȃȃAzithromycin + rifabutin | 85 (0.9) | 34.0 (31.0–116.0) |
| ȃȃClarithromycin + rifabutin | 62 (0.7) | 54.0 (31.0–128.0) |
| ȃȃClarithromycin + ethambutol + fluoroquinolone | 56 (0.6) | 90.50 (33.0–238.0) |
| ȃȃAzithromycin + amikacin | 54 (0.6) | 63.0 (37.0–109.0) |
| ȃȃAzithromycin + rifampin + fluoroquinolone | 41 (0.5) | 85.0 (40.0–189.0) |
| ȃȃAzithromycin + ethambutol + rifampin + fluoroquinolone | 35 (0.4) | 39.0 (31.0–75.0) |
| ȃȃClarithromycin + rifampin + fluoroquinolone | 33 (0.4) | 47.0 (31.0–98.0) |
| ȃȃClarithromycin + ethambutol + rifampin + fluoroquinolone | 28 (0.3) | 32.0 (31.0–60.5) |
| ȃȃClarithromycin + amikacin | 24 (0.3) | 58.5 (37.5–90.0) |
| ȃȃAzithromycin + rifabutin + fluoroquinolone | 15 (0.2) | 31.0 (29.0–94.0) |
| ȃȃAzithromycin + linezolid | 13 (0.1) | 41.0 (31.0–55.0) |
| ȃȃOther | 89 (1.0) | 43.0 (31.0–71.0) |
Abbreviation: IQR, interquartile range.
Non–guideline-recommended therapy regimens were also common. A 2-drug regimen containing a macrolide and ethambutol was prescribed to 1153 individuals (12.5%) for a mean (SD) of 159.5 (179.9) days, while a 2-drug therapy with a macrolide plus fluoroquinolone was prescribed to 2103 individuals (22.9%) for a mean of 72.0 (100.2) days. Those who did not continue treatment after the initial prescription (duration, ≤31 days; n = 2362 [25.8%]) were similar to those who continued beyond the first 31 days (n = 6827 [74.2%]), with respect to the proportion with a diagnosis code for pulmonary NTM (47.0% vs 46.0%, respectively), and a diagnosis code for Pseudomonas (10.3% vs 9.6%) during the baseline period. The groups were also similar in demographic characteristics.
Figure 2 shows the flow of treatment regimens at initiation and at 6, 12, and 18 months of therapy, among the 9104 first-time MAC therapy users after excluding an additional 85 beneficiaries with an erroneous concurrent prescription for >1 macrolide or rifamycin during any treatment episodes after the initial episode. The mean number of regimen changes per beneficiary during the study period (SD) was 1.8 (1.4). At treatment start, 4630 (50.9%) started with GBT, of whom 1890 (40.8%) were continuing on GBT at 6 months, 853 (18.4%) at 12 months, and 263 (5.7%) at 18 months. The proportion of beneficiaries beginning therapy with GBT and the proportions receiving GBT at 6, 12, and 18 months did not change substantially over the study period (Table 3).
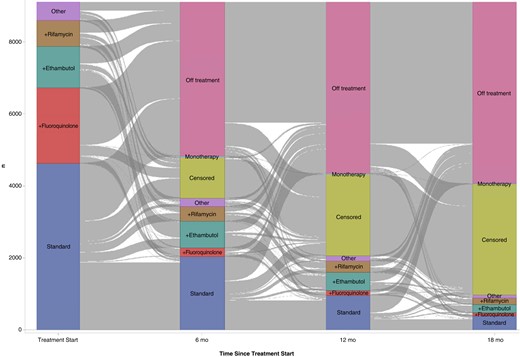
Macrolide-based multidrug antimicrobial therapy for the treatment of pulmonary Mycobacterium avium complex infection prescribed for 9104 Medicare beneficiaries between January 2006 and December 2014 (at treatment start and at 6, 12 and 18 months). Blocks represent treatment regimen groups; gray stream fields between blockst, changes in the regimens. The height of a block represents the number of beneficiaries in the regimen group, and the height of a stream field represents beneficiaries contained in both blocks connected by the stream field. Abbreviations: n, number of beneficiaries; standard, guideline-recommended 3-drug regimen (a macrolide, ethambutol, and rifamycin, with or without amikacin); +ethambutol, macrolide plus ethambutol; +fluoroquinolone, macrolide plus fluoroquinolone; +rifamycin, macrolide plus rifamycin; monotherapy, macrolide monotherapy; other, all other macrolide-based multidrug regimens not listed above; and censored, (1) ending of Medicare coverage owing to death <18 months after therapy initiation or (2) administrative censoring because the data end date (31 December 2014) was reached <18 months after therapy initiation.
Guideline-Based Therapy for Treatment of Pulmonary Mycobacterium avium Complex Infection Prescribed for 9104 Medicare Beneficiaries Between January 2006 and December 2014—at Treatment Start and at 6, 12, and 18 Months, by Year
| Year of Therapy Initiation | Beneficiaries Prescribed MAC Therapy, Total No. | Beneficiaries, No. (%) | |||
|---|---|---|---|---|---|
| No. prescribed GBT at Therapy Initiation | No. on GBT at 6 mo, (%)a | No. on GBT at 12 mo, (%)a | No. on GBT at 18 mo, (%)a | ||
| 2007 | 919 | 434 (47.2) | 172 (39.6) | 90 (20.7) | 36 (8.3) |
| 2008 | 1,163 | 592 (50.9) | 263 (44.4) | 124 (20.9) | 42 (7.1) |
| 2009 | 1080 | 574 (53.2) | 244 (42.5) | 133 (23.2) | 43 (7.5) |
| 2010 | 1094 | 601 (54.9) | 278 (46.3) | 130 (21.6) | 42 (7.0) |
| 2011 | 1158 | 582 (50.3) | 240 (41.2) | 103 (17.7) | 27 (4.6) |
| 2012 | 1228 | 627 (51.1) | 272 (43.4) | 142 (22.6) | 47 (7.5) |
| 2013 | 1171 | 557 (47.6) | 264 (47.4) | 131 (23.5) | 26 (4.7) |
| 2014 | 1291 | 663 (51.4) | 157 (23.7) | ND | ND |
Abbreviations: GBT, guideline-based therapy; MAC, Mycobacterium avium complex; ND, no data available (owing to censoring).
Of those starting with GBT at therapy initiation for each year.
Those who were still receiving GBT at 6 months were on average 1 year (SD, 6.0 years) younger than those who were not (P < .01); had a mean (SD) of 1.2 (4.6) fewer clinic visits (P < .01) and 0.3 (1.5) fewer hospitalizations annually during the baseline period; and had a higher mean Charlson Comorbidity Index score (mean [SD], 0.3 [1.6] points higher). A large number of beneficiaries discontinued treatment before reaching 18 months; 4278 (47.0%) were off macrolide-based treatment after 6 months, 4758 (52.3%) after 12 months, and 5840 (64.2%) after 18 months. Of the 4278 who were off treatment at 6 months, only 287 (6.7%) had restarted therapy by 12 months. Of the 4758 who were off treatment at 12 months, 201 (4.2%) had restarted therapy by 18 months. Overall, of the 9104 who initiated treatment, 982 (10.8%) were still on macrolide-based multidrug antibiotic therapy at 18 months; 3083 (33.9%) were censored, either owing to death before reaching 18 months of therapy (n = 397) or because the observation period ended (31 December 2014) before that point. For all episodes combined, the 9104 beneficiaries had a mean (SD) of 1.5 (0.9) treatment episodes, for a mean duration of 257.9 (268.7) days.
DISCUSSION
We examined patterns of macrolide-based multidrug antibiotic therapies for MAC-PD in Medicare beneficiaries between January 2006 and December 2014. We found that the GBT was prescribed in only half of new MAC therapy users at treatment start. Furthermore, fewer than half of these individuals continued GBT at 6 months, and the vast majority had discontinued GBT at 12 months. Overall, regardless of the starting regimen, by 18 months, only 11% were still receiving MAC treatment, 55% had discontinued therapy, and 34% were censored.
The current guidelines for MAC-PD recommend a daily or 3-times-weekly drug regimen with a macrolide, ethambutol, and a rifamycin until the patient has remained culture negative for 1 year [2, 7], which is currently recognized as the most effective regimen [17, 18]. There was no change in initial therapy for MAC-PD between the 2007 and 2020 guidelines. Other studies have also suggested that treatment success is likely maximized during the initial treatment episode and subsequently declines at later attempts [19, 20], which underscores the importance of choosing an appropriate regimen at the initial attempt. Few non-US studies have reported on prescribing patterns of pulmonary MAC therapy. A cohort study of adults aged ≥66 years in Ontario identified patterns of MAC therapy [21], and showed that although the most commonly prescribed regimen was the GBT, many received regimens associated with macrolide resistance. Another study based on physician surveys reported that only 16.9% of 746 treated patients with MAC received >6 months of GBT (41.9% in Japan and 9.2% in European countries) [22]. A German study based on healthcare administrative data reported that 45.2% of 93 patients with pulmonary NTM were prescribed GBT to start [23]. A Japanese study using claims data reported GBT use in 25.1% of patients with MAC, while monotherapy was used in as high a proportion as 30.6% [24]. Less is known about prescribing patterns for pulmonary MAC therapy in the United States. According to a US physician survey, among regimens prescribed to patients with MAC infection, only 13% were GBT, and 30% were regimens known to be associated with macrolide resistance [17]. A US multicenter retrospective study observed adherence to guideline in 33% of patients, though specific regimens were not described [9].
We observed an unexpectedly low percentage of beneficiaries still receiving MAC therapy at months 6, 12 and 18, particularly those on GBT, although 33% were censored. The reasons for early treatment interruption and discontinuation in the majority are unclear, but many patients likely discontinue treatment prematurely due to drug-associated adverse events. MAC therapy–associated adverse events, including allergic reactions and drug toxicity, are common, especially in older individuals, those with existing liver or renal disease, those using other medical therapies, and those with lower body mass index [2, 25]. Macrolides are often associated with reversible hearing loss, tinnitus, QT prolongation, gastrointestinal disturbance, and nausea and vomiting [26]. Hepatotoxicity, gastrointestinal disturbance, and immunologic reactions, including acute renal failure and thrombocytopenia, are among the rifamycin-induced adverse effects [2]. Optic neuritis, vision changes, numbness or tingling in hands and feet, and ocular toxicity are among the well-documented adverse events associated with ethambutol [3, 27]. Irreversible ototoxicity and vestibular toxicity are often associated with aminoglycosides such as amikacin. Furthermore, drug-to-drug interaction is an important issue in elderly persons, the population primarily affected by NTM disease. Finally, because of the long duration of treatment required for MAC-PD, patient compliance can often be an issue, especially for older patients.
We observed that regimens associated with macrolide resistance were often prescribed. Previous studies have also reported the use of such regimens, including one report describing a regimen with a macrolide and fluoroquinolone alone used in as many as 30% of MAC therapy users [8, 17, 22]. Furthermore, although we do not have data on macrolide monotherapy at treatment start because our inclusion criteria required a macrolide-based multidrug regimen, we observed that of the 9104 who started with a multidrug regimen, 35 (0.4%) were on macrolide monotherapy at 6 months, 22 (0.2%) at 12 months, and 12 (0.1%) at 18 months. According to the treatment guidelines, macrolides should never be used as monotherapy for MAC-PD [2, 7]. These observations are concerning because macrolide-resistant MAC is extremely difficult to treat and is associated with higher mortality rates and poor disease outcomes [2, 7, 10]. Moreover, macrolides are the only antibiotics other than amikacin, for which in vitro susceptibility correlates with clinical response in MAC-PD [2, 7, 19]. It follows that treatment options are extremely limited for patients with macrolide-resistant infections. However, it is encouraging that only a few of those who started macrolide-based multidrug therapy later began macrolide monotherapy. Those who switched to macrolide monotherapy sometime after treatment start may have been empirically started on MAC therapy in the absence of microbiologic data and switched to macrolide monotherapy after negative culture results were obtained or simply for immunomodulatory purposes (ie, prevention of bronchiectasis exacerbations).
Our work identified a higher proportion of adherence to guidelines than prior studies, which is encouraging given that the current study reflects a large US population covered by Medicare. However, as observed in previous studies, a large proportion of beneficiaries in this study were treated with non–guideline-based regimens. The reason for poor adherence to GBT is unclear. Because the current guidelines are largely based on data from small observational studies rather than randomized control trials, prescribing practitioners may have low confidence in strictly adhering to the guidelines. In addition, given the small number of treatment centers specialized in treating pulmonary NTM infections throughout the United States, some practitioners in community settings may not have the same expertise in NTM treatment as those at specialized treatment centers.
Our study has several notable strengths. It adds important data to the current literature on prescribing practices for antibiotic therapy for MAC-PD among US Medicare beneficiaries. MAC-PD primarily affects older individuals, and recent increases in disease occurrence have been most evident among those aged ≥60 years. Given the age distribution of MAC-PD, and the fact that 96% of Americans aged ≥65 years have Medicare coverage [28], Medicare provides an ideal data source to conduct epidemiologic studies on MAC-PD. In addition, missing data constitute a very minor problem in the Medicare data system, as Medicare data likely capture the entirety of beneficiaries’ healthcare encounters.
Our study also has some limitations. First, diagnostic criteria for MAC-PD include microbiologic data. However, because these are not included in Medicare data, our case definition was based on prescriptions for a macrolide-based multidrug regimen. Misclassification of noncases as MAC-PD cases is possible (eg, those treated for another condition, such as Pseudomonas exacerbation, or for NTM species other than MAC). We examined the possibility that those receiving a short-term therapy (<31 days) may have been treated for a condition other than MAC-PD. The proportions of those with a claim for Pseudomonas were similar in those receiving short-term therapy (≤31 days) and those who were on therapy for a longer period (>31 days) (10.3% vs 9.6%, respectively). Similarly, the proportions of those with a claim for pulmonary NTM were also similar in the 2 groups (47.0% vs 46.0%, respectively). Second, we did not have access to beneficiaries’ full treatment history before Medicare enrollment to ensure that all included beneficiaries were treatment naive at Medicare enrollment. We required ≥12 months of no evidence of MAC therapy since Medicare enrollment to be included in the cohort; this should have reduced the potential for non–treatment naive individuals in the cohort, along with multiple years of Medicare coverage before treatment, and the fact that NTM primarily affects older individuals. However, some beneficiaries who received treatment before Medicare enrollment could have been included, and clinical response to prior therapy may have had an impact on the choice of subsequent therapy. Third, our data were from 2006–2014 and treatment patterns may have changed since then. However, we observed that the proportion of beneficiaries beginning therapy with GBT and the proportions receiving GBT at 6, 12, and 18 months per each year did not change substantially during the study period. Finally, because our cohort consisted of Medicare beneficiaries aged ≥65 years with bronchiectasis, the generalizability of our findings to younger patients or those without bronchiectasis may be limited. These inclusion criteria undoubtedly explain the prevalence of some preexisting or coexisting conditions. The rate of gastroesophageal reflux disease in particular was higher than previously reported among patients with NTM [5, 29, 30] but comparable to observations in patients who had both bronchiectasis and NTM [31].
In summary, our findings indicate that half of Medicare beneficiaries with bronchiectasis who start MAC therapy, do so with a non–guideline-based therapy, and some recieve regimens associated with macrolide resistance. Treatment discontinuation was common, and once therapy was discontinued, few resumed it at a later time. Our study adds important data to the current literature on treatment patterns for MAC-PD among older US populations. Future research should examine treatment patterns using more contemporary data sources, as new drugs become available. In addition, further research is needed to better understand factors associated with therapy discontinuation, barriers and facilitators of guideline-adherent prescribing for NTM, and associations between treatment and clinical outcomes.
References
Author notes
Potential conflicts of interest. J. H. K. has received research grants from Moderna and GlaxoSmithKline, paid to the institution. E. H. has served on advisory board for AN2 Pharmaceuticals and received consulting fees. S. K. B. reports grants or contracts from Insmed, outside the submitted work and paid to the institution, as site subinvestigator for a clinical trial in nontuberculous mycobacteria (NTM) lung disease; payment or honoraria paid to institution from Boehringer Ingelheim; and membership on the executive committee for The Union–North American Region. T. K. M. has received grants or contracts from the Ontario Thoracic Society/Lung Foundation for a study on preventing the recurrence of Mycobacterium avium (MAC) lung disease, from Insmed as site investigator for a clinical trial on MAC lung disease, and from the Oregon Health & Science University/Patient Centered Outcomes Research Institute as site investigator for clinical trial of MAC lung disease, all paid to the institution, and from the Lung Health Foundation. T. K. M. has received consulting fees from Insmed, RedHill Biopharma, and Spero, including for MAC lung disease study design, paid to the institution; payment or honoraria from Astra Zeneca and Novartis for CME in NTM lung disease, paid to the institution; and support for attending meetings and/or travel from NTM Info & Research (NTMir) and hotel accommodation for presentation at the NTMir annual meeting for patients and providers associated with the American Thoracic Society Annual Conference in May 2019. T. K. M. has also served as chair of the data safety monitoring board for clofazimine monotherapy in MAC lung disease and has a leadership/fiduciary role as an advisor to the Toronto NTM lung disease patient support group. K. L. W. has grants or contracts and consulting fees from Paratek, AN2 Pharmaceuticals, Insmed, and Red Hill Biopharma and consulting fees from Spero Therapeutics. All other authors report no potential conflicts. All authors have submitted the ICMJE Form for Disclosure of Potential Conflicts of Interest. Conflicts that the editors consider relevant to the content of the manuscript have been disclosed.

