


Abstract
Previous severe acute respiratory syndrome coronavirus 2 (SARS-CoV-2) infection and coronavirus disease 2019 (COVID-19) vaccination, independently and combined (“hybrid immunity”), result in partial protection from subsequent infection and strong protection from severe disease. Proportions of the US population who have been infected, vaccinated, or have hybrid immunity remain unclear, posing a challenge for assessing effective pandemic mitigation strategies.
In this serial cross-sectional study, nationwide blood donor specimens collected during January–December 2021 were tested for anti-spike and anti-nucleocapsid antibodies, and donor COVID-19 vaccination history of ≥1 dose was collected. Monthly seroprevalence induced from SARS-CoV-2 infection, COVID-19 vaccination, or both, were estimated. Estimates were weighted to account for demographic differences from the general population and were compared temporally and by demographic factors.
Overall, 1 123 855 blood samples were assayed. From January to December 2021, the weighted percentage of donations with seropositivity changed as follows: seropositivity due to vaccination without previous infection, increase from 3.5% (95% confidence interval, 3.4%–3.7%) to 64.0%, (63.5%–64.5%); seropositivity due to previous infection without vaccination, decrease from 15.6% (15.2%–16.0%) to 11.7% (11.4%–12.0%); and seropositivity due to hybrid immunity, increase from 0.7% (0.6%–0.7%) to 18.9% (18.5%–19.3%). Combined seroprevalence from infection, vaccination, or both increased from 19.8% (19.3%–20.2%) to 94.5% (93.5%–94.0%). Infection- and vaccination-induced antibody responses varied significantly by age, race-ethnicity, and region, but not by sex.
Our results indicate substantial increases in population humoral immunity from SARS-CoV-2 infection, COVID-19 vaccination, and hybrid immunity during 2021. These findings are important to consider in future COVID-19 studies and long-term pandemic mitigation efforts.
Severe acute respiratory syndrome coronavirus 2 (SARS-CoV-2), the virus that causes coronavirus disease 2019 (COVID-19), has resulted in more than 981 000 deaths and 80.1 million cases in the United States as of 8 April 2022 [1]. COVID-19 vaccinations [2], previous SARS-CoV-2 infections [3, 4], and especially hybrid immunity [5, 6] are protective against severe consequences of SARS-CoV-2 infection. Hybrid immunity has been defined as the immunological responses of individuals with histories of both previous SARS-CoV-2 infection and vaccination [5, 6]. Long-term public health prevention strategies remain a substantial challenge owing to gaps, including in the accurate and timely determination of population immunity induced by SARS-CoV-2 infections and COVID-19 vaccinations.
There are logical reasons why population immunity against SARS-CoV-2 is difficult to assess. A sizeable proportion of SARS-CoV-2 infections are asymptomatic [7] or result in mild COVID-19 disease [8], which is less likely to be recognized [9]. Characterizing population immunity requires accounting for these undiagnosed SARS-CoV-2 infections. This is difficult to accurately track with reference standard COVID-19 nucleic acid amplification tests [10] because their utility at the population level is constrained by narrow detection windows dependent on viral kinetics and clearance [11], high cost, and need for specialized laboratory facilities [10]. Many people may not seek diagnostic testing or only use at-home tests without reporting results. As a result, the estimated proportion of the population with infection-induced or hybrid immunity remains unclear. Moreover, national SARS-CoV-2 infection and vaccination data are often collected independently and are therefore difficult to combine into estimates for hybrid immunity.
Investigators have estimated seroprevalence via detection of SARS-CoV-2 spike (S) and nucleocapsid (N) protein antibodies [12–14]. Assays that can reliably detect and differentiate SARS-CoV-2 infection– and vaccination-induced antibodies are optimal for serosurveillance [15]. Determining the proportions of the population with antibodies from vaccination, infection, or both is needed to inform pandemic mitigation efforts.
Our study objective was to estimate national trends in the proportions of individuals with previous SARS-CoV-2 infection, COVID-19 vaccination, or both in 2021, based on seroprevalence of SARS-CoV-2 antibodies and self-reported vaccination status among US blood donors. We report population-weighted estimates temporally by calendar month and compare results by demographic factors.
METHODS
Settings and Participants
The present analysis is part of a larger National Blood Donor Seroprevalence (NBDS) Study, which began in July 2020 and is funded by the Centers for Disease Control and Prevention (CDC) [12]. In the NBDS study, donor and donation data were collected in all 50 states, Washington, DC, and Puerto Rico by 17 participating blood collection organizations, with results compiled in 66 study regions [12]. Random or convenience sampling was used to identify and test ≥2000 blood specimens per month from every region in each blood collection organizations’ catchment area. When <2000 specimens were available, 100% were sampled. To facilitate comparisons by race and ethnicity, blood donor regions with higher proportions of racial and ethnic minorities were oversampled (4000 blood samples/month). Detailed methods of this study have been published elsewhere [12].
This analysis evaluated the subset of NBDS blood donors with vaccination history. Participants were individuals who donated blood at the American Red Cross (ARC) and Vitalant, the 2 largest blood collection organizations in the United States, representing 54 of 66 NBDS study regions. Inclusion criteria were: (1) blood donation between 1 January and 31 December 2021; (2) residence in study regions; (3) satisfaction of US Food and Drug Administration regulations and each blood collection organization’s donation requirements (eg, age ≥16 years, weight >110 lb, and healthy status, including being afebrile); (4) measurement of SARS-CoV-2 antibodies; and (5) self-reported COVID-19 vaccination history. Excluded were (1) persons making COVID-19 convalescent plasma donations and (2) those with records missing demographic data.
Donor Demographic and Vaccination Data
At each visit, donors were asked to provide demographic information (date of birth, sex, race and ethnicity, residential zip code) and completed a donor history questionnaire that included a question regarding having ever received a COVID-19 vaccination.
Laboratory Assays for SARS-CoV-2 Antibodies
All blood specimens were assayed for antibodies to SARS-CoV-2 spike glycoprotein (anti-S; VITROS chemiluminescent S1 total immunoglobulin (Ig) assay; Ortho Clinical Diagnostics). Before 31 August 2021, only specimens that were anti-S seropositive were subsequently tested for antibody to SARS-CoV-2 nucleocapsid (anti-N; Roche Elecsys total Ig assay; Roche Diagnostics). From September 2021, donations were tested in parallel for anti-S and anti-N (VITROS chemiluminescent total Ig assays; Ortho Clinical Diagnostics); previous studies found that the impact of this algorithm would be minimal since 99% of specimens with anti-N antibodies have anti-S antibodies [16]. Our group previously validated these assays for sensitivity, specificity, and durability of detection of anti-S and anti-N antibodies after infection [16]. Testing of ARC and Vitalant donation specimens for the NBDS program was performed at 5 laboratories operated by Creative Testing Solutions. Seropositivity was defined as a signal-to-cutoff ratio (S/CO) ≥1.0, per manufacturers’ instructions.
Primary Outcomes
We defined SARS-CoV-2 infection and COVID-19 vaccination status based on serologic assays for SARS-CoV-2 antibodies and self-reported COVID-19 vaccination history at each donation. SARS-CoV-2 infection was defined as seropositivity for anti-N or, in the absence of reported vaccination, for anti-S. Combined SARS-CoV-2 seropositivity was defined as having any of previous SARS-CoV-2 infection, COVID-19 vaccination, or both (the latter also called “hybrid immunity”; Supplementary Table 1).
Statistical Analyses
We used a complete-case analysis approach for observations without missing data (Figure 1). A small percentage (0.8%) of samples were excluded owing to missing race or ethnicity information. Among a small number of observations with seropositivity for anti-S and missing values for anti-N (n = 5034 [<0.5%]), we imputed anti-N seropositivity based on data from all participants with anti-N values and matching anti-S values (Supplementary Methods).
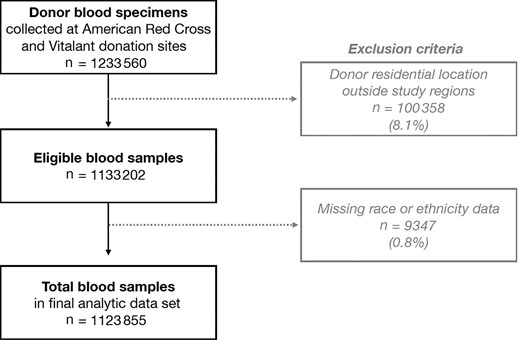
Flowchart of blood samples from American Red Cross and Vitalant donors. Samples from Chicago, Northern New Jersey, and Pittsburgh Vitalant sites were excluded because they had no available self-reported vaccination history. All samples in the final data set had sex, age, residential location, severe acute respiratory syndrome coronavirus 2 (SARS-CoV-2), and vaccination history data.
We used weights to adjust for demographic differences between blood donors in our study data and the population aged ≥16 years in blood donor catchment regions. All reported values are weighted unless stated otherwise. Details of the weighting method have been published elsewhere [12] and are described in the Supplementary Methods. In brief, weights were calculated by calibrating (via raking and trimming) the final analytic subset to representative demographic data from the US Census Bureau in blood donor catchment regions [17]. Specifically, the following variables and data from the 2014–2018 American Community Survey were used: age categories (16–24, 25–34, 35–44, 55–64, ≥65 years), biological sex, race and ethnicity (self-identified from 7 fixed categories), and geographic location [17]. Variance estimates (standard errors for confidence limits) were calculated using 50 replicate weights constructed by jackknife repeated replication, a resampling technique [18].
In each month’s cross-sectional data, we generated population-weighted percentages and 95% confidence intervals (CIs) of seropositivity from previous SARS-CoV-2 infection and from COVID-19 vaccination (Supplementary Methods). We evaluated relative levels of antibody to S by calculating means (with standard deviations) and medians (with interquartile ranges) of anti-S intensity (log10 S/CO) on the VITROS S1 total Ig assay. For geographic comparisons, we combined donor zip codes into 9 census divisions (Supplementary Figure 1). Statistical analysis was conducted using SAS software (version 9.4; SAS Institute).
Comparisons Between Vaccination Coverage Estimates
We compared our estimated rate of vaccination in blood donors with the expected vaccination coverage derived from CDC data. We first identified 54 study regions across 31 states with available CDC vaccination data. To ensure that the same geographic areas were represented each month, sampled geographic regions from each blood collection organization were defined by zip codes where >90% of blood donors resided. Specimens from donors residing outside those zip codes were excluded (Supplementary Methods). From these aggregated zip codes, study regions were created based on state and metropolitan borders. CDC data specifically include daily numbers of people and percentages of adults (aged ≥18 years) in each county who received ≥1 vaccine dose. Among study participants who donated in the study regions, we compared 2 versions of our weighted monthly vaccination estimates based on: (1) self-reported COVID-19 vaccination and (2) self-reported COVID-19 vaccination with serologic confirmation (seropositivity for anti-S). Further details are described in the Supplementary Methods.
Ethical Approval
The study protocol was approved by the University of California, San Francisco, ARC, and Westat institutional review boards. All donors provided voluntary, informed consent for use of their deidentified data and residual blood samples from routine blood donations for research. This study was deemed nonhuman subjects’ research. This activity was reviewed by CDC and was conducted consistent with applicable federal law and CDC policy (eg, 45 CFR part 46, 21 CFR part 56, 42 USC 241[d], 5 USC 552a, and 44 USC 3501). We report study methods according to the Strengthening the Reporting of Observational Studies in Epidemiology guidelines for cross-sectional studies [19].
RESULTS
The current study included 1 123 855 blood donations collected from 1 January to 31 December 2021, across the United States (Supplementary Figure 1 and Table 1). The number of donations included per month ranged between 92 096 and 97 170 (Supplementary Table 2). Overall, study donors had a mean age of 51.4 years; 51.2% were female; and 87.9% were non-Hispanic white, 2.5% non-Hispanic black, and 5.6% Hispanic, based on unweighted values (Table 1). Demographic comparisons of study blood donors with the general population, in study regions and nationally, are provided in Table 1; race-ethnicity differed between the study sample and national census data.
Demographic Characteristics
| Characteristic | Selected Sample With Vaccination Data (ARC and Vitalant) | US Population Aged ≥16 y in ARC and Vitalant Study Regions | US Population Aged ≥16 ya | |||
|---|---|---|---|---|---|---|
| No. | % | No. | % | No. | % | |
| Total | 1 123 855 | 100 | 144 161 836 | 100 | 260 534 061 | 100 |
| Sex | ||||||
| Male | 548 541 | 49 | 70 204 212 | 49 | 126 998 469 | 49 |
| Female | 575 314 | 51 | 73 957 624 | 51 | 133 535 592 | 51 |
| Age, y | ||||||
| 16–29 | 130 352 | 12 | 34 882 830 | 24 | 62 732 069 | 12 |
| 30–49 | 327 868 | 29 | 47 186 683 | 33 | 84 217 499 | 29 |
| 50–64 | 407 597 | 36 | 35 244 590 | 24 | 63 705 642 | 36 |
| ≥65 | 258 038 | 23 | 26 847 733 | 19 | 49 878 851 | 23 |
| Race and ethnicity | ||||||
| White, non-Hispanic | 987 660 | 88 | 92 913 479 | 64 | 164 254 508 | 63 |
| Black, non-Hispanic | 28 066 | 2 | 17 505 250 | 12 | 30 855 020 | 12 |
| Hispanic | 62 417 | 6 | 21 213 139 | 15 | 43 854 340 | 17 |
| Asian, non-Hispanic | 27 332 | 2 | 8 434 430 | 6 | 14 295 323 | 5 |
| Other | 18 380 | 2 | 4 095 538 | 3 | 7 274 870 | 3 |
| Census division | ||||||
| 1. New England | 113 637 | 10 | 10 558 443 | 7 | 12 163 848 | 5 |
| 2. Middle Atlantic | 78 115 | 7 | 15 879 225 | 11 | 33 526 678 | 13 |
| 3. East North Central | 111 607 | 10 | 11 937 628 | 8 | 37 478 378 | 14 |
| 4. West North Central | 121 484 | 11 | 12 221 003 | 8 | 16 752 533 | 6 |
| 5. South Atlantic | 188 133 | 17 | 29 061 803 | 20 | 51 532 352 | 20 |
| 6. East South Central | 84 581 | 8 | 8 588 941 | 6 | 15 109 636 | 6 |
| 7. West South Central | 41 437 | 4 | 8 419 508 | 6 | 30 499 604 | 12 |
| 8. Mountain | 260 402 | 23 | 22 432 600 | 16 | 18 707 146 | 7 |
| 9. Pacific | 124 459 | 11 | 25 062 685 | 17 | 41 984 697 | 16 |
Abbreviation: ARC, American Red Cross.
Donations from Puerto Rico are included in the total but excluded from census division strata because Puerto Rico is not included in any census division.
From January to December 2021, the weighted monthly percentages of donations with seropositivity changed as follows: seropositivity due to vaccination without previous infection, increase from 3.5% (95% CI, 3.4%–3.7%) to 64.0%, (63.5%–64.5%); seropositivity due to previous infection without vaccination, decrease from 15.6% (15.2%–16.0%) to 11.7% (11.4%–12.0%); and seropositivity due to hybrid immunity, increase from 0.7% (0.6%–0.7%) to 18.9% (18.5%–19.3%) (Figure 2A and Supplementary Table 2). Combined seroprevalence from previous infection, vaccination, or both increased from 19.8% to 94.5% (Supplementary Table 2).
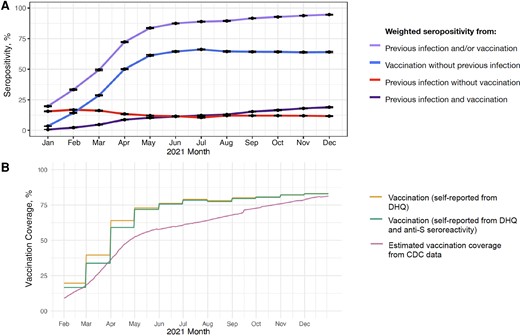
A, Population-weighted percentages (95% confidence intervals) of seropositivity from previous SARS-CoV-2 infection and COVID-19 vaccination status from January to December 2021. Previous severe acute respiratory syndrome coronavirus 2 (SARS-CoV-2) infection was defined as seropositivity for anti-nucleocapsid antibody or, in the absence of reported vaccination, for anti-spike antibody (anti-S). Vaccination was defined as self-report of ≥1 coronavirus disease 2019 (COVID-19) vaccine dose on the donor history questionnaire (DHQ) (Supplementary Table 1). B, Comparison of population-weighted seropositivity from COVID-19 vaccination estimated from ARC and Vitalant blood donors with Centers for Disease Control and Prevention (CDC) vaccination data. Estimated vaccination coverage from CDC data was defined as ≥1 COVID-19 vaccine dose among residents aged ≥18 years in counties in the catchment area of the study (Supplementary Figure 1).
By December, estimated population vaccination coverage was 83.0% (95% CI, 82.6%–83.4%) based on donor self-report and 82.9% (82.5%–83.3%) based on donor self-report with anti-S antibody confirmation (Figure 2B and Supplementary Table 2). These estimates were similar to the CDC-data–derived estimate [20], which was 81.3% as of 31 December 2021. In January 2021, the vaccination coverage extrapolated from blood donors was higher than CDC vaccination estimates; differences declined during the last quarter of 2021. Among donations from donors who self-reported vaccination in the donor history questionnaire, 97.4% had anti-S antibody during 2021, and >99% had anti-S antibody between June and December 2021 (Supplementary Table 2).
Monthly estimates of the percentage of individuals with infection- and vaccination-induced antibody responses varied by age (Figure 3), race and ethnicity (Figure 4), and region (Figure 5), but not by sex (Supplementary Figure 2). Estimated seroprevalence from vaccination was positively associated with age: the percentage among older individuals (aged ≥65 years) was highest during all months except January (Figure 3 and Supplementary Table 3). In December, estimated seroprevalence from vaccination was 89.0% (95% CI, 88.4%–89.7%) for age ≥65 years, 85.6% (85.1%–86.1%) for age 50–64 years, 82.7% (82.0%–83.4%) for age 30–49 years, and 75.2% (74.1%–76.3%) for age 16–29 years. Estimated seroprevalence from previous infection was inversely associated with age group; across all time points, individuals aged 16–29 years had the highest prevalence and those aged ≥65 years had the lowest. Estimated seroprevalence from hybrid immunity was similar among age groups from January to July and was inversely associated with age during the remaining months. By December, estimated seroprevalence from hybrid immunity was 24.0% (95% CI, 22.7%–25.2%) among individuals aged 16–29 years and 12.5% (11.8%–13.1%) among those aged ≥65 years.
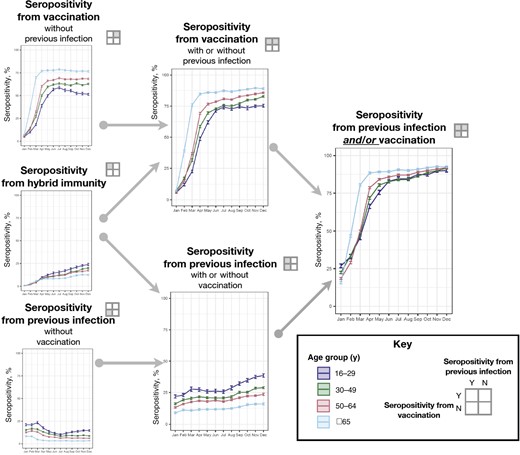
Population-weighted percentages of seropositivity (with 95% confidence intervals) by previous severe acute respiratory syndrome coronavirus 2 (SARS-CoV-2) infection and coronavirus disease 2019 (COVID-19) vaccination status, stratified by age subgroups. Previous SARS-CoV-2 infection was defined as seropositivity for anti-nucleocapsid antibody or, in the absence of reported vaccination, for anti-spike antibody. Vaccination was defined as self-report of ≥1 COVID-19 vaccine dose on the donor history questionnaire (Supplementary Table 1). Abbreviations: N, no; Y, yes.
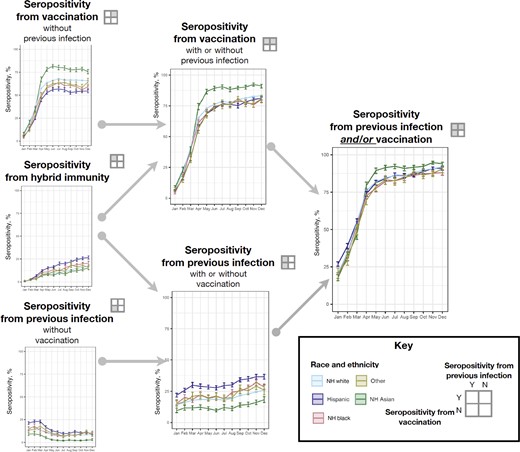
Population-weighted percentages of seropositivity (with 95% confidence intervals) by previous severe acute respiratory syndrome coronavirus 2 (SARS-CoV-2) infection and coronavirus disease 2019 (COVID-19) vaccination status, stratified by race and ethnicity. Previous SARS-CoV-2 infection was defined as seropositivity for anti-nucleocapsid antibody or, in the absence of reported vaccination, for anti-spike antibody. Vaccination was defined as self-report of ≥1 COVID-19 vaccine dose on the donor history questionnaire (Supplementary Table 1). Abbreviations: N, no; NH, non-Hispanic; Y, yes.
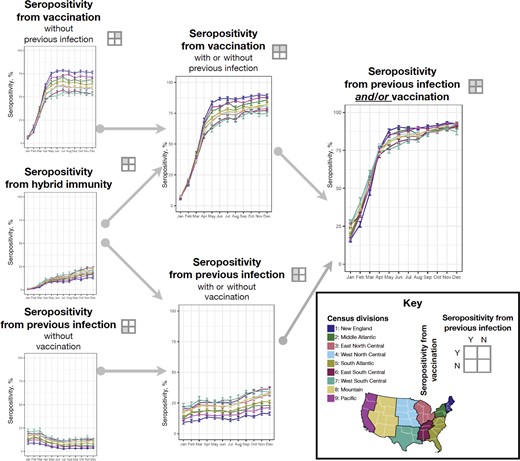
Population-weighted percentages of seropositivity (with 95% confidence intervals) by previous severe acute respiratory syndrome coronavirus 2 (SARS-CoV-2) infection and coronavirus disease 2019 (COVID-19) vaccination status, stratified by geographic location. Previous SARS-CoV-2 infection was defined as seropositivity for anti-nucleocapsid antibody or, in the absence of reported vaccination, for anti-spike antibody. Vaccination was defined as self-report of ≥1 COVID-19 vaccine dose on the donor history questionnaire (Supplementary Table 1). Abbreviations: N, no; Y, yes.
In December, estimated seroprevalence from infection was 40.0% (95% CI, 38.0%–41.9%) among Hispanic, 34.8% (33.0%–36.6%) among black (non-Hispanic), 28.7% (28.3%–29.2%) among white (non-Hispanic), and 22.3% (20.0%–24.5%) among Asian people (Figure 4 and Supplementary Table 3). Estimated seroprevalence from hybrid immunity was 26.5% (95% CI, 24.8%–28.3%) among Hispanic people, 20.7% (19.0%–22.6%) among black (non-Hispanic) people, 17.3% (16.9%–17.7%) among white (non-Hispanic) people, 16.3% (13.9%–19.2%) among people categorized as other race and ethnicity, and 15.4% (13.5%–17.6%) among Asian people.
Comparing by census divisions, estimated seroprevalence from vaccination was similar during the first quarter of 2021 (Figure 5 and Supplementary Table 3). Estimated seroprevalence from infection was lower in the New England and Pacific Census divisions during most months, whereas seroprevalence from infection was highest in the East South Central, West South Central and Mountain divisions. For example, in the New England division, estimated seroprevalence from infection increased from 9.9% (95% CI, 8.7%–11.3%) to 20.0% (18.7%–21.4%) over the year, whereas in the East South Central Division seroprevalence increased from 22.7% (21.1%–24.3%) to 40.2% (38.6%–41.8%).
Mean log anti-S S/CO values were highest among donors with seropositivity from hybrid immunity, followed by values among those with vaccination (without previous infection), and lowest among those with previous infection but no vaccination (Figure 6A). These differences were significant throughout the year. There was a transient decline in anti-S antibody levels from August through November. Although the mean levels of anti-S were consistently higher among those with hybrid immunity than among those with vaccination-induced or infection-induced immunity, there was substantial overlap in the distribution of antibody levels among these subgroups (Figure 6B).
![Population-weighted mean and distribution of severe acute respiratory syndrome coronavirus 2 (SARS-CoV-2) spike protein antibody (signal-to-cutoff ratio [S/CO]), stratified by month and previous SARS-CoV-2 infection and coronavirus disease 2019 (COVID-19) vaccination status. Previous SARS-CoV-2 infection was defined as seropositivity for anti-nucleocapsid antibody or, in the absence of reported vaccination, for anti-spike antibody (anti-S). Vaccination was defined as self-report of ≥1 COVID-19 vaccine dose on the donor history questionnaire (Supplementary Table 1). A, Weighted, log-normalized mean S/CO values of anti-S antibodies (with standard deviation) were reported among blood samples from donations in each calendar month of 2021, stratified by previous infection and vaccination status subgroups. B, Weighted, log-normalized median S/CO values of anti-S antibodies (with interquartile range) were reported, stratified by month, previous infection and vaccination subgroup status of blood donors. Abbreviation: CDC, Centers for Disease Control and Prevention.](https://oup.silverchair-cdn.com/oup/backfile/Content_public/Journal/cid/75/Supplement_2/10.1093_cid_ciac470/1/m_ciac470f6.jpeg?Expires=1750200013&Signature=05G7745JeHXFh3d5hVfFEpjm0hwUkQBPAvGtAjVfZSCnDnXHtI7xOplubxfFT4z0Ia9eItTr69hkq0ti9Znm92NCcQXuXVBqAJhPXPduyju-QwBiyQbDENuQoGo48YLTeRDxaC7sRz22jqBoBj8GuMpwqWCx-bNGdY4g5Bb8AxTr-eQOS5dD6aXhmVD5j15DNIjWdBFZjj89xqOdIWCjmr9uFpLrSo2aOMIgPzJQVXV5PDbZMfd7o~XDKSYXtiuTjs1EeidiEf8WZyTzfs2qNZX9zejYfYAm53X8j978AiHtyFRWg9LuahhNdqO-z5Y36jzniNCc7GAl6kxJ8SZBRQ__&Key-Pair-Id=APKAIE5G5CRDK6RD3PGA)
Population-weighted mean and distribution of severe acute respiratory syndrome coronavirus 2 (SARS-CoV-2) spike protein antibody (signal-to-cutoff ratio [S/CO]), stratified by month and previous SARS-CoV-2 infection and coronavirus disease 2019 (COVID-19) vaccination status. Previous SARS-CoV-2 infection was defined as seropositivity for anti-nucleocapsid antibody or, in the absence of reported vaccination, for anti-spike antibody (anti-S). Vaccination was defined as self-report of ≥1 COVID-19 vaccine dose on the donor history questionnaire (Supplementary Table 1). A, Weighted, log-normalized mean S/CO values of anti-S antibodies (with standard deviation) were reported among blood samples from donations in each calendar month of 2021, stratified by previous infection and vaccination status subgroups. B, Weighted, log-normalized median S/CO values of anti-S antibodies (with interquartile range) were reported, stratified by month, previous infection and vaccination subgroup status of blood donors. Abbreviation: CDC, Centers for Disease Control and Prevention.
DISCUSSION
Our findings demonstrate that US population–weighted, estimated seroprevalence from SARS-CoV-2 infection, vaccination, or both increased from 19.8% in January 2021 to 94.5% in December 2021. This study is the first to report national estimates of the proportion of the population with hybrid immunity, which reached 18.9% by December 2021.
We found that the proportion of adult blood donors reporting ≥1 dose of vaccine was approximately 80% by December, similar to CDC vaccination data–derived estimates. Infection-induced seroprevalence estimates derived from blood donors are similar to those among adults reported by a nationwide seroprevalence study using commercial laboratory remnants [1]. This suggests that although blood donors differ from the general population, our donor-derived and weighted seroprevalence estimates might be representative of the adult US population. From June through December 2021, >99% of donors with self-reported vaccination had anti-S antibodies. This suggests that nearly all healthy individuals who qualified as blood donors seroconverted after vaccination; this finding is consistent with findings from vaccine clinical trials and observational studies in immunocompetent populations [21, 22].
The proportions of infection-induced, vaccination-induced, and infection-and-vaccine–induced seroprevalence differed by age, racial-ethnic subgroup, and geographic region. These observations are consistent with findings of prior studies demonstrating differential vaccination coverage and SARS-CoV-2 infections among demographic subgroups [23–27]. Because demographic subgroups with higher estimated vaccine-induced seroprevalence had lower estimated infection-induced seroprevalence, demographic differences in the combined seroprevalence from vaccination, infection, or both, were generally small. We note that some observed temporal patterns coincided with the Delta variant surge and vaccination rollout in the United States. For example, the proportion of younger unvaccinated individuals (aged 16–29 years) with seropositivity from previous infection increased during the last quarter of 2021; incident infections from the Delta variant are a likely explanation, as reported cases were higher among younger than older adults during the Delta surge [1]. Increased proportions of infection among younger adults are potentially related to lower vaccination rates before the Delta surge.
We estimated that nearly 1 in 5 individuals had hybrid immunity, based on vaccination history and serologic evidence of previous infection, by the end of 2021. People with hybrid immunity have been reported to possess more robust immune responses [28], and increased protection from infection and severe disease [29], compared with those with either vaccination or previous infection alone [6, 30]. However, rapid waning of neutralizing antibody and IgG antibody to the S protein has been reported [31]. Studies in the United States and other countries demonstrate substantial numbers of infections in vaccinated persons, and of reinfections, associated with variants of concern, particularly Omicron [32–39].
Given the high seroprevalence among NBDS donors and the limitations of the cross-sectional study design, monthly serosurveillance was discontinued in December 2021 after 18 months of data collection. In the next study phase, we have established a longitudinal cohort study comprised of approximately 142 000 repeat blood donors in the ARC and Vitalant blood collection networks throughout the continental Unites States. SARS-CoV-2 binding antibody assays, including anti-S (IgG; quantitative), anti-N (total Ig), and neutralizing antibody assays, will be performed on serially collected blood specimens donated between July 2020 and December 2022. Donor survey questionnaires will capture detailed histories of COVID-19 vaccination, diagnostic testing, and clinical outcomes. Key study objectives include determining (1) the stability and waning of anti-S, anti-N, and neutralizing antibody among donors who were previously infected, vaccinated, or both; (2) rates of reinfection and of infections in vaccinated persons; and (3) vaccine effectiveness and serologic correlates of protection against Omicron and future variants.
This study has several limitations. First, seroprevalence among blood donors might not represent the seroprevalence in the general population. Second, vaccination history was self-reported at the time of each donation and did not include vaccination details (brands/types, number of doses, or dates received). Third, given the monthly cross-sectional study design of the NBDS, we were unable to determine whether those with hybrid immunity had been infected first and subsequently vaccinated, or vice versa, nor could we determine the precise timing of infection and vaccination. Fourth, anti-S–reactive, anti-N–nonreactive donors may have incorrectly reported no previous COVID-19 vaccination and may have been misclassified as infected. Fifth, the antibody assays used in this study are authorized from the Food and Drug Administration for use as qualitative assays, and quantitative results should be interpreted with caution. However, a strength of the current study is that the antibody assays used are optimal for serosurveillance because they maintain reactivity for more than a year following infection or vaccination, allowing ascertainment of cumulative infection or vaccination-induced humoral immune responses [16, 27].
From evaluation of >1.1 million blood samples, our donor-derived and population-weighted estimates of seroprevalence demonstrate increases in population humoral immunity due to SARS-CoV-2 infection, COVID-19 vaccination, or both during 2021. Percentages of estimated seroprevalence differed by age, race-ethnicity, and geographic region. Seroprevalence studies in representative big data sets like this one, with additional details that can be stratified based on number of vaccination doses and timing of each vaccine dose, are important to consider in future COVID-19 studies and long-term pandemic mitigation efforts, particularly in the context of antibody waning, booster vaccination schedules, and emergent SARS-CoV-2 variants.
Supplementary Data
Supplementary material is available at Clinical Infectious Diseases online.
Notes
Acknowledgments. The authors acknowledge the Nationwide Blood Donor Seroprevalence study team (below); staff at the Centers for Disease Control and Prevention, Vitalant Research Institute, Westat, the American Red Cross, and participating blood collection organizations and testing laboratories; and the blood donors whose samples were analyzed in this study.
The present analysis is part of a larger National Blood Donor Seroprevalence (NBDS) Study, which began in July 2020. Results of the larger study that did not incorporate vaccine history have been previously published, including results through May 2021 [12] and results through December 2021 on a Centers for Disease Control and Prevention website (https://covid.cdc.gov/covid-data-tracker/#nationwide-blood-donor-seroprevalence).
Nationwide Blood Donor Seroprevalence study team. Centers for Disease Control and Prevention (Atlanta, GA): J. M. Jones, M. Miller, B. J. B., T. Benoit, and N. Thornburg. Vitalant Research Institute (San Francisco, CA): M. P. B. and M. Stone. Westat (Rockville, MD): S. M. Mathew, J. D. O., and R.V. F. Blood collection organizations: American Red Cross, (Gaithersburg, MD), S. L. S., E. N., and P. S.; Banco de Sangre de Servicios Mutuos (San Juan, PR), G. Latoni; Blood Bank of Alaska (Anchorage), M. Ritter; Blood Bank of Hawaii (Honolulu), K. Nguyen; Blood Works Northwest (Seattle, WA), M. Destree; Carter BloodCare (Bedford, TX), M. Sayers; Gulf Coast Regional Blood Center (Houston, TX), S. Rossman;
LifeServe (Des Moines, IA), S. Sime; LifeSouth Community Blood Centers (Gainesville, FL), C. Lough; New York Blood Center Enterprise (New York, NY), D. Strauss and D. Kessler; OneBlood (St Petersburg, FL), R Reik and C. Engert; The Blood Center (New Orleans, LA), B. Weales; Vitalant (San Francisco, CA, and Scottsdale, AZ), B. C. and R. Vassallo; and Versiti (Milwaukee, WI), D. Bougie and A. Mast. Testing laboratories: Creative Testing Solutions (Temple, AZ), P. C. W., S. C., and V. G.; Innovative Blood Resources (St Paul, MN), J. Gorlin; Gulf Coast Regional Blood Center (Houston, TX), S. Rossman; Rhode Island Blood Center (Providence), J. Alberigo and D. Strauss; The Blood Center (New Orleans, LA); B. Weales and R. Chatelain; Vitalant Research Institute (San Francisco, CA), C. Di Germanio and G. Simmons. Consultant: S. K., University of British Columbia, Victoria, British Columbia, Canada.
Disclaimer. The findings and conclusions in this report are those of the authors and do not necessarily represent the official position of the Centers for Disease Control and Prevention.
Financial support. This study was supported by the Centers for Disease Control and Prevention (research contract 75D30120C08170).
Supplement sponsorship. This article appears as part of the supplement “Vaccines, Variants, and Vigilance: Strengthening the COVID-19 Public Health Response Through Partnerships and Collaborations,” supported by the Infectious Diseases Society of America through Cooperative Agreement NU50CK000574 with the US Centers for Disease Control and Prevention.
References
Author notes
J. D. O. and J. M. J. contributed equally to this work.
Potential conflicts of interest. M. P. B. reports being an employee of Vitalant Research Institute and receiving grant funding for their institution from Ortho Clinical Diagnostics. E. G. reports research funding to their employer Vitalant Research Institute from Ortho Clinical Diagnostics. They also report the provision of reagents for other studies from Ortho Clinical Diagnostics and Roche. All other authors report no potential conflicts. All authors have submitted the ICMJE Form for Disclosure of Potential Conflicts of Interest. Conflicts that the editors consider relevant to the content of the manuscript have been disclosed.

