


Abstract
Coronavirus disease 2019 (COVID-19) testing policies for symptomatic children attending US schools or daycare vary, and whether isolated symptoms should prompt testing is unclear. We evaluated children presenting for severe acute respiratory syndrome coronavirus 2 (SARS-CoV-2) testing to determine if the likelihood of having a positive SARS-CoV-2 test differed between participants with 1 symptom vs ≥2 symptoms, and to examine the predictive capability of isolated symptoms.
Participants aged <18 years presenting for clinical SARS-CoV-2 molecular testing in 6 sites in urban/suburban/rural Georgia (July–October, 2021; Delta variant predominant) were queried about individual symptoms. Participants were classified into 3 groups: asymptomatic, 1 symptom only, or ≥2 symptoms. SARS-CoV-2 test results and clinical characteristics of the 3 groups were compared. Sensitivity, specificity, positive predictive values (PPVs), and negative predictive values (NPVs) for isolated symptoms were calculated by fitting a saturated Poisson model.
Of 602 participants, 21.8% tested positive and 48.7% had a known or suspected close contact. Children reporting 1 symptom (n = 82; odds ratio [OR], 6.00 [95% confidence interval {CI}, 2.70–13.33]) and children reporting ≥2 symptoms (n = 365; OR, 5.25 [95% CI, 2.66–10.38]) were significantly more likely to have a positive COVID-19 test than asymptomatic children (n = 155), but they were not significantly different from each other (OR, 0.88 [95% CI, .52–1.49]). Sensitivity and PPV were highest for isolated fever (33% and 57%, respectively), cough (25% and 32%), and sore throat (21% and 45%); headache had low sensitivity (8%) but higher PPV (33%). Sensitivity and PPV of isolated congestion/rhinorrhea were 8% and 9%, respectively.
With high Delta variant prevalence, children with isolated symptoms were as likely as those with multiple symptoms to test positive for COVID-19. Isolated fever, cough, sore throat, or headache, but not congestion/rhinorrhea, offered the highest predictive value.
Despite the surge of pediatric severe acute respiratory syndrome coronavirus 2 (SARS-CoV-2) infections due to the Delta variant [1, 2] and the coincident reopening of schools, little detail exists regarding the early symptom profile for children infected with the Delta variant. This lack of information complicates development of school policy regarding which symptoms, either in isolation or in combination, should potentially require exclusion of a newly symptomatic child from school or childcare facilities until SARS-CoV-2 infection has been ruled out by testing. Some policies have specifically stated that children with a single isolated symptom (eg, headache, sore throat, congestion/rhinorrhea, fatigue) can attend school and do not need testing for SARS-CoV-2 infection (see eg, [3–5]). While a recent preprint from the United Kingdom [6] described the most common symptoms observed over the first week of illness in children with the Delta (vs Alpha) variant, the study did not provide information on the prevalence or predictive value of isolated symptoms, nor on the time course of symptoms.
Given that isolated symptoms are relevant for real-time testing decisions made by parents/guardians and school staff, it is important to define the relative pretest probability of having coronavirus disease 2019 (COVID-19) for children with isolated symptoms, allowing testing policy to be refined to avoid either missing cases or unnecessarily excluding children with isolated symptoms from school. In this study, we compared rates of COVID-19 in children presenting for testing in a high-prevalence area during peak circulation of the SARS-CoV-2 Delta variant who reported no symptoms, 1 isolated symptom, or ≥2 symptoms. Additionally, we evaluated the predictive value of each isolated symptom and the impact of age, close contacts, and vaccination status on the likelihood of having COVID-19.
METHODS
Patients aged 0–18 years presenting to 1 of 6 ambulatory testing sites in Georgia (2 urban and 3 suburban sites in the Atlanta area and 1 rural site in Blairsville) of the Atlanta Center of Microsystems Engineered Point-of-Care Technologies, the test verification center of the National Institutes of Health–funded Rapid Acceleration of Diagnostics (RADx) Initiative, between 4 July and 15 October 2021, were prospectively enrolled following informed consent and assent (as applicable per age) and participated in the following procedures: clinical nasopharyngeal polymerase chain reaction (PCR) testing for SARS-CoV-2, detailed review of symptoms present at the time of clinical testing and overall symptom duration, and collection of additional samples for future research testing under the RADx program [7, 8]. All RADx testing sites are open to all pediatric patients and are located throughout the surrounding area as drive-through or walk-up sites (typically embedded in an existing clinical infrastructure, eg, ambulatory urgent care clinic). There were no costs to the participants for SARS-CoV-2 testing, and all clinical test results were provided to the parents/guardians. The study time window was set to allow focus on the SARS-CoV-2 Delta variant: as of the week of 4 July 2021, the Delta variant comprised 78% of available sequences in US Department of Health and Human Services Region 4 (which includes Georgia) based on the Centers for Disease Control and Prevention (CDC) SARS-CoV-2 variant surveillance program [9]. In this same study period, the prevalence of COVID-19 in the Georgia pediatric population was 15.4% [10]. Participants and their families were asked about the presence or absence of each of the following symptoms: fever (either subjective or temperature >38.0°C [>100.4°F] was accepted), chills, congestion/rhinorrhea, cough, headache, sore throat, fatigue, arthralgias, myalgias, photophobia, vomiting, nausea, diarrhea, abdominal pain, loss of sense of taste or smell, shortness of breath, or any other symptoms. Participants were categorized as being asymptomatic, reporting 1 symptom, or reporting ≥2 symptoms. Vaccination status and any known or suspected recent close contact were ascertained. This study was approved by the institutional review boards (IRBs) at Emory University (STUDY00000932) and Children’s Healthcare of Atlanta (IRB number 00001082).
Statistical Analysis
Categorical data are displayed as number (%), and continuous variables are displayed as median (interquartile range [IQR]). To statistically compare categorical variables, χ2 or Fisher test was used. Continuous variables were compared by Wilcoxon rank-sum test. Odds ratios (ORs) and corresponding 95% confidence intervals (CIs) were calculated using the LOGISTIC procedure. ORs were also adjusted for exposure/vaccination status to address potential confounding. Diagnostic accuracy measures such as sensitivity, specificity, positive predictive value (PPV), and negative predictive value (NPV) were calculated using the NLMIXED procedure and a saturated Poisson model. Sensitivity analyses were conducted removing participants who had a fever or who were vaccinated. Furthermore, positivity rates among symptom groups were stratified by exposure status. All analyses were conducted using SAS version 9.4 software (SAS Institute, Cary, North Carolina). Graphs were created with RStudio (Boston, Massachusetts) and the ggplot2 package (Wickham, 2016 [11]).
RESULTS
Six hundred two pediatric patients (median age, 9 years [IQR, 5–13 years]) were included in this analysis, including 155 asymptomatic children (25.2% previously vaccinated), 82 children who reported 1 symptom at the time of testing (13.4% previously vaccinated), and 365 who reported ≥2 symptoms at the time of testing (9.0% previously vaccinated) (Table 1). There were no significant differences between these 3 groups in terms of age, sex, race, or ethnicity. In those with only 1 symptom at presentation (n = 82), congestion/rhinorrhea was the most frequently reported symptom (26.8%), followed by cough (23.2%), fever (17.1%), sore throat (13.4%), and headache (7.3%). The group with 1 symptom and the group with ≥2 symptoms had equal median duration of symptoms at the time of testing (2 days [IQR, 1–4 days]). Overall, 48.7% of participants had a known and/or suspected close contact with COVID-19. Those with 1 symptom had a significantly higher proportion of exposure to a known and/or suspected contact with COVID-19 than those with ≥2 symptoms (57.3% vs 44.4%, P = .04; Table 1); however, those with 1 symptom and those with no symptoms had a similar proportion of exposure (57.3% vs 54.2%, P = .65).
Participant Characteristics at Time of Enrollment in the Rapid Acceleration of Diagnostics Initiative (RADx) Between 4 July and 15 October 2021
| Level | Overall (N = 602) | Asymptomatic (n = 155) | 1 Symptom (n = 82) | ≥2 Symptoms (n = 365) | P Valuea |
|---|---|---|---|---|---|
| Enrollment location | |||||
| Blairsvilleb | 130 (21.6) | 40 (25.8) | 17 (20.7) | 73 (20.0) | .003 |
| Hospital (Egleston)c | 63 (10.5) | 1 (0.7) | 10 (12.2) | 52 (14.3) | |
| Urgent care (Satellite Boulevard)d | 175 (29.1) | 12 (7.7) | 18 (22.0) | 145 (39.7) | |
| Urgent care (Town Center)d | 61 (10.1) | 5 (3.2) | 12 (14.6) | 44 (12.1) | |
| Viral Solutions (Atlanta Public Schools)e | 15 (2.5) | 3 (1.9) | 3 (3.7) | 9 (2.5) | |
| Viral Solutions (Decatur)f | 158 (26.3) | 94 (60.7) | 22 (26.8) | 42 (11.5) | |
| Age, y | |||||
| Median (IQR) | 9.0 (5.0–13.0) | 10.0 (7.0–14.0) | 9.0 (6.0–13.0) | 9.0 (5.0–12.0) | .50 |
| ≤4 | 112 (18.6) | 21 (13.5) | 16 (19.5) | 75 (20.6) | .75 |
| 5–10 | 241 (40.0) | 58 (37.4) | 35 (42.7) | 148 (40.6) | |
| 11–13 | 111 (18.4) | 35 (22.6) | 11 (13.4) | 65 (17.8) | |
| 14–18 | 138 (22.9) | 41 (26.5) | 20 (24.4) | 77 (21.1) | |
| Sex | |||||
| Female | 284 (47.2) | 78 (50.3) | 35 (42.7) | 171 (46.9) | .49 |
| Male | 318 (52.8) | 77 (49.7) | 47 (57.3) | 194 (53.2) | |
| Race | |||||
| Asian | 14 (2.3) | 3 (1.9) | 5 (6.1) | 6 (1.6) | .11 |
| Black/African American | 193 (32.1) | 28 (18.1) | 28 (34.2) | 137 (37.5) | |
| Other | 60 (10.0) | 13 (8.4) | 6 (7.3) | 41 (11.2) | |
| White | 324 (53.8) | 110 (71.0) | 40 (48.8) | 174 (47.7) | |
| Declined to answer/missing | 11 (1.8) | 1 (0.7) | 3 (3.7) | 7 (1.9) | |
| Ethnicity | |||||
| Hispanic | 81 (13.5) | 13 (8.4) | 12 (14.6) | 56 (15.3) | .62 |
| Non-Hispanic | 515 (85.5) | 139 (89.7) | 69 (84.2) | 307 (84.1) | |
| Declined to answer/missing | 6 (1.0) | 3 (1.9) | 1 (1.2) | 2 (0.6) | |
| Symptoms | |||||
| Fever | 221 (36.7) | 0 (0.0) | 14 (17.1) | 207 (56.7) | <.001 |
| Chills | 44 (7.3) | 0 (0.0) | 0 (0.0) | 44 (12.1) | <.001 |
| Congestion/rhinorrhea | 279 (46.4) | 0 (0.0) | 22 (26.8) | 257 (70.4) | <.001 |
| Cough | 270 (44.9) | 0 (0.0) | 19 (23.2) | 251 (68.8) | <.001 |
| Headache | 130 (21.6) | 0 (0.0) | 6 (7.3) | 124 (34) | <.001 |
| Sore throat | 162 (26.9) | 0 (0.0) | 11 (13.4) | 151 (41.4) | <.001 |
| Fatigue | 49 (8.1) | 0 (0.0) | 0 (0.0) | 49 (13.4) | <.001 |
| Arthralgias | 4 (0.7) | 0 (0.0) | 0 (0.0) | 4 (1.1) | 1.00 |
| Myalgias | 27 (4.5) | 0 (0.0) | 0 (0.0) | 27 (7.4) | .01 |
| Photophobia | 2 (0.3) | 0 (0.0) | 0 (0.0) | 2 (0.5) | 1.00 |
| Vomiting | 47 (7.8) | 0 (0.0) | 3 (3.7) | 44 (12.1) | .03 |
| Nausea | 33 (5.5) | 0 (0.0) | 0 (0.0) | 33 (9) | .005 |
| Diarrhea | 40 (6.6) | 0 (0.0) | 3 (3.7) | 37 (10.1) | .06 |
| Abdominal pain | 42 (7.0) | 0 (0.0) | 3 (3.7) | 39 (10.7) | .049 |
| Loss of sense of taste or smell | 22 (3.7) | 0 (0.0) | 1 (1.2) | 21 (5.8) | .10 |
| Shortness of breath | 16 (2.7) | 0 (0.0) | 0 (0.0) | 16 (4.4) | .05 |
| Other symptom(s) | 15 (2.5) | 0 (0.0) | 0 (0.0) | 14 (3.8) | .08 |
| Duration of symptoms at time of test, d, median (IQR) | 2.0 (1.0–4.0)g | … | 2.0 (1.0–4.0) | 2.0 (1.0–4.0) | .17 |
| Received COVID-19 vaccine | |||||
| Don’t know | 4 (0.7) | 1 (0.7) | 0 (0.0) | 3 (0.8) | .36 |
| No | 514 (85.4) | 114 (73.6) | 71 (86.6) | 329 (90.1) | |
| Yes | 83 (13.8) | 39 (25.2) | 11 (13.4) | 33 (9.0) | |
| Missing | 1 (0.2) | 1 (0.7) | 0 (0.0) | 0 (0.0) | |
| Exposure status | |||||
| Known contact | 238 (39.5) | 68 (43.9) | 40 (48.8) | 130 (35.6) | .08 |
| Suspected contact only | 55 (9.1) | 16 (8.5) | 7 (8.5) | 32 (8.8) | |
| Neither known nor suspected contacts | 309 (51.3) | 71 (45.8) | 35 (42.7) | 203 (55.6) | |
| Exposure status | |||||
| Known or suspected contact | 293 (48.7) | 84 (54.2) | 47 (57.3) | 162 (44.4) | .04 |
| No known or suspected contact | 309 (51.3) | 71 (45.8) | 35 (42.7) | 203 (55.6) |
Data are presented as No. (%) unless otherwise indicated.
Abbreviations: COVID-19, coronavirus disease 2019; IQR, interquartile range.
P values are for the statistical comparison between groups with 1 symptom and ≥2 symptoms.
Rural, outdoor testing event.
Urban, city of Atlanta emergency department.
Suburban, urgent care clinic.
Urban, dedicated testing site.
Suburban, dedicated testing site.
Those with no symptoms were excluded from this calculation.
Of the 602 patients, 21.8% tested positive by PCR (6.5% of asymptomatic children, 29.3% of children with only 1 symptom, and 26.6% of children with ≥2 symptoms; Table 2). Children with only 1 symptom were 6.00 (95% CI, 2.70–13.33) times as likely to test positive for COVID-19 as children with no symptoms. Children with ≥2 symptoms were 5.25 (95% CI, 2.66–10.38) times as likely to test positive for COVID-19 as children with no symptoms. Interestingly, children with ≥2 symptoms were not statistically more likely to test positive for COVID-19 compared to children with only 1 symptom (OR, 0.88 [95% CI, .52–1.49]), indicating that the likelihood of having COVID-19 was not dependent on the number of symptoms, but rather that a symptom was present (Table 3). These findings remained true when children with fever (Table 2), vaccinated children (Supplementary Table 1), or those with both fever/vaccination (Supplementary Table 1) were excluded from analysis. Additionally, these findings remained consistent after controlling for exposure status (Tables 3 and 4). Holding known or suspected exposure status constant, those with 1 symptom (OR, 6.20 [95% CI, 2.76–13.97]) and those with ≥2 symptoms (OR, 6.29 [95% CI, 3.14–12.60]) had significantly higher odds of having a positive COVID-19 test compared to those with no symptoms, but these groups did not significantly differ from each other (OR, 1.02 [95% CI, .59–1.76]) (Tables 3 and 4). These findings remained true when vaccinated children were excluded (Supplementary Table 2).
Percentage of Children Who Tested Positive, by Symptom Status
| Symptom Status | All Participants | Excluding Participants With Fever | ||
|---|---|---|---|---|
| Total Participants, No. | Participants Who Tested Positive, No. (%) | Total Participants, No. | Participants Who Tested Positive, No. (%) | |
| 0 symptoms | 155 | 10 (6.5) | 155 | 10 (6.5) |
| 1 symptom | 82 | 24 (29.3) | 68 | 16 (23.5) |
| ≥2 symptoms | 365 | 97 (26.6) | 158 | 30 (19.0) |
| Vaccinated Participants | Vaccinated Participants Without Fever | |||
| 0 symptoms | 39 | 0 (0.0) | 39 | 0 (0.0) |
| 1 symptom | 11 | 1 (9.1) | 10 | 1 (10.0) |
| ≥2 symptoms | 33 | 3 (9.1) | 21 | 1 (4.8) |
Logistic Regression Analysis Modeling Association Between Number of Symptoms and Coronavirus Disease 2019 Test Positivity in the Overall Population and by Age Group
| Age Group | ||||||||||
|---|---|---|---|---|---|---|---|---|---|---|
| Overall (N = 602) | Infant and Early Childhood (≤4 y) (n = 112) | Elementary School (5–10 y) (n = 241) | Middle School (11–13 y) (n = 111) | High School (≥14 y) (n = 138) | ||||||
| Analysis | OR (95% CI) | P Value | OR (95% CI) | P Value | OR (95% CI) | P Value | OR (95% CI) | P Value | OR (95% CI) | P Value |
| Unadjusted ORs | ||||||||||
| 1 vs 0 symptoms | 6.00 (2.70–13.33) | <.001 | 4.32 (.71–26.13) | .11 | 3.97 (1.31–12.01) | .01 | 19.43 (1.88–201.17) | .01 | 10.00 (1.04–96.47) | .047 |
| ≥2 vs 0 symptoms | 5.25 (2.66–10.38) | <.001 | 1.63 (.33–8.02) | .55 | 2.20 (.87–5.61) | .10 | 21.25 (2.74–165.13) | .004 | 26.96 (3.52–206.45) | .002 |
| ≥2 vs 1 symptom | 0.88 (.52–1.49) | .62 | 0.38 (.11–1.30) | .12 | 0.56 (.25–1.26) | .16 | 1.09 (.29–4.12) | .89 | 2.70 (.82–8.83) | .10 |
| ORs adjusted for exposure status (known and/or suspected contact vs no contact) | ||||||||||
| 1 vs 0 symptoms | 6.20 (2.76–13.97) | <.001 | 6.01 (.87–41.37) | .07 | 4.23 (1.37–13.09) | .01 | 16.39 (1.56–172.45) | .02 | 10.47 (1.08–101.88) | .04 |
| ≥2 vs 0 symptoms | 6.29 (3.14–12.60) | <.001 | 3.13 (.59–16.66) | .18 | 2.65 (1.02–6.90) | .046 | 20.54 (2.63–160.45) | .004 | 29.66 (3.83–229.51) | .001 |
| ≥2 vs 1 symptom | 1.02 (.59–1.76) | .96 | 0.52 (.13–2.12) | .36 | 0.63 (.27–1.46) | .28 | 1.25 (.32–2.85) | .74 | 2.83 (.85–9.43) | .09 |
| ORs adjusted for vaccination status (received vaccine vs did not receive vaccine) | ||||||||||
| 1 vs 0 symptoms | 5.49 (2.45–12.29) | <.001 | 4.32 (.71–26.13) | .11 | 3.90 (1.29–11.78) | .02 | 14.92 (1.39–160.59) | .03 | 9.83 (.97–100.19) | .05 |
| ≥2 vs 0 symptoms | 4.55 (2.29–9.05) | <.001 | 1.63 (.33–8.02) | .55 | 2.16 (.85–5.51) | .11 | 15.00 (1.89–119.17) | .01 | 24.37 (3.09–192.48) | .003 |
| ≥2 vs 1 symptom | 0.83 (.48–1.42) | .49 | 0.38 (.11–1.30) | .12 | 0.56 (.25–1.26) | .16 | 1.01 (.25–3.98) | .99 | 2.48 (.69–8.88) | .16 |
Abbreviations: CI, confidence interval; OR, odds ratio.
Percentage of Children Who Had a Known or Suspected Close Contact and Who Tested Positive, by Symptom Status
| Symptom Status | Total Participants, No. | Participants Who Had a Known or Suspected Close Contact, No. (%) | Test-Positive Rate, % in Participants With a Known or Suspected Close Contact (%) | Participants Who Did Not Have a Known or Suspected Close Contact, No. (%) | Test-Positive Rate, % in Participants With No Known or Suspected Close Contact (%) |
|---|---|---|---|---|---|
| All participants | |||||
| 0 symptoms | 155 | 84 (54.2) | 9 (10.0) | 71 (45.8) | 1 (1.4) |
| 1 symptom | 82 | 47 (57.3) | 20 (42.6) | 35 (42.7) | 4 (11.4) |
| ≥2 symptoms | 365 | 162 (44.4) | 61 (37.7) | 203 (55.6) | 36 (17.7) |
When the cohort was broken down into 4 age groups that roughly mirror K-12 school organization (infant and early childhood, age ≤4 years; elementary, age 5–10 years; middle school, age 11–13 years; high school, age 14–18 years), similar overall findings were observed for children of school age (Tables 3 and 5). Elementary, middle, and high school–aged children with only 1 symptom were 3.97 (95% CI, 1.31–12.01), 19.43 (95% CI, 1.88–201.17), and 10.00 (95% CI, 1.04–96.47) times as likely, respectively, to test positive for COVID-19 as children with no symptoms. Elementary, middle, and high school–aged children with ≥2 symptoms were 2.20 (95% CI, .87–5.61), 21.25 (95% CI, 2.74–165.13), and 26.96 (95% CI, 3.52–206.45) times as likely, respectively, to test positive for COVID-19 than children with no symptoms, though this difference was not significant in elementary school–aged children. Finally, elementary, middle, and high school–aged children with ≥2 symptoms were not more likely to test positive for COVID-19 compared to children with only 1 symptom (elementary school: OR, 0.56 [95% CI, .25–1.26]; middle school: OR, 1.09 [95% CI, .29–4.12]; high school: OR, 2.70 [95% CI, .82–8.83]), indicating that likelihood of having COVID-19 was dependent only on the presence of a symptom, not on the number of symptoms present. Unlike school-aged children, infant and early childhood–aged children with 1 symptom (OR, 4.32 [95% CI, .71–26.13]) or ≥2 symptoms (OR, 1.63 [95% CI, .33–8.02]) were not more likely to test positive for COVID-19 than children with no symptoms, though as in the older children the likelihood of having COVID-19 did not differ between those with 1 or ≥2 symptoms (OR, 0.38 [95% CI, .11–1.30]). These patterns remained similar when those who presented with fever were excluded (Table 5) and after adjustment for exposure status and for vaccination status (Table 3).
Percentage of Children Who Tested Positive, by Age Group and Symptom Status
| Age Group and Symptom Status | All Participants | Excluding Participants With Fever | ||
|---|---|---|---|---|
| Total Participants, No. | Participants Who Tested Positive, No. (%) | Total Participants, No. | Participants Who Tested Positive, No. (%) | |
| Infant and early childhood (≤4 y) (n = 112 in total, n = 57 excluding fever) | ||||
| 0 symptoms | 21 | 2 (9.5) | 21 | 2 (9.5) |
| 1 symptom | 16 | 5 (31.3) | 11 | 2 (18.2) |
| ≥2 symptoms | 75 | 11 (14.7) | 25 | 3 (12.0) |
| Elementary school–aged children (5–10 y) (n = 241 in total, n = 144 excluding fever) | ||||
| 0 symptoms | 58 | 6 (10.3) | 58 | 6 (10.3) |
| 1 symptom | 35 | 11 (31.4) | 28 | 7 (25.0) |
| ≥2 symptoms | 148 | 30 (20.3) | 58 | 7 (12.1) |
| Middle school–aged children (11–13 y) (n = 111 in total, n = 77 excluding fever) | ||||
| 0 symptoms | 35 | 1 (2.9) | 35 | 1 (2.9) |
| 1 symptom | 11 | 4 (36.4) | 10 | 4 (40.0) |
| ≥2 symptoms | 65 | 25 (38.5) | 32 | 9 (28.1) |
| High school–aged children (≥14 y) (n = 138 in total, n = 103 excluding fever) | ||||
| 0 symptoms | 41 | 1 (2.4) | 41 | 1 (2.4) |
| 1 symptom | 20 | 4 (20.0) | 19 | 3 (15.8) |
| ≥2 symptoms | 77 | 31 (40.3) | 43 | 11 (25.6) |
Analysis of the sensitivity, specificity, PPVs, and NPVs of isolated symptoms in this cohort is presented in Table 6. Notably, the PPVs of isolated sore throat (45%), headache (33%), and cough (32%) were not far below the PPV of fever (57%); in contrast, the PPV of isolated congestion/rhinorrhea was 9%. The isolated symptoms with the highest sensitivity were fever (33%), cough (25%), and sore throat (21%); congestion/rhinorrhea and headache each had a sensitivity of 8%. Children who had congestion/rhinorrhea only (OR, 2.47 [95% CI, .56–10.84]) were not more likely to have a positive COVID-19 result than children who did not have congestion/rhinorrhea. The same patterns remained true when vaccinated children were excluded (Supplementary Table 3).
Diagnostic Accuracy of Isolated Symptoms in Children Who Presented With 1 Symptom
| Symptom | Overall (n = 82) | Negative (n = 58) | Positive (n = 24) | Sensitivity | Specificity | PPV | NPV |
|---|---|---|---|---|---|---|---|
| Fever | 14 | 6 | 8 | 0.33 (.14–.52) | 0.90 (.82–.97) | 0.57 (.31–.83) | 0.76 (.66–.87) |
| Chills | 0 | 0 | 0 | NA | NA | NA | NA |
| Congestion/rhinorrhea | 22 | 20 | 2 | 0.08 (.00–.19) | 0.66 (.53–.78) | 0.09 (.00–.21) | 0.63 (.51–.76) |
| Cough | 19 | 13 | 6 | 0.25 (.08–.42) | 0.78 (.67–.88) | 0.32 (.11–.53) | 0.71 (.60–.83) |
| Headache | 6 | 4 | 2 | 0.08 (.00–.19) | 0.93 (.87–1.00) | 0.33 (.00–.71) | 0.71 (.61–.81) |
| Sore throat | 11 | 6 | 5 | 0.21 (.05–.37) | 0.90 (.82–.97) | 0.45 (.16–.75) | 0.73 (.63–.84) |
| Fatigue | 0 | 0 | 0 | NA | NA | NA | NA |
| Arthralgias | 0 | 0 | 0 | NA | NA | NA | NA |
| Myalgias | 0 | 0 | 0 | NA | NA | NA | NA |
| Photophobia | 0 | 0 | 0 | NA | NA | NA | NA |
| Vomiting | 3 | 3 | 0 | 0.00 (.00–.00) | 0.95 (.89–1.00) | 0.00 (.00–.00) | 0.70 (.60–0.80) |
| Nausea | 0 | 0 | 0 | NA | NA | NA | NA |
| Diarrhea | 3 | 3 | 0 | 0.00 (.00–.00) | 0.95 (.89–1.00) | 0.00 (.00–.00) | 0.70 (.60–.80) |
| Abdominal pain | 3 | 3 | 0 | 0.00 (.00–.00) | 0.95 (.89–1.00) | 0.00 (.00–.00) | 0.70 (.60–.80) |
| Loss of sense of taste or smell | 1 | 0 | 1 | 0.04 (.00–.12) | 1.00 (1.00–1.00) | 1.00 (1.00–1.00) | 0.72 (.62–.81) |
| Shortness of breath | 0 | 0 | 0 | NA | NA | NA | NA |
Data in parentheses are presented as 95% confidence intervals.
Abbreviations: NA, not applicable; NPV, negative predictive value; PPV, positive predictive value.
Figure 1 shows variation of PPVs with variation in community COVID-19 prevalence rates (ranging from 0 to 30%, as an estimate of peak positivity in the United States [12]) for the isolated symptoms of congestion/rhinorrhea, cough, fever, headache, and sore throat. The overall prevalence in our cohort (21.8%) is marked. As expected, lower disease prevalence confers lower PPV for each isolated symptom, such that the most prevalent isolated symptoms do not ultimately offer high predictive capabilities. Finally, we assessed the impact of excluding children with isolated symptoms from testing altogether. If all children with only 1 symptom were not tested, approximately 183.2 cases per 1000 cases (18.3%) would have been missed; excluding only those with isolated congestion/rhinorrhea would have missed 15.3 cases per 1000 cases (1.5%). In children with no known or suspected exposure, if all children with isolated symptoms were not tested, 97.6 cases per 1000 cases (9.8%) would have been missed; excluding only those with isolated congestion/rhinorrhea would have missed 24.3 cases per 1000 cases (2.4%).
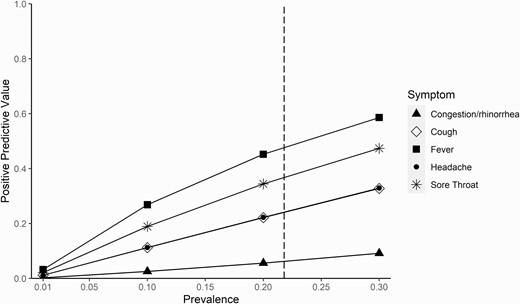
Positive predictive value of isolated symptoms across varying prevalence points. This figure demonstrates the increasing positive predictive value of selected isolated symptoms across a range of prevalence points from 0% to 30%. The vertical dashed line represents the prevalence in our study cohort (21.8%).
DISCUSSION
In a population of children receiving ambulatory testing in an area with high community prevalence of the SARS-CoV-2 Delta variant and high rates of known or suspected contact with a COVID-19 case, children presenting with 1 reported symptom at the time of testing were as likely as those reporting ≥2 symptoms to test positive for SARS-CoV-2 infection, and significantly more likely than asymptomatic children to test positive. These findings remained consistent with exclusion of children with fever or vaccination and after controlling for known/suspected close contacts or vaccination status in sensitivity analyses, and were true for all 3 school-aged groups (5–10, 11–13, and ≥14 years).
The PPVs of isolated sore throat (45%), headache (33%), and cough (32%) were not far below the PPV of fever (57%), while the PPV of isolated congestion/rhinorrhea was only 9%. The same pattern remained true when vaccinated children were excluded. This finding would suggest that isolated sore throat, headache, and cough may need to be considered as grounds for school exclusion and COVID-19 testing prior to return to school when community rates of COVID-19 are high. This approach would be consistent with some published recommendations: K-12 school guidance from the CDC [13] provides a list of symptoms potentially consistent with COVID-19 for which caregivers should monitor (fever; sore throat; cough; difficulty breathing; diarrhea or vomiting; or new onset of severe headache), and states that any symptom on that list should prompt testing for COVID-19. The American Academy of Pediatrics [14] provides a list of symptoms consistent with COVID-19 (fever or chills; cough; congestion or runny nose; loss of taste or smell; shortness of breath or difficulty breathing; body aches; fatigue or headache; sore throat; nausea, vomiting, or diarrhea), with the guidance that “any of the following” might be an indication for testing. However, in contrast, multiple school guidelines (including broad recommendations for K-12 schools in Massachusetts, Georgia, and California, as examples) recommend that isolated symptoms such as sore throat, headache, fatigue, or rhinorrhea/congestion should not prompt testing, requiring testing only if these symptoms are present in combination with other symptoms [3–5]. Having a better understanding of the predictive value of isolated symptoms for having COVID-19 can help parents and caregivers, school nurses and administrators, and pediatricians to navigate testing decisions. Moreover, identifying high-likelihood symptoms could potentially aid in minimizing school-related cases and quarantines, as well as exposures of students who might be medically fragile.
This appears to be one of the first analyses of isolated symptoms present in children at the time of the actual SARS-CoV-2 test. Molteni et al [6] evaluated cumulative symptoms present over the entire duration of illness (potentially including after the actual testing was performed); a previous symptom study from the same team used a similar approach [15]. The most similar analysis in the Molteni et al study [6] assessed symptom burden over the first week (<7 days) of illness and found that the most common symptoms in young children (5–11 years) with the Delta variant were headache (61%), rhinorrhea (54%), and fatigue (49%); in older children (12–17 years), the most common symptoms were headache (74%), sore throat (61%), and fatigue (60%). Notably, these symptoms and frequencies were very similar to those observed with the Alpha variant, though this does not guarantee similarity of symptom profiles with new/future variants (eg, Omicron). These symptoms mirror our own findings in terms of the most frequently observed symptoms in our study population, suggesting that the symptom presentations in our study cohort were generalizable. However, Molteni and colleagues’ reporting of total symptom burden (number) over the first week of illness (median of 4 symptoms in younger children and 6 in older children) still leaves an open question about symptoms observed earliest in the disease course. We note that in our cohort, the median duration of symptoms at the time of testing was 2 days (IQR, 1–4 days) in both children with isolated symptoms and those with ≥2 symptoms, suggesting that our findings are likely to apply to children with new onset of isolated symptoms.
Taken together, our data and the Molteni et al data [6] suggest that while most children with SARS-CoV-2 ultimately will have multiple symptoms, children with new-onset isolated symptoms may need testing for SARS-CoV-2 before returning to school or childcare. Our findings would suggest that isolated symptoms to be prioritized for testing include sore throat, headache, and cough, in addition to fever (and the highly specific symptom of loss of taste and smell; we did not have sufficient data on isolated myalgias, arthralgias, fatigue, or abdominal symptoms to draw any conclusions). We note that headache had relatively high PPV but low sensitivity, and this symptom should be evaluated in a larger cohort. Given that these symptoms could also be consistent with other respiratory virus infections and strep throat, our findings in turn mean that greater access to high-sensitivity, expedited testing for these children would need to be made available to quickly exclude SARS-CoV-2 and minimize the time out of school. Congestion/rhinorrhea had lower predictive value in our study, despite its high prevalence (potential contributions to prevalence of this symptom could include other circulating viruses [eg, rhinovirus] or allergic rhinitis with elevated pollen counts during the study period). Decisions about school testing policy must take testing access and loss of educational continuity into account; given the low predictive value (even in this high SARS-CoV-2 prevalence cohort) and the high frequency with which isolated congestion/rhinorrhea occurs in school-aged children, it may not be optimal to require school exclusion and testing for those with isolated congestion/rhinorrhea. This conclusion is reinforced by our estimates that only a relatively small number of cases would be missed if isolated rhinorrhea/congestion did not prompt testing.
Strengths of our study include that we prospectively collected detailed symptom data at the time of testing by interview of the patient and their family (rather than being reported virtually/on an app before or after testing as in prior studies [6, 15]), making our data relevant to real-time decision making. There were no specific symptom criteria required for testing at the study sites, allowing a relatively unbiased assessment of symptom profiles (though this does not account for testing policies that may have directed patients and families to come in for testing). Limitations include that the study was relatively small, limiting numbers for each individual isolated symptom and for subgroup analysis, and we did not have information on the severity of each symptom nor on reasons for testing in asymptomatic children (though we did know which children were exposed). Given the lower prevalence of COVID-19 and small sample size in the subgroup of children ≤4 years old, we had reduced power to detect significant differences in this age group compared to the other age groups. This age group merits a dedicated larger study. We did not include data on cycle threshold values or viral loads in the positive samples, both due to missing data and because many different PCR assays were used for clinical testing, which would have made these data difficult to combine for analysis. We did not do sequencing to confirm that the Delta variant strain was responsible for the SARS-CoV-2 infections in these children, but the time window selected is consistent with the majority having been due to this variant [9] (prior studies similarly used time windows as a proxy for variant circulation [6]). We had too few vaccinated children in this study to draw conclusions about symptom presentation in this subgroup of children (prior studies similarly included predominantly unvaccinated children [6]). The study was performed in a region with high prevalence of the Delta variant and in a population with a high proportion of known or suspected close contact, with variable local testing requirements and testing availabilities, so the population that presented for testing may not be fully generalizable to other settings (including settings with lower disease/exposure prevalence or other circulating variants). Though the high exposure rates might suggest that some patients presented for testing due to exposure rather than isolated symptoms, symptom status was associated with having a positive COVID-19 test independent of exposure status. We also note that the observed prevalence in this study cohort was similar to overall school-aged prevalence in Georgia during the study time period, per the Georgia Department of Public Health (15.4% [10]). Finally, we recognize that local circulation of other respiratory viruses would also impact SARS-CoV-2 test positivity rates and predictive values of symptoms.
In summary, our findings demonstrate that in a setting with high community prevalence of the SARS-CoV-2 Delta variant, children with isolated symptoms were as likely to have COVID-19 as children with multiple symptoms. The symptoms with highest predictive value were sore throat, cough, headache, and fever; isolated congestion/rhinorrhea had high prevalence but lower predictive value. Although further research is needed to understand the extent to which these findings can be generalized to other settings and variants, these results suggest that school and daycare policies should consider isolated symptoms as potential triggers for exclusion and testing.
Supplementary Data
Supplementary materials are available at Clinical Infectious Diseases online. Consisting of data provided by the authors to benefit the reader, the posted materials are not copyedited and are the sole responsibility of the authors, so questions or comments should be addressed to the corresponding author.
Notes
Author Contributions. A. L. W. and N. R. P. conceived and designed the analysis. C. L. S., L. B., N. Y. K., J. S., C. A. R., J. K. F., M. A. G., J. M. L., J. W., M. B. V., C. R. M., G. S. M., and W. L. contributed to Rapid Acceleration of Diagnostics Initiative (RADx) study design and implementation, including patient enrollment and data collection. A. L. W., A. W., and N. R. P. analyzed and interpreted the data. A. L. W. and N. R. P. drafted the manuscript. Critical revisions to the manuscript were made by all members of the study group. All authors had full access to all the data in the study and had final responsibility for the decision to submit for publication.
Acknowledgments. The authors thank Drs. Andrea Ciaranello and Sandra Nelson for their feedback on an early version of the manuscript. The authors also thank Robert Jerris, PhD, Mark Gonzalez, PhD, Beverly Rogers, MD, and Yun F. (Wayne) Wang, PhD, and their laboratory staff at Children’s Healthcare of Atlanta and Grady Memorial Hospital, for their contributions to clinical testing for severe acute respiratory syndrome coronavirus 2 (SARS-CoV-2).
Financial support. Patient enrollment and testing under the RADx study was funded by the National Institutes of Health (NIH) (grant numbers U54 EB027690 02S1, U54 EB027690 03S1, U54 EB027690 03S2, and UL1 TR002378).
References
Author notes
Potential conflicts of interest. C. A. R.’s institution has received funds to conduct clinical research unrelated to this manuscript from BioFire, GSK, MedImmune, Micron, Janssen, Merck, Moderna, Novavax, PaxVax, Pfizer, Regeneron, and Sanofi-Pasteur. She is coinventor of patented respiratory syncytial virus vaccine technology unrelated to this manuscript, which has been licensed to Meissa Vaccines, and has received royalties; and is named in the following patents: “Chimeric RSV, immunogenic compositions, and methods of use,” International PCT application number PCT/US2016/058976, filed 28 December 2016 by Emory University, and “Osteopontin as a biomarker of COVID-19 and MIS-C disease,” US patent application number 63/229,718, filed 5 August 2021 by Emory University. J. M. L. has received speaker honorarium from the American College of Allergy, Asthma, and Immunology and has served on advisory boards for GlaxoSmithKline and Regeneron. G. S. M. reports payments to Emory University from the National Institute of Biomedical Imaging and Bioengineering, NIH (U54-027690), outside the submitted work. N. R. P. has served as a subject matter expert for the Massachusetts Department of Public Health on evaluation and implementation of testing for SARS-CoV-2 infection. All other authors report no potential conflicts.
All authors have submitted the ICMJE Form for Disclosure of Potential Conflicts of Interest. Conflicts that the editors consider relevant to the content of the manuscript have been disclosed.

