


Abstract
Daily dosing of tenofovir disoproxil fumarate, with or without emtricitabine, has high efficacy in preventing human immunodeficiency virus (HIV) infection when individuals are adherent. The target protective plasma concentration of tenofovir (TFV), however, is not fully understood. The aim of this study is to estimate the protective TFV plasma concentration.
Participant data from TFV-based daily oral and topical active arms of phase 3 trials (iPrEx, VOICE, and Partners PrEP) were pooled (n = 2950). Individual specific risk scores (low and high risk) of acquiring HIV, based on an earlier placebo analysis, were created. Longitudinal TFV pharmacokinetics (PK), HIV outcome, individual risk scores and the effect of sex at birth data were integrated and analyzed using non-linear mixed effects models.
Around 50% of the individuals were estimated to be adherent, which differed from self-reported adherence (∼90%) and large variation between longitudinal adherence patterns were identified. Following oral administration, the estimated protective TFV trough concentration was substantially higher in high-risk females (45.8 ng/mL) compared with high-risk males (16.1 ng/mL) and to low-risk individuals (∼7.5 ng/mL). Dosing simulations indicated that high-risk women require full adherence to maintain protective levels.
Using the largest PK-HIV outcome database to date, we developed a population adherence-PK-risk-outcome model. Our results indicate that high-risk females need higher levels of plasma TFV to achieve HIV protection compared with males. HIV protection exceeds 90% in all populations if daily adherence is achieved.
Human immunodeficiency virus (HIV) infection continues to be a major global health issue with 1.5 million people becoming newly infected every year [1]. Preexposure prophylaxis (PrEP) using tenofovir (TFV), formulated as tenofovir disoproxil fumarate (TDF) with and without emtricitabine (FTC), has been evaluated in several randomized controlled trials in high-risk populations [2–8]. PrEP efficacy results have varied among the trials; the highest efficacy results have been in heterosexual serodiscordant couples (75%) and high-risk heterosexual men and women (62%) compared with placebo [4, 5]. In 2 studies in young women at high sexual risk, PrEP failed to show a significant decrease in HIV infections compared with placebo [3, 8]. Poor PrEP adherence, as measured by low detectable drug levels, may explain this difference [9].
PrEP in these trials was dosed daily, which may have been a challenge for participants [3, 10–14]. Although daily dosing is recommended, less than daily dosing may still provide protection in some populations (eg, a 4-tablet, 3-dose on demand [2 + 1 + 1] regimen of TDF/FTC in males who have sex with males [MSM] [15]).
Several adherence questions remain unanswered: will an individual be protected from infection if he or she misses a single dose? How many doses can an individual miss before he or she is no longer protected, and how long before an exposure must PrEP be taken? Are both plasma and tissue drug concentrations needed, can protective drug levels be achieved with on-demand and/or long-acting formulations? Knowing the drug concentration that prevents HIV acquisition allows researchers to explore adherence patterns necessary to maintain a high level of protection from HIV infection.
We pooled longitudinal pharmacokinetic (PK) data and HIV outcomes from TFV-based treatment arms of 3 PrEP randomized controlled trials [2–4]. With this database, we used a novel quantitative approach to estimate the protective plasma TFV concentration. The proposed protective level may be used to distinguish HIV seroconversion because of nonadherence compared to suboptimal PK levels because of partial adherence and/or individual PK parameters. Additionally, the results may be used to suggest patient-centric management strategies to improve adherence patterns with daily dosing and to develop clinical trial simulation tools to propose novel PrEP regimens and study designs.
METHODS
Clinical Trials and Study Design
This analysis used individual participant-level data from pivotal TFV-based PrEP phase 3 RCTs: iPrEx [2] (NCT00458393), VOICE [3] (NCT00705679), and Partners PrEP [4] (NCT00557245). The trials were conducted in different target populations. iPrEx studied daily oral TDF-FTC compared with placebo in MSM and transgender women who have sex with men in Peru, Ecuador, Brazil, Thailand, South Africa, and the United States. VOICE evaluated daily oral TDF, oral TDF-FTC, oral placebo, 1% TFV vaginal gel, and placebo vaginal gel in young women at high sexual risk of HIV in South Africa, Uganda, and Zimbabwe. Partners PrEP compared daily oral TDF, oral TDF-FTC, and placebo in the HIV-negative partners of a HIV serodiscordant heterosexual couple in Kenya and Uganda. Analysis of the placebo arms was performed separately (M Garcia-Cremades, CW Hendrix, P Jayachandran et al, manuscript in preparation). Participants’ characteristics, longitudinal PK, adherence, sexual risk behaviors, and HIV status data were available from the primary publications [2–4].
Data Analysis and Model Building Process
Longitudinal PK and HIV outcome data were linked using the population approach as implemented in Nonlinear Mixed Effects Models v7.4 [16]. Using this approach, data from the different studies were pooled to establish a concentration-prevention relationship and identify the TFV concentration associated with a 90% decrease in the probability of HIV infection in different risk subpopulations. Individual probability of being adherent to daily PrEP, estimated from individual PK data, was also considered. Through model simulations, adherence patterns required to achieve and maintain protective concentrations can be identified to inform clinical practice and research. This analysis was performed sequentially. First, the adherence-PK models for both oral and vaginal TFV administration were developed. Interindividual variability was modelled exponentially and residual error was described using a combined error model. Second, a derived PK metric (eg, average or trough concentration) was linked to HIV outcome. Finally, the impact of PrEP in different risk groups following different adherence patterns was evaluated through model simulations using the PKPDsim R package. Data management, model selection, and evaluation are described in Supplementary Methods.
Adherence-PK Model
The TFV PK profile was described using a 2-compartment model. The structural PK model initially characterized the oral administration data; subsequently, vaginal gel administration data were included. Participants’ sex, race, body weight, age, and creatinine clearance (CrCl) were tested as covariates. Below limit of quantification (BLQ) observations were handled by estimating the likelihood of the predicted TFV concentration being less than the lower limit of quantification [17].
HIV Outcome Model
The primary endpoint in the studies was HIV seroconversion of initially seronegative individuals. HIV outcome was tested monthly. Time to seroconversion was calculated based on enrollment and seroconversion date and modeled using a parametric survival function [19, 20].
After developing the baseline survival model, calculated individual Cavg was evaluated as a driver of HIV protection: Cavg closest to the time of infection (HIV-positive individuals) and median Cavg over study period (HIV-negative individuals). The target Cavg concentrations associated with 90% decrease in the probability of HIV (EC90) were transformed to target trough concentrations (Ctrough) using PK simulations (Supplementary Methods). The effect of sex at birth and treatment arm were evaluated as covariates.
Finally, the impact of an individual’s underlying risk of infection on the ability to define an accurate PK-HIV outcome relationship was evaluated. The probability of HIV infection over time for each participant was simulated using the parametric HIV risk models developed from the individual risk factors of the placebo arms (M Garcia-Cremades, CW Hendrix, P Jayachandran et al, manuscript in preparation). HIV risk level was stratified based on these simulations to identify a moderate- to high-risk and low-risk subpopulation, which were individuals with an infection probability higher or lower than the overall median probability (7.7%) at week 150 in the pooled dataset, respectively. Different pharmacodynamic (PD) parameters were estimated for the different subpopulations. Figure 1 shows the schematic representation of the PKPD model.
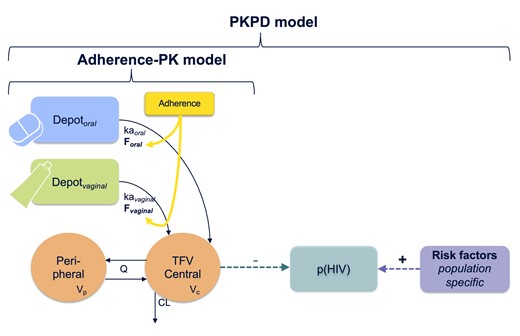
Schematic representation of the PKPD model. The full PKPD model links the adherence-PK model for both routes of administration to the probability of acquiring HIV infection over time. The population-specific risk factors refer to the predictors of HIV risk for each study that were identified in the companion submitted paper. p(HIV) represents the probability of HIV. PK parameter definition: ka, absorption rate constant. CL, clearance; F, drug bioavailability; HIV, human immunodeficiency virus; Q, intercompartmental clearance; Vc and Vp, volume of central and peripheral compartment, respectively.
RESULTS
Largest Database of HIV Outcome and Tenofovir PK Levels From Different High-risk Populations
Of 7440 participants from the active arms of iPrEx, Partners PrEP, and VOICE, 3213 (43.2%) provided at least 1 PK measurement, and 2950 (39.7%) were included in the analysis (Figure 2). The final dataset contained 243 individuals who seroconverted. Baseline demographics and PK data characteristics for the analysis dataset and the total study randomized participants are listed in Table 1 and Supplementary Table 1, respectively. The final pooled dataset constitutes, to the best of our knowledge, the largest database including both longitudinal HIV outcome and PK data profiles.
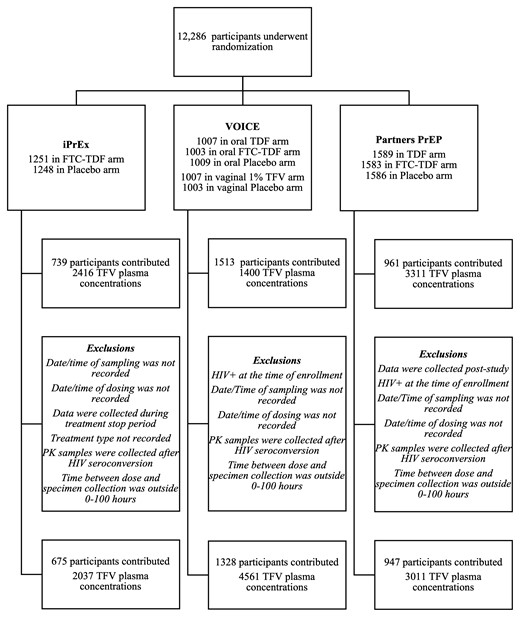
Enrollment, follow-up, and pharmacokinetics (PK) inclusion criteria for study participants. FTC, emtricitabine; HIV, human immunodeficiency virus; PrEP, preexposure prophylaxis; TDF, tenofovir disoproxil fumarate; TFV, tenofovir.
Baseline Characteristics and Pharmacokinetic Data From Participants in 3 Randomized Placebo-controlled HIV Preexposure Prophylaxis Trials
| Characteristics (Units) | Pooled Data | IPrEx | VOICE | Partners PrEP |
|---|---|---|---|---|
| n (%) | n (%) | n (%) | n (%) | |
| Participant’s baseline characteristics | ||||
| Number of individuals with valid PK data | 2950 | 675 | 1328 | 947 |
| Number of individuals with valid PK data by treatment arm | ||||
| TDF oral | 790 | 0 | 351 | 439 |
| FTC/TDF oral | 1570 | 675 | 387 | 508 |
| 1% tenofovir vaginal gel | 590 | 0 | 590 | 0 |
| Sex at birth, male | 1171 (39.7) | 675 (100) | 0 | 496 (52.4) |
| Age, median (range), y | 27 (18–64) | 25 (18–63) | 25 (18–40) | 32 (18–64) |
| Weight, median (range), kg | 63 (38–153.81) | 66 (44–153.81) | 65 (38–138) | 59 (39–118) |
| Creatinine clearance, median (range), mL/min | 119 (50–140) | 116 (63.5–140) | 130 (61–130) | 105 (50–140) |
| Acquired HIV infection during the study period | 243 (8.2) | 45 (6.7) | 146 (10.9) | 52 (5.5) |
| PK data | ||||
| Number of PK level (>BLQ) samples by treatment arm | ||||
| Oral administration | 4477 | 1077 | 922 | 2478 |
| Vaginal gel administration | 417 | 0 | 417 | 0 |
| Number of BLQ samples by treatment arm | ||||
| Oral administration | 3412 | 960 | 1919 | 533 |
| Vaginal gel administration | 1303 | 0 | 1303 | 0 |
| Median follow-up visits with PK data per individual, median (range) | ||||
| Oral administration | 3 (1–16) | 2 (1–16) | 3 (1–12) | 3 (1–10) |
| Vaginal gel administration | 2 (1–10) | 0 | 2 (1–10) | 0 |
| TFV level including BLQs, median (range), ng/mL | ||||
| Oral administration | 30.9 (0.25–899) | 23.20 (10–899) | 0.31 (0.25–466) | 69.30 (0.31–812) |
| Vaginal gel administration | 0.31 (0.25–40.9) | 0 | 0.31 (0.25–40.9) | 0 |
| TFV level excluding BLQs, median (range), ng/mL | ||||
| Oral administration | 78.1 (0.25–899) | 94.7 (10.1–899) | 61.4 (0.25–466) | 79.2 (0.313–812) |
| Vaginal gel administration | 1.14 (0.25–40.9) | 0 | 1.14 (0.25–40.9) | 0 |
| Risk stratification | ||||
| Low risk | 1480 | 307 | 532 | 641 |
| Moderate–high risk | 1470 | 368 | 796 | 306 |
PK values that were collected as not BLQ and were < BLQ (eg, 0.25 ng/mL in VOICE study) were kept as PK levels.
Abbreviations: BLQ, below limit of quantification (10 ng/mL iPrEx, 0.3 ng/mL VOICE, and Partners PrEP); FTC, emtricitabine; HIV, human immunodeficiency virus; PK, pharmacodynamics; TDF, tenofovir disoproxil fumarate; TVF, tenofovir.
High variability in the TFV plasma levels was observed (Supplementary Figure 1A). Approximately 43% (oral) and 76% (vaginal gel) of the measured concentrations were BLQ and were almost uniformly distributed throughout the 100-hour postdose period. The BLQ distribution among trials was considerably different (Table 1), with the highest proportion of BLQs (75%) in the vaginal arm of the VOICE trial, which may partly explain the high proportion of HIV seroconversions (11%) by the end of follow-up (Supplementary Figure 1C). HIV seroconversions occurred regardless of PK level at some visits (Supplementary Figure 1B); however, individuals with BLQ values closest to time of infection or time of censor had a greater probability of HIV infection, followed by those with low PK levels (below the 33rd percentile) (Supplementary Figure 1D). Figure 3 explores the proportion of HIV-positive individuals in each group strata (HIV risk subpopulation and sex at birth) for oral administration arms. The highest proportion of HIV infections occurred in moderate- to high-risk women, and no statistical difference was found between iPrEX and Partners PrEP men when stratified by risk. Difference in protective levels between risk groups can be anticipated based on the distribution of their predicted Cavg.
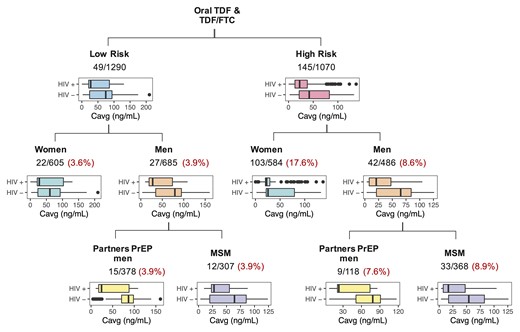
Summary of HIV-positive and HIV-*negative individuals and their Cavg levels distribution, for the different risk and sex at birth stratification groups for those in the oral administration arm (with or without FTC). Numbers indicate number of HIV seroconversions/total number of individuals in that subgroup. Proportion of HIV seroconversion by strata is shown in red. FTC, emtricitabine; HIV, human immunodeficiency virus; MSM, males who have sex with males; PrEP, preexposure prophylaxis; TDF, tenofovir disoproxil fumarate; TFV, tenofovir.
Differentiation Between Nonadherence and Low PK: Estimated Individual Probability of Adherence
The population was split into 2 subpopulations: (1) adherent (F = 100% for oral PrEP and 2.25% for vaginal PrEP) and (2) nonadherent (F ≤ 0.001% for both oral and vaginal PrEP). The overall probability of PrEP use was similar between oral and vaginal administration (55.4% and 49.7%, respectively), with large between and within (visit-to-visit) individual variability. This estimated adherence of ∼50% is lower than the self-reported adherence of nearly 90% reported by research participants during the clinical trials. Individual adherence patterns appear to change over time and different patterns of adherence and timing of seroconversion are shown (Supplementary Figure 2). One-hundred and twenty seven of 243 participants who seroconverted were fully nonadherent, 70 had mixed behaviors, and 46 appeared to be adherent.
The apparent CL (CL/F) increased by 2.3 L/h (4.1%) for each 10 mL/min increase in CrCl and 3.2 L/h (5.6%) for each 10 kg increase in weight. Females had a 44% lower apparent volume of distribution than males. Overall, male sex, normal CrCl, and normal body weight were all independently associated with lower plasma TFV concentrations when compared with women, abnormal creatinine clearance, and low body weight, respectively. Supplementary Table 2 and Supplementary Figure 3 display the PK parameter estimates and PK model evaluation results, respectively.
Plasma TFV Levels and the Presence of FTC Are Associated With a Decrease of HIV Infection
Hazard of acquiring HIV infection, described by a surge distribution, was significantly associated with plasma TFV Cavg (P < .001). The PD relationship was best described by a maximum effect model, estimating the concentration associated with 50% of the maximum effect (EC50) (Supplementary Table 3). Administration of oral TDF increased the baseline hazard by 70% compared with TDF/FTC.
The Underlying Individual HIV Hazard Is a Determining Factor in the Estimation of Accurate Preventive Concentrations
The inclusion of patient stratification based on underlying risk of infection in the PKPD model led to the estimation of significantly different EC50 values between risk groups for both oral and vaginal PrEP use (P < .001) (Supplementary Table 3). The distribution of this individual underlying risk of HIV infection is shown in Figure 4A. Fifty-four HIV infections occurred in the low-risk subgroup (n = 1480) compared with 189 in the moderate- to high-risk group (n = 1470). Figure 4 shows that the model adequately describes the different HIV risk profiles between risk groups (B) and when stratified by Cavg for the moderate- to high-risk individuals (C), especially for those who received oral PrEP.
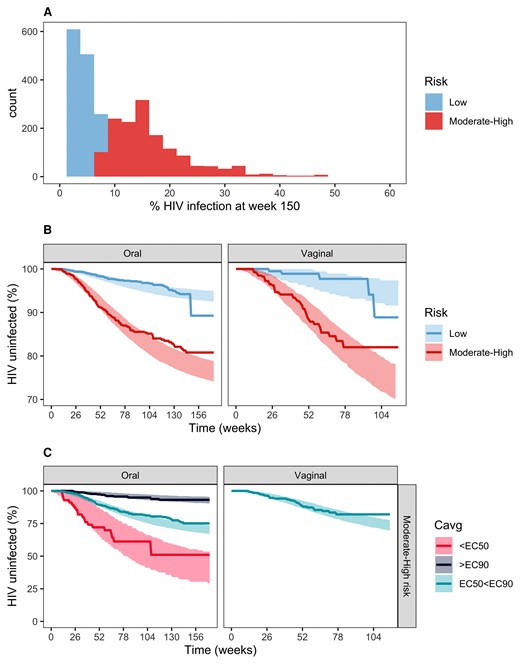
Final PKPD exploration and evaluation. (A) Predicted baseline HIV probability distribution of the pooled data using the risk predictor algorithm developed in the placebo arm analysis. (B) Kaplan-Meier VPC plot stratified by risk levels. (C) Kaplan-Meier VPC plot stratified by target concentration for moderate- to high-risk individuals. Continuous lines in the VPC plots represent real data; shaded areas represent 95% confidence intervals for simulated data. Moderate- to high-risk EC50 and EC90 values (Cavg) are 3.53 and 31.7 ng/mL for men and 11.2 and 100.8 ng/mL for women, respectively. HIV, human immunodeficiency virus; PKPD, pharmacokinetics/pharmacodynamic.
Women Taking Oral PrEP Need Higher Plasma TFV Levels to Be Protective Compared With Men
The estimation of a different EC50 for men and women in the moderate- to high-risk subpopulation following oral administration (P < .05) suggests that women need a higher protective TFV concentration than men (Supplementary Table 3). The target protective Ctrough levels for moderate- to high-high risk was 16.1 ng/mL (men) and 45.8 ng/mL (women) following oral administration. Target protective concentrations in the low-risk subpopulation did not differ by sex at birth. As a note, regardless of selection of the cut-off between low and moderate- to high-risk subpopulation, women at higher risk show higher estimated target concentration compared with men at high risk (Supplementary Figure 4).
Figure 5 compares typical PK profile simulations following TDF oral administration (300 mg) for sample adherence patterns with the identified target concentrations for the different risk groups. Steady-state PK levels drop significantly below protective Ctrough for those at high risk when the adherence pattern is reduced from daily to every 2 days or every 3 days, especially in women. Trough, average, and maximum concentrations related to the estimated EC50 and EC90 parameters are reported in Table 2.
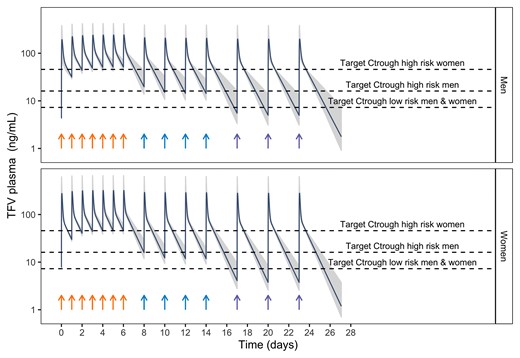
PK model simulations in men and women following oral administration of TDF (300 mg) for sample adherence patterns. Dark blue line represents the typical PK population profile, whereas gray shadows represent individual PK profiles (200) including interindividual variability variability. Dashed lines indicate the target Ctrough levels associated with a 90% decrease in the probability of HIV for men and women at high-moderate subgroups and for those in a low-risk subgroup. Arrows indicate the time the dose is administered. Sample adherence patters are daily (orange arrows), every 2 days (blue arrows), and every 3 days (purple arrows). HIV, human immunodeficiency virus; PK, pharmacokinetics; TDF, tenofovir disoproxil fumarate.
Typical PK Metrics (Ctrough and Cmax) Associated With the Estimated EC50 and EC90 Cavg
| EC50 (ng/mL) | EC90 (ng/mL) | |||||
|---|---|---|---|---|---|---|
| Cavg | Cmax | Ctrough | Cavg | Cmax | Ctrough | |
| PKPD model | ||||||
| Oral administrationa | 2.73 | 8.68 | 1.24 | 24.57 | 78.12 | 11.15 |
| Vaginal administration | 0.0348 | 0.09 | 0.02 | 0.3132 | 0.83 | 0.15 |
| PKPD model with risk stratification | ||||||
| Oral administrationa | ||||||
| Low risk | 2.48 | 7.84 | 1.26 | 22.32 | 70.96 | 10.13 |
| Moderate–high risk | 10.2 | 32.43 | 4.63 | 91.8 | 291.87 | 41.67 |
| Vaginal administration | ||||||
| Low risk | 0.0179 | 0.05 | 0.01 | 0.161 | 0.43 | 0.07 |
| Moderate–high risk | 0.141 | 0.38 | 0.07 | 1.269 | 3.38 | 0.59 |
| PKPD model with risk and sex at birth stratification (final model) | ||||||
| Oral administration | ||||||
| Low-risk men | 1.78 | 4.27 | 0.9 | 16.02 | 38.4 | 8.15 |
| Low-risk women | 1.78 | 5.65 | 0.8 | 16.02 | 50.9 | 7.28 |
| Moderate- to high-risk men | 3.53 | 8.5 | 1.8 | 31.7 | 76.1 | 16.1 |
| Moderate- to high-risk women | 11.2 | 35.6 | 5.1 | 100.8 | 320.5 | 45.8 |
| Vaginal administration | ||||||
| Low risk | 0.0179 | 0.05 | 0.01 | 0.161 | 0.43 | 0.07 |
| Moderate–high risk | 0.141 | 0.38 | 0.07 | 1.269 | 3.38 | 0.59 |
Abbreviations: Cavg, average concentration; Cmax, maximum concentration; Ctrough, trough concentration; EC50, 50% of the maximum effect; EC90, 90% of the maximum effect; PKPD, pharmacokinetics/pharmacodynamics.
For the PKPD model and PKPD model with risk stratification, the PK simulations for calculating Cmax and Ctrough were performed in women.
Different Plasma Levels of Tenofovir Produce the Same Effect
The estimated EC50 parameters for both risk level groups were significantly different between oral and topical vaginal administration in women (Supplementary Table 3). These results reveal that different TFV plasma levels, differing by a factor of 2 on a log10 scale, achieved with different formulations and routes of administration, can produce the same protective effect. Target plasma concentrations following vaginal administration were estimated with less accuracy than following oral administration.
DISCUSSION
We performed an individual-level data pooled analysis to develop a population exposure-outcome model that describes TFV plasma concentrations and the probability of HIV seroconversion over time for various HIV infection risk levels. We proposed protective TFV concentrations (Ctrough 45.8 ng/mL in women and 16.1 ng/mL in men at high risk, following oral administration), while also integrating the probability of being adherent to daily PrEP and the underlying individual HIV infection risk as determined by the population-specific risk factors that we previously identified (M Garcia-Cremades, CW Hendrix, P Jayachandran et al, manuscript in preparation).
Our pooled dataset comprised 2950 individuals with valid TFV PK levels and 243 HIV infections. This dataset is larger than the largest clinical trial in our group (VOICE [3]). For example, other analysis that estimated protective concentrations included 200 participants and 30 HIV seroconversions [21]. Integrating data across several clinical trials enables us to use population modeling approaches with high predictive power. Additionally, our work promotes data sharing to encourage international collaboration in research to expand the impact of clinical trials [22].
Published results emphasize that nonadherence or low adherence to TDF-based PrEP, defined as nonquantifiable TFV plasma concentrations, is prevalent in participants with unfavorable HIV outcomes [2, 4–6]. In this analysis, we defined adherence as a probability of drug intake and estimated it for every visit and every subject. The visit specific ∼50% probability of drug intake indicates that participants consumed half of prescribed pills in the period preceding the visit. A mix of estimated adherence patterns was identified (eg, participants with high PK levels at the HIV seroconversion visit, but mostly nonadherent in previous visits). Hence, HIV seroconversion might be due to suboptimal plasma levels at the time of HIV exposure.
The use of oral TDF alone compared to oral TDF-FTC shows a 70% of increase of the baseline HIV hazard in this analysis. Animal studies suggest that the combination of TDF-FTC might provide higher protection from sexual HIV acquisition [23].
Our analysis showed that moderate- to high-risk female participants using oral PrEP need higher TFV levels in plasma than males. Likewise, both high-risk populations need greater adherence to maintain efficacy levels, and women more than men (Figure 5), which might be explained by tissue pharmacology [24]. Nevertheless, HIV protection exceeds 90% in all populations with daily adherence. A similar plasma EC90 (Cavg of 105–110 ng/mL) has been reported from a meta-analysis of PrEP trials, where adherence to daily dosing (roughly 7 doses per week), was also recommended [25]. Of note, emerging data from demonstration projects are finding low rates of HIV infection in women with moderate adherence, supporting the efficacy of oral PrEP when adhered to [26]. Those results suggest that women at risk may achieve high enough adherence around HIV exposure times to provide high levels of protection. This analysis, however, could not identify differences in plasma TFV protection levels between males and females in the low-risk subpopulation, possibly because of the low number of HIV cases in that risk group.
Vaginal data obtained from the VOICE study were associated with a low adherence and a high number of plasma BLQ samples, which may have affected the estimation of accurate protective TFV levels in plasma following vaginal administration in moderate- to high-risk populations. TFV concentration after vaginal dose can also be substantially affected by medication adherence and the vaginal microbiome [27]. Nevertheless, different plasma levels of TFV, given different routes of administration, produced the same level of protection in this analysis, suggesting that TFV concentrations at the site of action should also be considered as a predictor of HIV infection. In fact, several studies have shown the potential of TFV measured in several biologic matrices (eg, peripheral blood mononuclear cells, vaginal/rectal tissue) as predictors of PrEP efficacy [28, 29]. As an example, daily oral dosing of tenofovir alafenamide (which delivers the active metabolite to target cells more efficiently, with lower plasma TFV concentrations) with FTC, has been demonstrated to be noninferior to daily oral TDF-FTC in MSM and transgender women [30]. Therefore, we are performing additional analyses incorporating the target metabolite and its distribution to peripheral blood mononuclear cells in the current PKPD model to assess the predictive capability of TFV-DP in comparison to TFV. Understanding if the key predictor of HIV prevention is drug levels in plasma or in target cells would inform the selection on TDF or on tenofovir alafenamide-based oral formulations.
Results from this analysis provide target drug concentrations to inform the development of novel TFV-based PrEP formulations, which might help to overcome the adherence challenges associated with daily administration. Furthermore, these models can be used as a tool for clinical trial simulations to inform optimal study designs of these forthcoming TFV formulations.
A limitation of this analysis is the high number of BLQ samples, especially in the vaginal data obtained from VOICE study, which made it difficult the estimate of accurate target concentrations in the vaginal tissue. Additionally, the target protective concentrations for the different risk strata were estimated with low precision (Supplementary Table 3), hindering the reporting of protective Ctrough confidence intervals for moderate- to high-risk men and women taking oral PrEP.
In conclusion, this analysis used the largest database to date of TFV placebo, PK plasma levels, and HIV outcome information. We found that individuals with different underlying HIV risk hazards may need different plasma protective levels, and that moderate- to high-risk women need higher plasma TFV levels to prevent HIV acquisition compared with men.
Supplementary Data
Supplementary materials are available at Clinical Infectious Diseases online. Consisting of data provided by the authors to benefit the reader, the posted materials are not copyedited and are the sole responsibility of the authors, so questions or comments should be addressed to the corresponding author.
Notes
Acknowledgments. The authors appreciate the contribution of the participants in the studies and the staff that worked on the trials.
Disclaimer. The findings and conclusions in this paper are those of the authors and do not necessarily represent the official position of the Centers for Disease Control and Prevention.
Financial support. This work was supported by PhRMA Foundation (Postdoctoral Fellowship in Translational Medicine and Therapeutics to MG-C), and by the Bill and Melinda Gates Foundation (grant OPP1099837) (subaward from Johns Hopkins University to University of California San Francisco). C. W. H. reports support for the present work from the Bill and Melinda Gates Foundation: secondary data analysis contract, paid to Hopkins, managed by Hopkins. K. V. reports support for the present work: Fulbright scholarship under the Fulbright U.S. Scholar Program for stay and research at University of California San Francisco, during 2016–2017. P. A. reports support for this work from the National Institutes of Health (NIH) (paid to institution) and Gilead Sciences (donation of study drug).
References
Author notes
Potential conflicts of interest. D. V. G. has served on an Advisory Board for Merck and has personal fees from Gilead. C. W. H. contracts for clinical research, paid to Hopkins and unrelated to this work, from Gilead, Merck, and ViiV Healthcare; consulting fees from Gilead (scientific Advisory Board, travel support, paid to author), Merck (scientific Advisory Board, travel support and honoraria, paid to author), and ViiV Healthcare (scientific Advisory Board, travel support and honoraria, paid to author); US patents (2 issued patents related to HIV prevention technology); and a leadership role as founder of Prionde Biopharma, LLC (company to develop human immunodeficiency virus (HIV) prevention product). P. J. reports grants or contracts unrelated to this work: T32 GM007546 from the National Institute of General Medical Sciences (NIGMS). R. G. reports grants or contracts unrelated to this work from Gilead Sciences: employer, UCSF, has received funding to support work as a site investigator for clinical trials related to preexposure prophylaxis using agents other than FTC/TDF; and payment for expert testimony from the US Department of Justice (related to a patent held by the US Government related to preexposure prophylaxis using tenofovir esters and emtricitabine). C. L. C. reports consulting fees as a scientific advisor to Merck and Gilead Sciences. J. M. B. reports grants to institution, unrelated to this work, from NIH and BMGF and is an employee of Gilead Sciences (salary, stock, options). J. M. reports consulting fees and participation on Scientific Advisory Board from Merck and Gilead Sciences and is treasurer and board member for the Infectious Disease Society of America. P. A. reports contracts or grants unrelated to this work from Gilead Sciences (paid to institution); and consulting fees paid to author from Gilead Sciences, Merck, and ViiV. All other authors report no potential conflicts.
All authors have submitted the ICMJE Form for Disclosure of Potential Conflicts of Interest. Conflicts that the editors consider relevant to the content of the manuscript have been disclosed.

