


Abstract
The novel coronavirus pandemic incited unprecedented demand for assays that detect viral nucleic acids, viral proteins, and corresponding antibodies. The 320 molecular diagnostics in receipt of US Food and Drug Administration emergency use authorization mainly focus on viral detection; however, no currently approved test can be used to infer infectiousness, that is, the presence of replicable virus. As the number of tests conducted increased, persistent severe acute respiratory syndrome coronavirus 2 (SARS-CoV-2) RNA positivity by reverse-transcription polymerase chain reaction (RT-PCR) in some individuals led to concerns over quarantine guidelines. To this end, we attempted to design an assay that reduces the frequency of positive test results from individuals who do not shed culturable virus. We describe multiplex quantitative RT-PCR assays that detect genomic RNA (gRNA) and subgenomic RNA (sgRNA) species of SARS-CoV-2, including spike, nucleocapsid, membrane, envelope, and ORF8. Viral RNA abundances calculated from these assays were compared with antigen presence, self-reported symptoms, and culture outcome (virus isolation) using samples from a 14-day longitudinal household transmission study. By characterizing the clinical and molecular dynamics of infection, we show that sgRNA detection has higher predictive value for culture outcome compared to detection of gRNA alone. Our findings suggest that sgRNA presence correlates with active infection and may help identify individuals shedding culturable virus.
Global transmission of severe acute respiratory syndrome coronavirus 2 (SARS-CoV-2), the causative agent of coronavirus disease 2019 (COVID-19), revealed current pitfalls in point-of-care diagnostics. Successful pandemic management depends on accurate and precise diagnostics with high throughput, fast turnarounds, and reproducibility. At the time of writing, one diagnostic has received full 510(k) clearance, while emergency use authorization (EUA) from the United States (US) Food and Drug Administration has been granted to 320 molecular (nucleic acid and antigen) and 90 serology diagnostics [1]. While active and previous infections can be documented using these authorized molecular and serology diagnostics, respectively, they are not designed to accurately assesses an individual’s infectivity, or ability to spread the virus.
Coronaviruses are enveloped, positive-sense RNA viruses responsible for up to one-third of annual common cold infections [2]. After cell entry, the viral RNA is released and the open reading frames ORF1a and ORF1ab are translated into the polyproteins pp1a and pp1ab, respectively. Virus-encoded proteases process the 2 polyproteins into functional proteins responsible for viral RNA replication and immune evasion [3]. To produce the remaining structural and auxiliary proteins, the viral replicase complex utilizes the viral genome as a template to produce negative-sense RNAs for genome replication as well as shorter subgenomic RNAs (sgRNAs) through a process of discontinuous co-transcription [4,5]. All sgRNAs contain the leader sequence from the 5′ end of the viral genome linked to each specific 3′ ORF, or body. Together, these sgRNAs form a set of 3′-nested RNA species. Because the process of sgRNA formation only occurs during genomic replication and transcription, sgRNA abundance has been proposed as a proxy of active viral replication and infectivity [6–8].
We describe here the development and characterization of quantitative real-time polymerase chain reaction (qRT-PCR) assays that detect SARS-CoV-2 genomic-specific RNA (gRNA) and sgRNAs for the spike (S), nucleocapsid (N), envelope (E), membrane (M), and ORF8 genes. Assays were validated with RNA extracted from supernatant of infected cells and synthetic RNAs for each analyte to quantify absolute copy numbers. We performed culture isolation with 452 longitudinal nasal specimens and used newly developed multiplex assays, existing qualitative RT-PCR and antigen assays, and reported symptom data to characterize molecular kinetics of infection and infer our assays’ predictive value for viral culture isolation. Findings from this study suggest that research assays measuring sgRNA can be used to infer the presence of viable virus in specimens with qRT-PCR–detectable viral sgRNA and may inform public health recommendations regarding isolation of persons with SARS-CoV-2 qRT-PCR–positive results.
METHODS
Specimen Collection and Initial Processing
Between April and September 2020 (prior to emergence of B.1.1.7), households were recruited into a Centers for Disease Control and Prevention (CDC)–sponsored case-ascertained household SARS-CoV-2 transmission study in Nashville, Tennessee, after identification of an infected index case [9]. Once enrolled, instructions demonstrating self-collection of anterior nasal specimens were provided to participants who also recorded symptom data daily for 14 consecutive days. Specimens were transferred to Vanderbilt University Medical Center (Nashville, Tennessee) where they were processed and tested for SARS-CoV-2 using the CDC 2019-Novel Coronavirus Real-Time RT-PCR Diagnostic Panel (hereafter referred to as 2019-nCoV Assay; see Supplementary Information for additional details on specimen processing). Specimens passing the RNA quality assessment were transported on dry ice to the CDC for further testing. The household transmission study protocol was approved by the Vanderbilt University Institutional Review Board. The CDC determined that the study was conducted consistent with applicable federal law and CDC policy (see 45 Code of Federal Regulations [C.F.R.] part 46; 21 C.F.R. part 56).
Synthetic RNA Design and qRT-PCR Assay Development
Plasmids, primers, and probes were designed using the SARS-CoV-2/Wuhan-Hu-1 sequence as a template (National Center for Biotechnology Information Reference Sequence: NC_045512.2). DNA fragments synthesized and cloned into pUC57 were designed with the T7 promoter upstream of the SARS-CoV-2 leader sequence, followed by the truncated ORF for a given transcript, and ended with an RNaseP gene fragment. Plasmid DNA linearized by restriction enzyme digestion was purified and used as template for in vitro transcription. RNA was purified by TRIzol-LS extraction and analyzed under denaturing conditions by agarose gel electrophoresis. Three singleplex assays per target were validated (Supplementary Table 1; Supplementary Figures 1Aand 2). The top performing primer set, determined by amplification efficiency, was selected for further validation and multiplex optimization (Supplementary Figure 1B–E; Supplementary Tables 2 and 3). Cycle threshold (Ct) values for the 2 SARS-CoV-2 analytes and RNaseP in clinical specimens tested using the 2019-nCoV Assay correlated with gRNA and RNaseP Ct values using our multiplex assay (Supplementary Figure 2) [10,11].
Specimen Processing, RNA Detection, and Antigen Detection
Frozen respiratory specimens were thawed at room temperature and aliquoted into 3 prelabeled tubes using aseptic technique: 100 µL for culture inoculation, 100 µL for antigen testing, and 100 µL in a third tube containing 400 µL AVL buffer. qRT-PCR was performed on a QuantStudio 6 Pro Real-Time PCR System. The aliquot for antigen testing was diluted 1:1 with specimen diluent and assayed for the presence of SARS-CoV-2 nucleocapsid or spike protein according to the manufacturer’s recommendations (ABclonal RK04135, RK04136, and RK04159). Specimens were marked positive for antigen when any one of the 3 assays used rendered an absorbance that corresponded to a positive value per the standard curve equation. See Supplementary Information for further details on RNA extraction, qRT-PCR setup, and controls used for each.
Inoculation of Cells With Clinical Specimens and Virus Titration
Vero E6 cells (JCRB1819) stably overexpressing the transmembrane serine protease TMRPSS2 [12] were seeded into 24-well plates at a density of 1.8 × 10⁵ cells/well. On the day of infection, medium from plates was replaced with 200 µL infection medium. Skipping wells, 100 µL of undiluted clinical specimen was added dropwise to 12 wells and 100 µL infection medium to the remaining wells. One hour of virus adsorption with gentle agitation every 20 minutes was ended with the addition of 200 µL prewarmed infection medium. Wells were visually inspected daily for 5 days; positive wells were designated as having >20% detached cells. Wild-type SARS-CoV-2 from Washington state (SARS-CoV-2/WA1) was titrated by median tissue culture infectious dose (TCID50). Serial dilutions of virus prepared in virus diluent were transferred to a 96-well plate containing 80%–98% confluent Vero E6 cells. Cytopathic effects were recorded between 3 and 7 days and TCID50 titer was calculated using Reed-Muench method [13]. All incubation steps were performed at 37°C ± 5% carbon dioxide.
Statistical Analyses and Data Processing
Amplification efficiencies were calculated from the slope of the standard curve (m) using the following formula: efficiency (%) = [(10−1/m – 1) × 100]. Two-way analysis of variance were performed for statistically analyzing culture success in the presence and absence of given symptom(s) (Supplementary Figure 3C). Unpaired t tests were performed for statistically analyzing culture success in the presence and absence of detectable antigen (Supplementary Table 5). The positive predictive value (PPV) and negative predictive value (NPV) of qRT-PCR relative to culture and vice versa were determined using the following equations:
RESULTS
Specimens Isolated in Culture and Detection of Viral Analytes
We obtained 481 upper respiratory specimens self-collected between April and September 2020 from 79 people in 43 unique households. Based on initial RNA quality assessment (Supplementary Information), isolation of virus in cell culture was attempted with 452 specimens, of which 41% (187/452) were culturable (Cx+). Most Cx+ specimens caused positive cytopathic effect on day 2 (124/187 [66%]) after inoculation onto VeroE6-TMPRSS2 cells. All Cx+ specimens were positive for gRNA and most had detectable sgRNA. Among unculturable (Cx−) specimens (255/452 [56%]), gRNA was detected in 88% (222/252) and sgRNA in 31%–54% (77–137/252). Specimens with visible microbial contamination (n = 10 [2%]) or undetectable control RNaseP (n = 4 [1.6%]) were excluded from downstream analyses (Figure 1A and B).
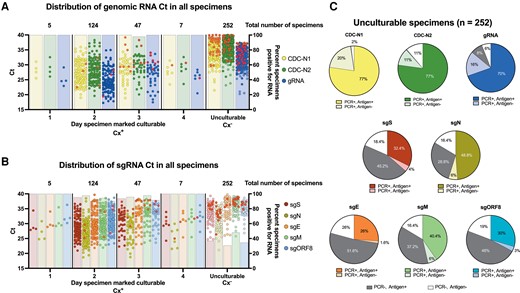
RNA and antigen results by culture isolation. A and B, The cycle threshold values determined by quantitative reverse-transcription polymerase chain reaction (qRT-PCR) for all clinical specimens targeting genomic severe acute respiratory syndrome coronavirus 2 RNA (gRNA) and subgenomic RNA (sgRNA) are plotted by the indicated group along the x-axis. Above each dot plot are the total number of culturable or unculturable specimens isolated on a given day after inoculation of VeroE6-TMPRSS2 cells. Bars plotted on the right y-axis indicate the percentage of specimens with detectable RNA for each group. Solid red circles represent original clinical specimens negative for spike or nucleocapsid antigen by enzyme-linked immunosorbent assay. C, For all unculturable specimens, antigen presence was compared to specimens testing positive or negative for the indicated analyte. Dark gray slices represent specimens that were qRT-PCR negative for the given analyte, but antigen positive for spike or nucleocapsid antigen, while white slices represent specimens qRT-PCR negative and antigen negative. Abbreviations: CDC, Centers for Disease Control and Prevention; Ct, cycle threshold; Cx+, culturable; Cx–, unculturable; E, envelope; gRNA, genomic RNA; M, membrane; N, nucleocapsid; ORF, open reading frame; PCR, polymerase chain reaction; S, spike; sg, subgenomic.
Among Cx+ specimens, 92% (171/186) had detectable SARS-CoV-2 antigen (Ag+) (Figure 1). These specimens (n = 171) had on average between 4.63 and 5.24 log10 sgRNA copies/mL (Supplementary Table 5). All Cx+ specimens lacking detectable antigen (Ag–; n = 15) were positive for genomic viral RNA using both CDC-N1, which detects genomic and sgRNA, and the in-house–designed target specific to only genomic RNA (orf1ab), while sgRNAs were detected in most specimens. In Cx−/Ag+ specimens, CDC-N1 was detected in 100% (194/194), the in-house designed gRNA target in 90% (174/194), and sgRNA in 34%–63% (65–122/194). Within Cx−/Ag− specimens, 91% (51/56) were positive for CDC-N1, 73% (41/56) for the in-house–designed gRNA, and between 7% and 27% (4–15/56) for sgRNA (Figure 1C and Supplementary Table 5).
Extended Shedding of Viable Virus and Culturable Specimens With High Ct
Most participants reached peak viral concentrations in their specimens within the testing period (Figure 2A–C). Of the 58 unique individuals who provided Cx+ specimens, 4 (4/58 [6.9%]) shed culturable virus for >7 days, including an individual Cx+ for 9 consecutive days, then Cx– at days 10–13, and finally Cx+ again at day 14. Symptoms were reported by these 4 participants at the time of collection for 73% (8/11) of specimens, of which all were Ag+ and all sgRNA analytes were detected in each specimen except for sgE in one. Symptom reporting and frequency were similar between individuals with <6 or >6 days of culturable virus (Supplementary Table 6).
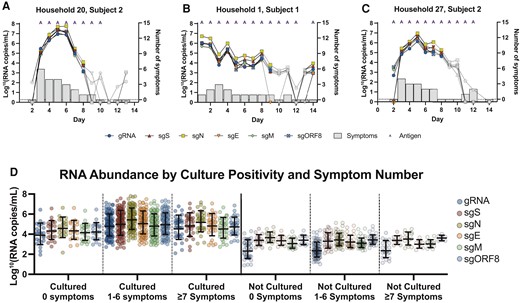
RNA fluctuation during the molecular time course of infection. A–C, Calculated RNA copies/mL are plotted by day of sampling along the x-axes for selected participants. Gray data points indicate unculturable specimens, while colored symbols indicate the culturable specimens. The number of self-reported symptoms shown in gray bars are plotted on the right y-axes. Specimens positive for antigen are represented with an “A” at the top of each data point. Specimens with undetectable RNA by quantitative reverse-transcription polymerase chain reaction for any given analyte were arbitrarily assigned a value 0. D, Specimens were grouped by number of symptoms reported and culture result. Standard curves generated using synthetic RNA for each analyte were used to determine the number of RNA molecules per reaction. Specimens with no detectable RNA are not plotted and did not factor into the mean or 95% confidence interval. Abbreviations: E, envelope; gRNA, genomic RNA; M, membrane; N, nucleocapsid; ORF, open reading frame; S, spike; sg, subgenomic.
Ten specimens with Ct values >34 for CDC-N1 were Cx+ (Cthigh/Cx+), while 7 specimens with Ct values <30 for CDC-N1 were Cx– (Ctlow/Cx−) (Supplementary Table 7). At the time of collection, a similar percentage of participants from both groups were symptomatic (7/10 [70%] for Cthigh/Cx+; 5/7 [71%] for Ctlow/Cx−).
Detection of sgRNA Increases Probability That Specimens Contain Viable Virus
Using virus culture as a reference standard, we compared Ct values of Cx+ specimens (referred to as true positives) with Ct values of Cx- specimens (referred to as falsely positive for replication-competent virus when qRT-PCR positive) to assess the predictive value of our assay. First, we assessed whether the presence of any one sgRNA targeted in the 2 multiplex assays we developed had a stronger correlation with culture outcome than the 2 individual analytes used in the 2019-nCoV Assay (Table 1). We found that, when strictly based on detection of a given RNA species, specimens RT-PCR positive for sgRNAs were 4.9%–13.8% better predictors of culture outcome compared to predictive values from the 2019-nCoV Assay (Table 1). A positive result for both targets in the 2019-nCoV Assay (Ct < 40 for CDC-N1 and CDC-N2) was 50.4% (181/359) predictive of a Cx+ specimen, while a negative result was 98.6% (68/69) predictive of a Cx− specimen, resulting in an overall predictive value of 74.5% (Table 1). An RT-PCR positive result for all RNA species included in the gRNA (orf1ab)–sgS-sgN multiplex assay was 79.4% (173/218) predictive of a culturable specimen and 95.7% (201/210) predictive of an unculturable specimen. The PPV achieved with the sgE-sgM-sgORF8 multiplex assay was 91.6% (163/178), while the NPV was 92.4% (231/250).
Predictive Values for Culture by Individual Assay Analytes and Multiplex
| Molecular Target(s) | Consistency of Culture to RT-PCR | Overall Predictive Valuea | |
|---|---|---|---|
| PPV Cx+/Molecular+ | NPV Cx−/Molecular− | ||
| CDC-N1 | 182/418 (43.5%) | 10/10 (100%) | 76.2% |
| CDC-N2 | 181/369 (49.1%) | 58/59 (98.3%) | 73.7% |
| CDC-N1, CDC-N2 | 181/359 (50.4%) | 68/69 (98.6%) | 74.5% |
| Antigen | 169/353 (47.9%) | 57/70 (81.4%) | 64.7% |
| gRNA | 182/376 (47.7%) | 52/52 (100%) | 73.9% |
| sgS | 173/218 (79.4%) | 201/210 (95.7%) | 87.5% |
| sgN | 177/271 (65.3%) | 152/157 (96.8%) | 81.1% |
| sgE | 167/195 (85.6%) | 218/233 (93.6%) | 89.6% |
| sgM | 175/247 (70.9%) | 174/181 (96.1%) | 83.5% |
| sgORF8 | 166/205 (81.0%) | 207/223 (92.8) | 86.9% |
| gRNA, sgS, sgNb | 173/212 (81.6%) | 207/216 (95.8%) | 88.7% |
| sgE, sgM, sgORF8c | 163/178 (91.6%) | 231/250 (92.4%) | 92.0% |
Abbreviations: CDC, Centers for Disease Control and Prevention; Cx+, culturable; Cx–, unculturable; E, envelope; gRNA, genomic RNA; M, membrane; N, nucleocapsid; NPV, negative predictive value; ORF, open reading frame; PPV, positive predictive value; RT-PCR, reverse-transcription polymerase chain reaction; S, spike; sg, subgenomic.
Overall predictive value = (PPV + NPV from consistency of culture to quantitative RT-PCR) / 2.
Targets of multiplex 1 (RNaseP data not shown).
Targets of multiplex 2.
Self-Reported Symptom Progression and Temporal Decline in Viral RNA
Most Cx+ (152/184 [83%]) and Cx− (150/236 [64%]) specimens were from participants reporting one or more symptoms (Figure 2D). While some participants did not respond for all symptom data, the 3 most reported symptoms from participants with Cx+ specimens were fatigue (106/183 [58%]), headache (56/101 [56%]), and nasal congestion (86/183 [47%]), while the top 3 from participants with Cx– specimens were anosmia (87/207 [42%]), headache (50/119 [42%]), and fatigue (96/236 [40%]). Data from each participant were organized longitudinally to analyze RNA levels and symptom data over the time course of infection (Figure 3A). An increase of 3.1–3.7 log sgRNA copies was observed during the transition between shedding of nonviable virus to culturable virus (Figure 3A). Viral RNA levels and the number of participants reporting nasal congestion, fatigue, runny nose, and shortness of breath peaked between the second and fifth day. Levels of sgRNA decreased by 1.4–2.4 logs 1 day after the last day a subject’s specimen contained culturable virus, while the proportion of participants reporting symptoms followed (Figure 3B; Supplementary Figure 3A). Regardless of symptom presence, RNA abundance was significantly higher in all Cx+ specimens compared to Cx− specimens. In general, RNA abundance was greater in symptomatic individuals than asymptomatic individuals within the same group.

Severe acute respiratory syndrome coronavirus 2 RNA abundance and symptoms follow similar trend. A, The average RNA copies/mL on each day of disease progression are plotted on the left y-axis and percent of patients reporting symptoms on a given day on the right y-axis. The number of patient specimens for each day graphed are listed under the title. Colored symbols and transparent red box represent culturable specimens and white symbols represent unculturable specimens. The semi-transparent purple line represents the average percentage of antigen positive specimens for each day. B, The x-axis follows same designation as Figure 3A. The percentage of patients reporting a combination of symptoms out of only those who reported 1 or more symptoms are graphed. Light gray dotted line indicates 50%. Solid black lines are second-order smoothing (4 neighbors). Transparent red box indicates days of self-collection patient specimens rendered culturable virus. Data points with <6 patient samples (eg, patient specimens with consecutive culture positive results for 8–14 days or specimens culture negative >2 days prior to the first culture-positive specimen for the same patient) were not included in this figure or data analyses. Abbreviations: E, envelope; gRNA, genomic RNA; M, membrane; N, nucleocapsid; ORF, open reading frame; S, spike; SARS-CoV-2, severe acute respiratory syndrome coronavirus 2; sg, subgenomic.
DISCUSSION
In this study, we evaluate 2 multiplex qRT-PCR assays and provide unique insight into the association with and variability between the characteristics of SARS-CoV-2 infection. After validating our testing method, we used longitudinal specimens collected from individuals soon after their infection to document a temporal relationship between symptom presence, infectious virus, RNA abundance, and antigen presence. We found that SARS-CoV-2 sgRNA abundance more strongly correlated with specimens containing culturable virus compared with positive antigen tests. On average, the abundance of each viral RNA peaked on the third and fourth day of sampling, while the percentage of participants reporting symptoms peaked on the fifth. During the transition from shedding of culturable to unculturable virus, viral RNA levels declined more precipitously than the presence of symptoms or antigen. Finally, the number of self-reported symptoms from participants with Cx+ specimens were often greater than those among Cx− specimens, though we found no significant difference in the number or type of symptom reported between individuals with <6 or >6 days of culturable virus.
Early in the COVID-19 pandemic, the World Health Organization recommended that infected individuals end quarantine after 2 negative RT-PCR tests [14]. This advice likely led to prolonged isolation for individuals who persistently tested positive after symptoms subsided [15]. In this report, 41% (187/452) of specimens we assayed were Cx+ even though most (419/452 [93%]) were positive by RT-PCR using the 2019-nCoV Assay. While testing positive for SARS-CoV-2 by RT-PCR indicates infection, a significant proportion of RT-PCR–positive persons may not be infectious; we found that 97% (245/252) and 86% (216/252) of specimens lacking viable virus were positive for CDC-N1 and the in-house–designed gRNA, respectively.
Diagnostic sgRNA testing and the value it may afford in reducing isolation or confirming persistently positive cases has been studied [16–19] and evidence exists supporting envelope sgRNA abundance correlates with infectivity [8,20–22]. To further elucidate any link between specimens containing sgRNA and the presence of infectious virus, the 2 assays described in this report target 5 sgRNAs. In line with a recent report, we observed that 5.09 log10 copies/mL of sgE were present in Cx+ specimens [23]. Moreover, the presence of all 5 sgRNA analytes from our multiplex qRT-PCR assays were detected in 90% (167/186) of Cx+ specimens compared to only 19% (49/252) of Cx− specimens. We found a modest increase in both PPV and NPV for culturable virus when using assays specific to various sgRNAs. While these data suggest that sgRNA presence correlates with active infection and may help more precisely identify individuals shedding culturable virus, these conclusions may have some limitations based on the following assumptions: (1) virus isolation in culture directly correlates to a person’s infectivity; (2) all sampling and storage methods lead to similar quantities of specimens available for testing; and (3) the relationship between viral RNA abundance and infectivity is consistent and robust to factors negatively influencing RNA or virion integrity. While one or more of the foregoing might not hold true, sgRNA is nonetheless produced during viral replication and would likely indicate active infection.
Detection of sgRNAs and antigens can vary dramatically depending on specimen source [21] and storage conditions [12], symptom presence and severity at the time of sampling [24], patient demographics, and overall medical history [13]. Prolonged detection of sgRNA in patient specimens has been documented [21,25] and thus does not implicate contagiousness with certainty; our results affirm sgRNA can be detected in Cx− specimens. One explanation for the perpetual detection of these RNAs has attributed structural stability and nuclease resistance acquired through viral replication in or on double-membrane vesicles [26,27]. However, extended or recurrent sgRNA detection has been reported in immunocompromised individuals and therefore can be a sign of a persistent, active infection [28,29]. As an alternative to RT-PCR, rapid antigen tests (RATs) have several advantages: rapid time to result, scalability, low cost, and potential superiority in identifying infectious individuals [30]. While not a direct comparison, the correlation between Ag+ results by enzyme-linked immunosorbent assay (ELISA) and successful viral culture we observed, and that which is in the literature [31,32], supports the use of RATs in epidemiological surveillance. Because most diagnostic tests only offer a binary response to a temporally important question (when considering infectiousness), serial testing with RATs can increase the confidence a person is uninfected, while avoiding the resource-intensive requirements associated with RT-PCR testing. However, the high frequency of Cx−/Ag+ specimens we observed highlights the need to perform head-to-head assessments of the various tests available on the market, especially as variants continue to emerge.
The presented data should be interpreted with the following caveats. First, the assays described were designed at the beginning of the pandemic and may not work perfectly for all variants. This assay has been further validated to detect gRNA (orf1ab) and sgRNA targets (sgS and sgN) using cell culture–propagated Delta (B.1.617.2) and Omicron (B.1.1.529) variants and a small number of clinical specimens (data not shown). However, reevaluation with a larger pool of clinical specimens must be performed on novel variants to establish the correlation and predictive values for virus isolation in cell culture. Second, all study participants were naive to SARS-CoV-2; vaccines were unavailable and daily cases had not exceeded 75 000 per day in the US [33]. A comprehensive analysis monitoring sgRNA levels by variant, or in vaccine-breakthrough or secondary reinfection cases, is yet to be completed. Longitudinal studies that took place early during the pandemic can offer a unique baseline for comparing the changing kinetics of SARS-CoV-2 variants. We speculate that classifying vaccine-breakthrough or reinfection cases may benefit from using more than one sgRNA target to identify bona fide viral replication. Future studies may consider performing similar analyses to what is described in Figure 3 to identify symptoms, fluctuations in RNA levels, or the presence of antigen that are variant specific.
Supplementary Data
Supplementary materials are available at Clinical Infectious Diseases online. Consisting of data provided by the authors to benefit the reader, the posted materials are not copyedited and are the sole responsibility of the authors, so questions or comments should be addressed to the corresponding author.
Notes
Acknowledgments. The authors extend their gratitude to participants who willingly self-sampled for the duration of this study, Centers for Disease Control and Prevention (CDC) staff and personnel for their continued support during the COVID-19 pandemic, and the physicians and other public health professionals responsible for educating, testing, treating, and tracing infected persons.
Disclaimer. The findings and conclusions in this report are those of the authors and do not necessarily represent the official position of the CDC.
Financial support. This work was funded and supported by the CDC COVID-19 Emergency Response (payment to institution).
References
Author notes
Potential conflicts of interest. C. G. G. has received grants or contracts from Campbell Alliance/Syneos Health, Sanofi, CDC, Agency for Healthcare Research and Quality, National Institutes of Health, and US Food and Drug Administration (all payments made to institution), as well as consulting fees from Merck, Pfizer, and Sanofi-Pasteur (all payments to author). N. H. reports grants or contracts from Sanofi (grant support, vaccine donation, hemagglutination inhibition assay and viral microneutralization assay) and Qidel (grant support, Sofia testing/kit donation). All other authors report no potential conflicts of interest.
All authors have submitted the ICMJE Form for Disclosure of Potential Conflicts of Interest. Conflicts that the editors consider relevant to the content of the manuscript have been disclosed.

