


Abstract
Cruise travel contributed to severe acute respiratory syndrome coronavirus 2 (SARS-CoV-2) transmission when there were relatively few cases in the United States. By 14 March 2020, the Centers for Disease Control and Prevention (CDC) issued a No Sail Order suspending US cruise operations; the last US passenger ship docked on 16 April.
We analyzed SARS-CoV-2 outbreaks on cruises in US waters or carrying US citizens and used regression models to compare voyage characteristics. We used compartmental models to simulate the potential impact of 4 interventions (screening for coronavirus disease 2019 (COVID-19) symptoms; viral testing on 2 days and isolation of positive persons; reduction of passengers by 40%, crew by 20%, and reducing port visits to 1) for 7-day and 14-day voyages.
During 19 January to 16 April 2020, 89 voyages on 70 ships had known SARS-CoV-2 outbreaks; 16 ships had recurrent outbreaks. There were 1669 reverse transcription polymerase chain reaction (RT-PCR)-confirmed SARS-CoV-2 infections and 29 confirmed deaths. Longer voyages were associated with more cases (adjusted incidence rate ratio, 1.10, 95% confidence interval [CI]: 1.03–1.17, P < .003). Mathematical models showed that 7-day voyages had about 70% fewer cases than 14-day voyages. On 7-day voyages, the most effective interventions were reducing the number of individuals onboard (43.3% reduction in total infections) and testing passengers and crew (42% reduction in total infections). All four interventions reduced transmission by 80.1%, but no single intervention or combination eliminated transmission. Results were similar for 14-day voyages.
SARS-CoV-2 outbreaks on cruises were common during January–April 2020. Despite all interventions modeled, cruise travel still poses a significant SARS-CoV-2 transmission risk.
Returning cruise travelers contributed to the seeding of severe acute respiratory syndrome coronavirus 2 (SARS-CoV-2) throughout the United States during the acceleration phase of the pandemic [1]. Moriarty et al (2020) estimated that during 3 February to 13 March 2020, cruise ships accounted for 17% of reported US SARS-CoV-2 cases [2].
Nearly 30 million passengers are transported on approximately 270 cruise ships worldwide each year [3]. Before the onset of the pandemic, the cruise industry was an important contributor to the global economy, employing an estimated 1.1 million people worldwide [3]. Cruise travel facilitates the introduction and spread of respiratory viruses because of close indoor proximity and intensive social interaction of ever-changing cohorts of passengers at meals, bars, restaurants, and entertainment venues. Passengers and crew originate from diverse geographic regions and disembark multiple times during a voyage [4]. Crew remain onboard from one voyage to another, potentially seeding outbreaks across multiple voyages. Some cruise passengers are at higher risk for severe coronavirus disease 2019 (COVID-19) because of older age or comorbid conditions [5, 6].
Between February and March 2020, over 800 confirmed SARS-CoV-2 cases and 10 deaths were reported among travelers on 3 ships [2]. During that time, the cruise industry employed mitigation strategies such as the cancelation of group activities, screening for symptoms of COVID-19, and onboard quarantine of all passengers and nonessential crew to prevent further transmission. On 8 March, the Centers for Disease Control and Prevention (CDC) issued guidance to defer worldwide cruise ship travel [2]. By 14 March, CDC issued a No Sail Order (NSO) to suspend passenger operations on cruise ships under US jurisdiction [2]. The NSO was extended on 15 April, 16 July, and 30 September [7]. On 30 October, CDC issued a Framework for Conditional Sailing Order (CSO), outlining a phased approach for the resumption of passenger operations [8]. On 2 April 2021, CDC released technical instructions for cruise lines to establish agreements at ports to ensure the necessary infrastructure is in place to manage SARS-CoV-2 outbreaks. Following these agreements, cruise lines will conduct simulated voyages to allow crew and seaport personnel to practice new COVID-19 operational procedures before sailing with passengers [9]. Passenger operations on cruises with more than 250-person capacity in US waters remain prohibited.
Given that at least 50% of SARS-CoV-2 infections can be attributed to infected individuals without symptoms [10], screening for symptoms and temperature checks alone may be inadequate tools for identifying infected travelers. Testing of asymptomatic individuals onboard cruise ships [11] might be an important mitigation step for cruise travel, as has been shown in other congregate settings such as universities [12]. A previous compartmental model evaluated the effect of removal and isolation of symptomatic persons and ship-wide quarantine onboard the Diamond Princess [13], but to our knowledge, there have been no published systematic summaries of SARS-CoV-2 outbreaks and multiple intervention strategies on cruise ships.
We summarize known outbreaks of SARS-CoV-2 on cruise ships under US jurisdiction or those carrying American passengers during January–April 2020. We used compartmental models to evaluate interventions that might decrease SARS-CoV-2 transmission during cruise travel including symptom screening, viral testing on multiple days with symptom screening, reduction of passengers and crew, and reducing ports of call.
METHODS
Definitions
For the descriptive and statistical analyses, cruise ships were defined as individual vessels. Voyages (or cruises) were defined as journeys taken by cruise ships. Multiple voyages can be made by the same cruise ship. We included voyages that either fell under US jurisdiction (docking in a US port) or were carrying US citizens during the period of interest, 19 January to 16 April. This period was chosen because it included the first confirmed cases of SARS-CoV-2 onboard a ship (the World Dream) and the last passenger cruise to dock in a US port after issuance of the NSO (the Pacific Princess) [14].
A confirmed ship or voyage had at least 1 individual who tested positive for SARS-CoV-2 (via real-time reverse transcription-polymerase chain reaction [RT-PCR]) while onboard or within 14 days of travel. A single confirmed case of COVID-19 occurring on a voyage was considered to be an “outbreak” of the virus.
A confirmed case was defined as a person with a positive SARS-CoV-2 test confirmed by RT-PCR. Deaths were attributed to COVID-19 only when an RT-PCR test confirmed SARS-CoV-2 infection.
Data Collection
CDC quarantine stations were notified of COVID-19 cases by cruise ship clinicians under CDC’s regulatory authority [15] or by local and state health departments. Data from these reports were entered into the Quarantine Activity Reporting System (QARS), a secure electronic database used by quarantine station staff. CDC also received line lists of COVID-19 cases from cruise lines. Confirmed COVID-19 deaths were tallied from either QARS or from data directly reported to CDC from the cruise lines.
We determined start and end dates for passenger voyages using commercial sources available online (eg, cruisecal.com) and US Customs and Border Protection (CBP) data (voyage end dates for international ships visiting US ports) [14]. Data collected about each voyage included the number of passengers and crew (from CBP [14] or deidentified manifests provided to CDC), the arrival and departure ports, and the number of planned port calls. When voyage dates or routes were unclear, we verified information using other resources such as media reports or cruise line websites.
More detailed information, including the total number of individuals tested, was available for three voyages including the Diamond Princess, Greg Mortimer, and Grand Princess voyage B (the second outbreak on the Grand Princess) [2]. This information was directly reported to CDC from the cruise lines and was published in peer-reviewed literature or official reports [16–18].
For the compartmental models, we used deidentified data from the Grand Princess manifest to approximate passenger age distributions.
Descriptive and Statistical Analysis
We tallied the total number of confirmed voyages and RT-PCR-confirmed cases and noted when the same ship repeatedly experienced outbreaks on consecutive voyages. We mapped confirmed cases by disembarkation port.
For the 3 voyages with more detailed information, we calculated attack rates, infection fatality ratios, and corresponding exact binomial confidence intervals.
We ran mixed-effects negative binomial regression models to assess the correlations between number of cases per voyage and predictor variables (number of unique port stops planned, duration in days, sailing jurisdiction [US port vs international], and cruise line) with random intercepts for each ship. We calculated adjusted incidence rate ratios (AIRRs) with the ship’s maximum capacity included as an offset. The multivariable model with the lowest Akaike Information Criterion was selected as the final model.
Compartmental Models
SEAIR (susceptible-exposed-asymptomatic-infected/infectious-recovered) compartmental models were developed to simulate transmission on cruise ships. Presymptomatic transmission is denoted by the A compartment, and asymptomatic transmission is included in the I compartment. These models divide a host population into 5 “disease states” such that the combined sum of individuals from all states total the entire population (N = S + E + A + I + R) and have been used for modeling SARS-CoV-2 spread [13]. Supplementary materials shows the model equations.
Base Scenario and Intervention Models
We modeled 2 hypothetical voyages with 3500 individuals onboard (2400 passengers, 1100 crew), with 7- and 14-day durations. Contacts between people onboard were stratified by passenger age and crew type (passenger service crew vs vessel management crew) and were derived from previously published works [13, 19]. The outbreak was seeded with 30 asymptomatic infections (21 passengers, 9 crew); symptomatic passengers were excluded from boarding. This number of initial infections was chosen to reflect community transmission rates in Florida during June–July of 2020 [20]. (Approximately 0.8% of Florida’s population was infected with SARS-CoV-2 at the time, which translates to roughly 30 infected people on a ship of 3500 passengers and crew.) We included 4 ports of call for the 7-day voyage and 8 ports of call for the 14-day voyage. At each port, we assumed that 10 passengers became infected because these shore excursions involve some mixing with individuals in port communities. We calibrated our analysis to the Diamond Princess final attack rate (20%) [18], landing on a basic reproduction rate, R0, of 5.0. This estimate of R0 is based on the time period prior to the implementation of quarantine on the Diamond Princess. We assumed that 40% of infected people were asymptomatic, and that they were 75% as infectious as symptomatic individuals [21].
Four interventions with corresponding effectiveness assumptions (Supplementary Table 1) were evaluated:
i) Symptom Screening: Individuals were screened daily for symptoms of COVID-19 and isolated within the first day of symptom onset.
ii) Testing + Symptom Screening: In addition to symptom screening, 100% of asymptomatic people were tested. Testing occurred on days 0 (pre-embarkation) and 4 for the 7-day voyage and on days 0 and 8 for the 14-day voyage. Asymptomatic individuals with a positive SARS-CoV-2 test were isolated and removed from the population.
iii) Reduction of Passengers and Crew: The number of passengers was reduced by 40% and the number of service crew (who have high levels of contact with passengers) was reduced by 20%. Effective daily contact rate was reduced to 80% to simulate a best-case scenario for social distancing.
iv) One Port of Call: Visits to ports were limited to one per voyage.
We conducted a sensitivity analysis to determine how transmission is impacted by the proportion of asymptomatic people tested (a random sample of 25%–100%) and diagnostic test sensitivity (50%–100%). The latter was varied by time since infection, informed by data presented in He et al (2020) [22]. We also assessed how adherence to social distancing could influence transmission by varying effective daily contact rates, resulting in a reduction of R0 by 20%–50%.
Projected deaths were calculated by applying age-specific infection fatality ratios to the number of infected persons [21]. We estimated projected hospitalizations by applying the percent that die among those hospitalized to projected deaths [21].
The cumulative attack rate and the percent averted infections were used to compare the four individual interventions with a no-intervention scenario and a scenario where all interventions are implemented together.
Ethics Statement
This activity was reviewed by CDC and was conducted consistent with applicable federal law and CDC policy (see, eg, 45 C.F.R. part 46, 21 C.F.R. part 56; 42 U.S.C. §241(d); 5 U.S.C. §552a; 44 U.S.C. §3501 et seq.). Passenger-level data were deidentified and analyzed at the voyage-level.
RESULTS
SARS-CoV-2 Outbreaks on Cruise Ships
During 19 January to 16 April 2020, 89 voyages on 70 ships had RT-PCR-confirmed SARS-CoV-2 outbreaks; 16 ships had outbreaks on multiple voyages. There were 145 460 passengers and 59 619 crew on voyages with available data (Table 1). There were 1669 passengers and crew with RT-PCR-confirmed SARS-CoV-2 infections and 29 confirmed deaths on the 89 voyages.
Characteristics of 89 Cruise Ship Passenger Voyages on 70 Ships With Confirmed Cases of COVID-19 Onboard, February–April 2020
| Characteristics per Voyage | n | Mean | (SD) |
|---|---|---|---|
| Passengers on boarda | 145 460 | 2508 | (1357.9) |
| Crew on boarda | 59 619 | 1125 | (444.4) |
| n | Median | (IQR) | |
| Confirmed cases | 1669 | 2 | (5) |
| Confirmed deaths | 29 | 0 | (0) |
| Duration (days) | … | 7 | (5.3) |
| Ports of callb | … | 5 | (2) |
| % of ship capacity | … | 82.3% | (14.2) |
| Voyage jurisdiction | n | (%) | |
| Visited a US port | 47 | (52.8) | |
| Intl. jurisdiction | 42 | (47.2) | |
| Voyage deviation from planned route | n | (%) | |
| Yes | 22 | (24.7) | |
| No | 67 | (75.3) |
Abbreviations: COVID-19, coronavirus disease 2019; IQR, interquartile range; SD, standard deviation.
aPassenger data available for 57/89 voyages; crew data available for 52/89 voyages.
bPlanned ports of call.
The mean number of passengers per voyage was 2508 (range: 114–5791). Ships were filled to an average capacity of 82.3% (range: 28.9%–100%). The median voyage duration was 7 days (range: 2–30 days) and the median number of ports of call was 5 (range: 2–14 ports). The 89 voyages disembarked passengers in 22 different ports globally; 11 were in the United States (Figure 1). Five parent companies operated 56 (62.9%) of the 89 voyages.
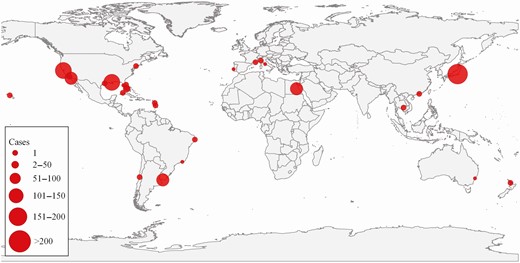
Number of confirmed COVID-19 cases on 89 cruise ship passenger voyages by port of disembarkation, February–April 2020. Plurality of the outbreaks detected returned to US ports (n = 11). Abbreviation: COVID-19, coronavirus disease 2019.
Among 3 ships with complete testing information, attack rates among passengers and crew ranged from 13.9% (159/1142) (Grand Princess voyage B) to 61.8% (134/217) (Greg Mortimer) (Table 2). Infection fatality ratios ranged from 0.8% (Greg Mortimer) to 3.1% (Grand Princess voyage B).
Confirmed COVID-19 Cases, Attack Rates, Deaths, and Infection Fatality Ratios for Three Cruise Ship Passenger Voyages, February–April 2020
| Voyage (Dates)a | Confirmed Cases/ Persons Tested | Attack Rate (95% CI) | Confirmed Deaths | Infection Fatality Ratio (95% CI) | n Onboard/ N Capacity (%) | Testing Strategyd | References |
|---|---|---|---|---|---|---|---|
| Greg Mortimer (15 March to 11 April) | 134/217b | 61.8% (54.9–68.3) | 1 | 0.8% (.02–4.1) | 217/ 234 (93%) | Universal testing of all passengers and crew. | [17] |
| Diamond Princess (20 January to 17 February) | 712/3711c | 19.2% (17.9–20.5) | 13 | 1.8% (1.0–3.1) | 3711/ 4200 (88%) | Near universal testing of passengers and crew. | [16, 18] |
| Grand Princess voyage B (21 February to 9 March) | 159/1142 | 13.9% (12.0–16.1) | 5 | 3.1% (1.0–7.2) | 3,571/4200 (85%) | Testing of a subset of passengers and crew. |
Abbreviations: CDC, Centers for Disease Control; CI, confidence interval; COVID-19, coronavirus disease 2019.
aDefined as date of embarkation to the date of disembarkation for a majority of passengers.
bThe number of confirmed cases reported to CDC from the Greg Mortimer was 134. Ing et al (2020) report 128 confirmed cases.
cThe number of confirmed cases reported by the Japanese Ministry of Health, Labour, and Welfare was 712 (13 confirmed deaths). Russell et al (2020) reported 696 confirmed cases and 7 deaths.
dTesting consisted of a novel coronavirus (nCOV) real-time reverse transcriptase polymerase chain reaction (RT-PCR) diagnostic panel. On the Greg Mortimer, VivaDiag qSARS-CoV-2 IgM/IgG rapid tests were initially used, and then later RT-PCR was used for all passengers and crew.
Statistical models showed that each additional day of a ship’s voyage resulted in a 10% increase in incidence per day (AIRR: 1.10, 95% confidence interval [CI]: 1.03–1.17, P = .003) after accounting for being under US jurisdiction in comparison with international voyages (AIRR: 0.10, 95% CI: .04–.29, P < .0001) (Table 3).
Mixed-effects Negative Binomial Regression Model Assessing the Correlations Between Number of Cases per Cruise Ship Voyage and Predictor Variables for 89 Voyages, February–April 2020.
| Variable (Reference Category) | Adjusted Incidence Rate Ratio (95% CI) | SE | P |
|---|---|---|---|
| Visited a US port (intl jurisdiction) | 0.10 (.04–.29) | 0.51 | <.0001 |
| Duration | 1.10 (1.03–1.17) | 0.03 | .003 |
| Variable (Reference Category) | Adjusted Incidence Rate Ratio (95% CI) | SE | P |
|---|---|---|---|
| Visited a US port (intl jurisdiction) | 0.10 (.04–.29) | 0.51 | <.0001 |
| Duration | 1.10 (1.03–1.17) | 0.03 | .003 |
The offset parameter used was the maximum ship capacity.
Abbreviations: CI, confidence interval; SE, standard error.
Intervention Models
With all interventions in place, there were about 70% fewer infections for the simulated 7-day voyage compared to the 14-day voyage (7-day voyage: n = 67 infections, cumulative attack rate = 2.9%; 14-day voyage: n = 225 infections, cumulative attack rate = 9.5%) (Supplementary Table 2). With no interventions in place, there were 337 infections for the 7-day voyage and 1516 infections on the 14-day voyage. These estimates serve as the baseline comparators for all intervention scenarios, described below.
7-Day Voyage
Reduction of passengers and crew was the most effective intervention (146/337, 43.3% total infections averted compared to the no-intervention scenario), followed by testing (on days 0 and 4) with daily symptom screening (144/337, 42.6% infections averted) and isolation of those who tested positive or developed symptoms, and limiting to a single port of call (70/337, 20.6% infections averted) (Table 4).
Number and Percent of Averted Infections, Hospitalizations, and Deaths for 7-Day and 14-Day Cruise Ship Voyages Based On Susceptible- Exposed-Asymptomatic-Infected/Infectious Recovered models.
| Intervention | 7-Day Voyage | 14-Day Voyage | ||||||||||
|---|---|---|---|---|---|---|---|---|---|---|---|---|
| Averted Infections | Averted Hospitalizations | Averted Deaths | Averted Infections | Averted Hospitalizations | Averted Deaths | |||||||
| n | (%) | n | (%) | n | (%) | n | (%) | n | (%) | n | (%) | |
| No intervention | … | … | … | … | … | … | … | … | … | … | … | … |
| One port of call | 70 | (20.8) | 3 | (23.1) | 1 | (33.3) | 289 | (19.1) | 19 | (27.5) | 4 | (25) |
| Symptom screening | 42 | (12.5) | 2 | (15.4) | 0 | (0) | 314 | (20.7) | 17 | (24.6) | 4 | (25) |
| Testing + symptom screening and isolationa | 144 | (42.7) | 5 | (38.5) | 1 | (33.3) | 628 | (41.4) | 32 | (46.4) | 7 | (43.8) |
| Reduction of passengers and crewb | 146 | (43.3) | 5 | (38.5) | 1 | (33.3) | 740 | (48.8) | 35 | (50.7) | 8 | (50) |
| All interventions | 270 | (80.1) | 10 | (76.9) | 2 | (66.7) | 1291 | (85.2) | 61 | (88.4) | 14 | (87.5) |
| (Total infections, no intervention) | 337 | … | 13 | … | 3 | … | 1516 | … | 69 | … | 16 | … |
Percentages represent the proportion of Averted infections, hospitalization, and deaths among all infections, hospitalizations, and deaths in the no-intervention scenario for each of the 2 voyage durations (shown in the final row of the table).
aTesting occurs on days 0 and 4 for the 7-day voyage and on days 0 and 8 for the 14-day voyage.
bTotal people onboard N = 2368. (For all other scenarios N = 3500.)
When all 4 interventions were in place, onboard incidence was reduced by 80.1% relative to the no-intervention scenario (Figure 2). The greatest number of averted hospitalizations (10/13, 76.9%) and averted deaths (2/3, 66.7%) were observed with all interventions in place.
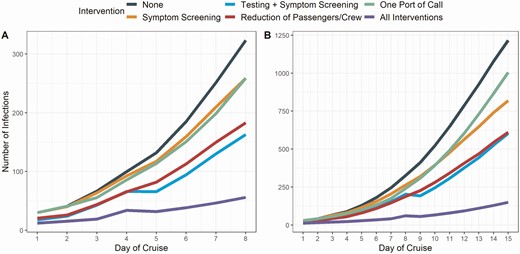
Effect of interventions on the number of COVID-19 cases identified onboard a cruise ship based on a susceptible-exposed-asymptomatic-infected/infectious recovered model, compared with no intervention. Modeled interventions included reducing the number of passengers and crew onboard, symptoms screening, symptom screening plus testing at embarkation and again during the voyage and limiting to a single port of call. A, Results for a 7-day voyage. B, Results for a 14-day voyage. In these graphs, we assumed 100% sensitivity of the diagnostic test, 100% of people onboard tested, and a 20% reduction in the number of daily contacts. Note that the y-axis scales for the 2 panels are different. Abbreviation: COVID-19, coronavirus disease 2019.
14-Day Voyage
Reduction of passengers and crew was the most effective intervention (740/1516, 48.8% infections averted) followed by testing (on days 0 and 8) with daily symptom screening (628/1516, 41.4% infections averted) and isolation. Symptom screening alone was slightly more effective (314/1516, 20.7% infections averted) than reducing to a single port of call (289/1516, 19.1% infections averted).
Sensitivity Analyses
On a 7-day voyage, when compared to the symptom screening intervention, testing all individuals on day 0 and 25% of the cruise ship population on day 4 averted 28.7% (85/296) of additional infections, whereas testing 100% of the ship population on day 4 averted 34.5% (102/296) of additional infections (Supplementary Tables 3 and 4). More infections were averted when the sensitivity of the diagnostic test was high. For example, when test sensitivity was 100%,34.5% (102/296) of infections were averted, whereas 50% test sensitivity resulted in 20.6% (61/296) infections averted when compared to symptom screening alone. Better adherence to social distancing and complete restricting of congregate events onboard also reduced transmission. When the number of daily contacts was reduced by 50%, 65.6% (221/337) of infections were averted.
DISCUSSION
During January–April 2020, 89 cruises reported SARS-CoV-2 outbreaks, which accounted for 1669 confirmed cases and 29 known deaths. At least 205 079 individuals sailed on these 89 voyages, raising the possibility that many more people were asymptomatically or mildly infected but went undetected because of limited testing of cruise ship passengers and crew at the time [17]. Immense public health resources, at the local, state, and federal levels, including two large federal quarantines [2], were devoted to the response to SARS-CoV-2 outbreaks on passenger voyages.
Cruise ships are more than just a mode of transport because of the amount of time spent onboard and congregation of large numbers of people in confined spaces. We observed high attack rates on cruises, ranging from 13.9% to 61.8%. Observed attack rates in other settings have included airplanes (ranging from 0.3% to 18% [23, 24]), schools (13% [25]), households (secondary attack rate = 19% [26]), and summer camps (44% [27]). The highest attack rate observed (61.8%) occurred on the Greg Mortimer, a ship with relatively few passengers (n = 217) and a single shared dining space. It is possible that the small size of the ship increased the likelihood of contact between travelers because of difficulty maintaining physical distancing. Importantly, the estimates of attack rates and infection fatality ratios were influenced by variable testing coverage, which ranged from universal testing (the Greg Mortimer) [17] to testing of only a few symptomatic passengers and crew; the high proportion of asymptomatic infections likely added to underreporting. In addition, asymptomatic individuals were only tested once, probably leading to missed infections and low estimates of attack rates. On the Grand Princess, over 56% of travelers declined testing after disembarkation and during federal quarantine (CDC unpublished data), resulting in a lower denominator and an artificially inflated case fatality ratio (and an artificially deflated attack rate). In addition to mortality, cruise ship outbreaks were also associated with substantial morbidity leading to hospitalizations. Surveillance at the time was unable to capture all hospitalizations and deaths associated with cruise SARS-CoV-2 outbreaks systematically, likely leading to an underreporting of true morbidity and mortality. Due to lag times in symptom development and disease progression, many hospitalizations and most deaths occurred after passengers disembarked. For example, in March 2020, the Coral Princess experienced a SARS-CoV-2 outbreak while sailing in South America. The ship finally docked in Miami, Florida, after having been turned away from several international ports. This outbreak resulted in at least 41 known hospitalizations in Florida and 4 deaths, including 2 deaths while at sea.
SARS-CoV-2 infections on cruise ships can also seed outbreaks in ports and in communities where passengers and crew live, particularly in regions where transmission is controlled or non-existent. 25 During 11 February to 5 March 2020, 101 Nile cruise travelers returned to 18 different US states and tested positive for SARS-CoV-2 infection, nearly doubling the number of reported COVID-19 cases at a time when there was little recognized community transmission [1]. Although introduction of virus by travelers is not thought to contribute significantly to transmission in communities with ongoing epidemics [28], surveillance and control of travel-associated SARS-CoV-2 remains critical as new variants of the virus are discovered [29].
Reducing SARS-CoV-2 transmission on cruise ships is complex. Our models showed that the greatest impact (80.1% transmission reduction) was observed when all four interventions (repeated testing with ongoing symptom screening and isolation, reduction of the numbers of passengers and crew, and limiting to only one port of call) were in place on a 7-day voyage, demonstrating the importance of a multipronged approach to combat transmission before, during, and after travel. Notably, no single intervention alone on either a 7- or 14-day voyage reduced transmission by more than 50%. Reducing the number of passenger and crew onboard and testing at embarkation and again during the voyage with symptom screening reduced cases by less than 45% for the 7-day and about 40–50% for 14-day voyages. Sensitivity analyses showed that reducing the number of passengers was most helpful if it allowed passengers and crew to maintain distance onboard. Testing at 2 time points was superior to isolating symptomatic persons, as it provided more opportunities to identify pre-symptomatic and asymptomatic infections. A combination of testing combined with other measures has successfully reduced transmission in other congregate settings [12, 30].
Since March 2020, CDC’s NSO successfully eliminated SARS-CoV-2 outbreaks among cruise passengers by prohibiting passenger operations and placing restrictions on crews on ships operating in waters under US jurisdiction. As recently as February 2021, cruise ships not covered by the NSO continued to have outbreaks, suggesting that mitigation measures currently in place (such as testing of passengers before boarding) were not sufficient to prevent SARS-CoV-2 outbreaks [31].When all measures were in place, we observed 70% fewer infections for 7 day voyages than 14 day voyages.
Our models did not consider the effects of vaccination as an additional layer of protection for cruise ship travel. Subsequent modeling indicates that travel-associated transmission risks should be substantially reduced among travelers who have been fully vaccinated with an effective vaccine [32]. However, cruise ship travel is more complex than other types of travel. The congregate setting with mixing of passengers and crew from many countries that have varying burdens of COVID-19, variable vaccination coverage rates with a variety of vaccines, and SARS-CoV-2 variants of concern will all likely impact the risk reduction afforded by vaccination on cruises. International passengers and crew may be vaccinated with non-FDA or non-WHO authorized vaccines, and these vaccines may not have the same effectiveness against infection as those vaccines studied in the travel risk reduction models. As vaccination expands but access and uptake remain uneven globally, maintenance of a layered approach as we describe is still warranted. Further modeling efforts are underway to determine appropriate vaccination thresholds for cruises, considering the aforementioned complexities.
Some limitations of this analysis should be noted. Surveillance was variable during the time of outbreaks on passenger-carrying ships and relied on passive reporting from either cruise lines or state and local health departments. Since then, CDC has implemented an enhanced surveillance system [33] to capture information about suspected and confirmed COVID-19 cases that occur among crew who are maintaining ships while passenger operations remain prohibited. Voyage-level data extracted for each ship (duration, number of stops) may not be accurate, as we relied on online resources for this information. We did not assess mask wearing in this analysis as effectiveness would be variable in this setting because masks are not worn during many activities such as eating, swimming, and in cabins where most transmission occurs [6]. Our compartmental model is deterministic and did not take into consideration differences among cruise outbreaks, such as passenger demographics, number boarding individuals in exposed, asymptomatically or pre-symptomatically infected, or symptomatic states, and the number of super-spreading events. Therefore, our model is not meant to predict the magnitude of any cruise ship outbreak, and the results should be considered qualitatively rather than for forecasting purposes.
Mitigation of SARS-CoV-2 transmission associated with cruise travel will require multiple, layered interventions before, during, and after travel, including reduction of passenger and crew population sizes, limiting the number of ports visited, shorter cruises, repeated testing at embarkation and during the voyage, symptom screening with onboard isolation, contact tracing, and quarantine of contacts as appropriate. Vaccination, another important tool to control SARS-CoV-2 transmission, should be incorporated into prevention efforts. Even with stringent control measures in place, the risk of COVID-19 onboard cruise ships cannot be eliminated while there is sustained community transmission; cruise travel should be avoided until the pandemic is controlled.
Supplementary Data
Supplementary materials are available at Clinical Infectious Diseases online. Consisting of data provided by the authors to benefit the reader, the posted materials are not copyedited and are the sole responsibility of the authors, so questions or comments should be addressed to the corresponding author.
Notes
Acknowledgements. The authors thank their CDC colleagues who contributed to the cruise ship response or provided data needed for the model including Leah Moriarty, Mateusz Plucinski, Paul Weidle, Nicki Pesik, and Nicole J. Cohen. The authors also thank US Customs and Border Protection (CBP) for providing data about cruise arrivals at US ports.
Disclaimer. The findings and conclusions in this report are those of the authors and do not necessarily represent the official position of the Centers for Disease Control and Prevention.
Financial support. This work was supported by the Centers for Disease Control and Prevention.
Potential conflicts of interest. The authors: No reported conflicts of interest. All authors have submitted the ICMJE Form for Disclosure of Potential Conflicts of Interest. Conflicts that the editors consider relevant to the content of the manuscript have been disclosed.

