


Abstract
Understanding the role of children in severe acute respiratory syndrome coronavirus 2 (SARS-CoV-2) transmission is critical to guide decision-making for schools in the pandemic. We aimed to describe the transmission of SARS-CoV-2 among children and adult staff in summer schools.
During July 2020, we prospectively recruited children and adult staff attending summer schools in Barcelona who had SARS-CoV-2 infection. Primary SARS-CoV-2 infections were identified through (1) a surveillance program in 22 summer schools of 1905 participants, involving weekly saliva sampling for SARS-CoV-2 reverse-transcription polymerase chain reaction (RT-PCR) during 2–5 weeks; and (2) cases identified through the Catalonian Health Surveillance System of children diagnosed with SARS-CoV-2 infection by nasopharyngeal RT-PCR. All centers followed prevention protocols: bubble groups, handwashing, face masks, and conducting activities mostly outdoors. Contacts of a primary case within the same bubble were evaluated by nasopharyngeal RT-PCR. Secondary attack rates and the effective reproduction number in summer schools (Re*) were calculated.
Among the >2000 repeatedly screened participants, 30 children and 9 adults were identified as primary cases. A total of 253 close contacts of these primary cases were studied (median, 9 [interquartile range, 5–10] for each primary case), among which 12 new cases (4.7%) were positive for SARS-CoV-2. The Re* was 0.3, whereas the contemporary rate in the general population from the same areas in Barcelona was 1.9.
The transmission rate of SARS-CoV-2 infection among children attending school-like facilities under strict prevention measures was lower than that reported for the general population. This suggests that under preventive measures schools are unlikely amplifiers of SARS-CoV-2 transmission, supporting current recommendations for school opening.
The first wave of the coronavirus disease 2019 (COVID-19) pandemic enforced school closures globally, by the end of March 2020 affecting 1.6 billion children and teenagers, 80% of the world’s enrolled students, who could not physically attend school in 161 countries [1, 2]. This measure was a consequence of the general belief that quarantine reduces dramatically the incidence and mortality during infectious diseases epidemics [3–5]. However, lockdown has direct and indirect harmful effects on children, limiting not only their academic learning but also other wider benefits, including the possibility to relate and play with their peers and learn from their teachers [6]. Social disparities widened because not all households have the necessary digital resources for home schooling [7, 8].
As COVID-19 is almost always mild in children [9–12], and, unlike other respiratory viral infections, the rates of transmission among children seem to be lower than those described in adults [13–16], the majority of countries have decided to reopen schools after the COVID-19 lockdown [17]. In general, guidelines for reopening have recommended prevention measures. Despite the wide adoption of such policies, there remains a lack of evidence as to whether, in these settings, children have the same, higher, or lower transmission rates of severe acute respiratory syndrome coronavirus 2 (SARS-CoV-2) as compared with adults [1, 2, 16, 18]. Answering this question is fundamental to inform evidence-based strategies for school opening, particularly in the event of new outbreaks. Summer schools can be a good model to reproduce the conditions of a school setting.
During July 2020 in the city of Barcelona, Spain, summer camps were allowed to open under stringent prevention protocols established by the Catalonian Health Department. The aim of this prospective study was to describe the transmission of SARS-CoV-2 among children and adult staff attending summer camps during July 2020.
METHODS
Study Description and Ethics Approval
We conducted a prospective study including children and adult staff attending summer schools in the Barcelona Metropolitan Region, Spain. The study period spanned 5 weeks, from 29 June to 31 July 2020. Children aged 3–15 years and staff of any age (≥16 years) working at the same facilities and having direct contact with children were considered eligible. Families were excluded if they did not consent to take part or if they were unwilling to ensure adequate follow-up.
Recruitment Pathways
The main goal of the study was to recruit children with SARS-CoV-2 infection who attended a school-like facility, therefore potentially acting as index cases in these settings. Cases were identified and recruited through 2 pathways. The first recruitment pathway (RP1) was an active surveillance cohort study in 22 summer schools, consisting of longitudinal follow-up of a large number of children and accompanying adult staff with weekly screening for SARS-CoV-2 infection. A baseline saliva sample for reverse-transcription polymerase chain reaction (RT-PCR) analysis was obtained at enrollment and subsequently repeated on a weekly basis for as long as the child remained in the summer school. In one of the summer camps, paired nasopharyngeal (NP) samples were also taken. For each summer school campus, data on the specific preventive measures implemented were confirmed using standardized questionnaires.
The second recruitment pathway (RP2) included cases identified by the Catalonian Health Surveillance System of SARS-CoV-2 infection diagnosed by NP RT-PCR while attending other summer schools or children’s foster homes in the area of Barcelona. These included children who were tested for SARS-CoV-2 PCR based on symptoms or because of a positive contact case.
In all these facilities, children were organized in subgroups (bubbles) of 8–14 children. Additional preventive measures included frequent handwashing, face-mask wearing (mandatory for children >6 years, and recommended outside) and conducting most activities outdoors.
For both recruitment pathways, once a potential index case was identified by a positive RT-PCR result from saliva or NP swab, the child was considered a potential index case. In those providing consent, a questionnaire for COVID-19 symptoms was completed and a blood sample for anti–SARS-CoV-2 antibodies was taken to rule out past infection. Subsequently, all children and staff members who were close contacts of the index case were asked to participate in the study. Evaluation of close contacts included a questionnaire for COVID-19 symptoms and NP swabbing for RT-PCR at 0, 7, and 14 days, and serology testing at 0 and 5 weeks.
Outcomes
The primary outcome of the study was to determine children’s and adults’ index cases rates of transmission to other children and adults, based on rate of infected contacts and reproduction number.
The secondary attack rate (SAR) was defined as the ratio (number of secondary infections) / (number of contacts evaluated).
Additionally, we aimed at comparing the transmission rate inside the summer schools with that observed in the general population from communities surrounding the summer schools during the same period (the method used is described in the Supplementary Data). While the reproduction number is generally used to estimate transmission rates in the general population, previous studies [19] have evaluated transmission inside households using a household effective reproduction number (Re*), which is defined as the average number of households infected by each infected household. Analogously, we defined the effective reproduction number in summer schools (Re*) as the average number of participants infected by each index case:
By definition, the reproduction number in the general population (Re) describes the transmission occurring at any time during a given time period. However, children spent only 8 hours during weekdays in summer schools, which could result in a falsely low reproduction number as compared to that occurring in the general population (exposed theoretically during a longer period/day, ie, 24 hours). Therefore, we defined a renormalized effective reproduction number in summer schools () to allow comparison with that in the general population, using the ratio of hours in the summer school in a week as a factor.
We assumed that participants spent around 40 hours a week in the summer school, which represents 24% of the 168 hours in a week.
Statistical Analysis
Sample Size Calculation
Sample size was estimated on 1 June 2020 using epidemiological data from Portal de Transarència (https://analisi.transparenciacatalunya.cat/). The Universitat Politècnica de Catalunya team developed a method to estimate real incidence in regions [20], using the methodology described in https://www.medrxiv.org/content/10.1101/2020.05.01.20087023v1, which was validated by the Instituto Salut Carlos III in results of the seroprevalence study in Spanish regions (https://portalcne.isciii.es/enecovid19/) and was also utilized for the sample size calculation. Detailed sample size calculations are described in the Supplementary Text and Supplementary Table 1.
Analytical Plan
The χ 2 test was used for comparisons of categorical data and Student t test or Mann–Whitney U test for quantitative variables, according to the normal or nonnormal distribution. To compare the epidemiologic and microbiologic results at the different diagnostic times, the Wilcoxon signed-rank test was used to compare paired numerical data. Index cases (diagnosed by PCR and or seroprevalence conversion) and transmission rates by reproduction number in summer schools (Re*) were calculated. SPSS version 22.0 statistical package (SPSS IBM, Armonk, New York) and R program were used.
RESULTS
Description of the Study Population
For the active surveillance group, 49 campuses were originally selected, with 22 summer schools (located at 27 different venues) finally enrolled into the study, accounting for a total of 1905 participants to be followed in the RP1, of whom 1509 were children. A total of 5240 saliva samples were taken. The total number of index cases was 12, including 9 (75.0%) children and 3 (25.0%) adults.
Additionally, newly index cases were also derived from 18 summer schools coming from the Catalonian Health surveillance systems, and also from one foster center, accounting 960 summer school attendings (84.3% of children). The total number of referred index cases was 27, including 21 (77.8%) children and 6 (22.2%) adults.
Index Cases
Altogether, 39 index cases were identified, including 30 children and 9 adults in the study. Overall PCR screening results per week from the RP1, and calculated incidences, are described in Table 1 (both for children and adult staff). From this active surveillance, 17 PCR-positive cases were reported at 8 different centers. Of those, 12 were confirmed as index cases, coming from 8 centers (9 children and 3 adult staff). The rest of individuals, all adults, with a positive PCR result (n = 5) also had a positive immunoglobulin G (IgG) serology, being therefore considered past SARS-CoV-2 infections. The reinfection possibility was excluded because participants did not present new symptomatology or changes in the serology result after 5 more weeks of monitoring by the study protocol.
Overall Polymerase Chain Reaction Screening Results per Week (Includes Children and Staff) and Calculated Incidence From Recruitment Pathway 1
| Type of PCR Screening Test | Week 1 | Week 2 | Week 3 | Week 4 | Week 5 | Total (Weeks 1–5) |
|---|---|---|---|---|---|---|
| Saliva, No. (%) | ||||||
| Total | 531 | 1600 | 1473 | 1094 | 542 | 5240 |
| Positive | 1 (0.2) | 3 (0.2) | 1 (0.07) | 4 (0.4) | 3 (0.6) | 12 (0.2) |
| Negative | 524 (98.7) | 1589 (99.3) | 1471 (99.9) | 1090 (99.6) | 538 (99.3) | 5212 (97.7) |
| Indeterminate | 1 (0.2) | 0 (0) | 1 (0.07) | 0 (0) | 1 (0.2) | 3 (0.06) |
| NA | 5 (0.9) | 8 (0.5) | 0 (0) | 0 (0) | 0 (0) | 13 (0.2) |
| Nasopharyngeala, No. (%) | ||||||
| Total | 181 | 136 | 131 | 92 | 40 | 580 |
| Positive | 2 (1.1) | 1 (0.7) | 1 (0.8) | 1 (1.1) | 0 (0) | 5 (0.9) |
| Negative | 177 (97.8) | 133 (97.8) | 130 (99.2) | 89 (96.7) | 40 (100) | 569 (98.1) |
| Indeterminate | 1 (0.5) | 1 (0.7) | 0 (0) | 2 (2.2) | 0 (0) | 4 (0.7) |
| NA | 1 (0.5) | 1 (0.7) | 0 (0) | 0 (0) | 0 (0) | 2 (0.3) |
| Calculated summer camps, overall incidence per 100 000 | 187.97 | 187.50 | 67.89 | 365.63 | 553.51 | 630.00 |
Abbreviations: NA, cannot be assessed; PCR, polymerase chain reaction.
aNasopharyngeal samples were done paired with saliva samples for saliva verification.
Two of these 5 cases were the only ones who had a PCR-negative saliva result, representing 0.3% of the 580 saliva samples analyzed in the summer camp, in which it was analyzed in parallel to NP swabs. Because both cases had an IgG-positive serology, these results were not considered false-negative saliva PCR, but rather past SARS-CoV-2 infections with NP PCR persistence.
The incidence per week and the expected vs observed cases according to the underlying neighborhood incidence, in the active surveillance group, are presented in Figures 1 and 2, respectively.
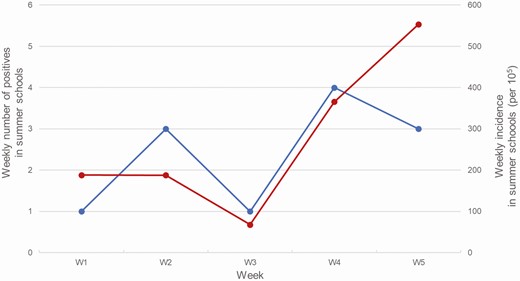
Weekly positive samples (black) and weekly incidence (gray) among sampled individuals in the summer schools (recruitment path 1).
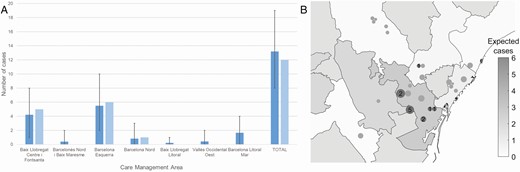
Expected (dark gray) and detected (light gray) cases in the summer schools of each Care Management Area (CMA), according to the incidence among general population and assuming a diagnostic rate in general population of 30%. Expected cases and their margins were computed considering the cases detection as a binomial variable with estimated incidence as probability. In all care management areas, observations fell within the 90% margins of expected cases. P values expected/detected cases were: Baix Llobregat Centre i Fontsanta P = .701; Barcelonès Nord i Baix Maresme P = .527; Barcelona Esquerra P = .827; Barcelona Nord P =.838; Baix Llobregat Litoral i Sant Boi P = .640; Vallès Occidental Oest P = .518; Barcelona Litoral Mar P =.198. Geographical distribution of summer schools in health care assistance areas. Each circle represents one summer school, with its diameter proportional to square root of sampled individuals. In dark gray, those summer schools where cases were found, the number indicating the detected cases. Background grayscale indicate expected cases in each health care assistance area.
Supplementary Tables 2–4 describe general data about the summer schools. Of note, the number of caregivers per day was higher in summer schools with no index cases than in those where index cases were detected (P = .0059).
Analysis of the Dynamics of SARS-CoV-2 Transmission in Active and Passive Surveillance Branches of the Study
The study team identified 253 summer camp contacts from all the index cases, 230 (90.1%) of whom agreed to participate in the study and provided samples. None of the 23 contacts who did not participate in the contact study were confirmed to become infected after our summer school study was finished. We concluded it because no new infections were reported from the schools.
From all contacts, 87 came from RP1 (34.4%) and 166 (65.6) from RP2; only 6 (3.6%) cases comprised the passive surveillance pathway–symptomatic.
The mean number of contacts studied for each positive case was 9 (interquartile range [IQR], 5–10). The group’s mean size was 9.4 (IQR, 7–10). Among all contacts, 12 (4.7%) were subsequently confirmed to have become infected, with an Re* of 0.3 and a renormalized reproduction number in summer schools () of 1.3. Index cases transmitted the infection to a different number of contacts (Figure 3). No secondary transmission was observed from 22 (73.3%) of child index cases. The transmission was child to child in 9 cases, child to adult in 1 case, and adult to child in 2 cases. There were 15 of 30 (50%) asymptomatic cases in children, and 3 of 6 (50%) asymptomatic cases in adults. There were no significant differences in children’s transmission capability with respect to being symptomatic (P = .815).
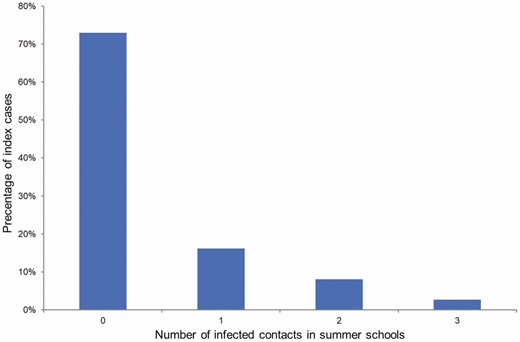
Distribution of the number of infected contacts per index case.
The number of contacts evaluated per index case, both in total and also among children <18 years of age, is presented in Tables 2 and 3. Table 4 describes the different reproduction number in summer schools (Re*) depending on the recruitment pathway and age, whereby no differences were found. The reproduction number among the general population (R) during the 5 weeks of the study, a period during which various outbreaks occurred, ranged between 1.7 and 2 (Figure 2).
Number of Contacts Evaluated per Index Case, by Age Category
| Cases | Total Index Cases, No. | Total Contacts, No. | Total Positive Contacts, No. | Contacts/Index |
|---|---|---|---|---|
| Adults | ||||
| Total | 9 | 114 | 3 | 12.66 |
| Recruitment pathway 1 | 5 | 63 | 1 | 12.60 |
| Recruitment pathway 2 | 4 | 51 | 2 | 12.75 |
| Children (<18 years old) | ||||
| Total | 30 | 253 | 12 | 8.43 |
| Recruitment pathway 1 | 9 | 89 | 1 | 9.89 |
| Recruitment pathway 2 | 21 | 164 | 11 | 7.80 |
Total Secondary Attack Rate and Effective Reproduction Number in Summer Schools, From Both Recruitment Pathways
| SAR, % | Re* | |||
|---|---|---|---|---|
| Pathway | Overall | From Children Only | Overall | From Children Only |
| Total | 4.09 | 4.74 | 0.38 | 0.40 |
| Recruitment pathway 1 | 1.31 | 1.23 | 0.17 | 0.11 |
| Recruitment pathway 2 | 6.07 | 6.70 | 0.48 | 0.52 |
| SAR, % | Re* | |||
|---|---|---|---|---|
| Pathway | Overall | From Children Only | Overall | From Children Only |
| Total | 4.09 | 4.74 | 0.38 | 0.40 |
| Recruitment pathway 1 | 1.31 | 1.23 | 0.17 | 0.11 |
| Recruitment pathway 2 | 6.07 | 6.70 | 0.48 | 0.52 |
Abbreviations: Re*, effective reproduction number in summer schools; SAR, secondary attack rate.
Secondary Attack Rate and Effective Reproduction Number in Summer Schools Among Different Recruitment Pathways, and Differences Between Ages
| Index Case Age Group | ||||
|---|---|---|---|---|
| Transmission Variable | Age Category | 0–10 y (n = 16) | 11–17 y (n = 14) | Adult Staff (n = 9) |
| 0–12 y | 5.26% (8/152) | 4.00% (1/25) | 1.64% (1/61) | |
| 13–17 y | 0 (0/2) | 6.90% (2/29) | 11.76% (2/17) | |
| Adult staff | 2.7% (1/37) | 0 (0/8) | 0 (0/36) | |
| 0-12 y | 0.38 | 0.11 | 0.11 | |
| 13–17 y | … | 0.22 | 0.22 | |
| Adult staff | 0.05 | … | … | |
Table represents the transmission detected in the school-like environment, stratified by 3 age groups: 0–12, 13–17, ≥18 years.
Abbreviations: Re*, effective reproduction number in summer schools; SAR, secondary attack rate.
When summer schools’ characteristics were compared, according to the confirmation of transmission in their premises, a significantly higher outdoor surface area was found in those where no transmission occurred (P = .0036); once corrected by the total number of children and adults, logistic regression showed a P for trend = .064. With respect to SARS-CoV-2 prevention measures, frequent handwashing was the only variable that was associated with a lower SAR (P = .024). These data are shown in Table 5.
Summer Schools Characteristics, According to the Confirmation of Transmission in Their Premises
| Variable | All Campuses (n = 41) | Campuses Where Contagion Occurred (n = 7) | Campuses With No Contagion (n = 34) | P Value |
|---|---|---|---|---|
| No. of children/day | 76 (55–120) | 60 (42.00–67) | 88.5 (57.75–120) | .0890 |
| No. of adult staff/day | 13.5 (10–20) | 10 (9–13) | 15 (11–20) | .2224 |
| No. of caregivers/day | 12 (9–15) | 9 (7.5–12) | 12 (9–15) | .4449 |
| Ratio of children to caregiver | 10 (9–10) | 10 (7–10) | 10 (9–10) | .4853 |
| Indoor surface area, m2 | 685 (347–1312.5) | 600 (350–670) | 756 (359–1375) | .5368 |
| Outdoor surface area, m2 | 525 (220–2125) | 93 (21–145) | 838 (240–2500) | .0036 |
| No. of communal use toilets | 6 (5–12) | 4 (2–9) | 6.5 (5–12) | .1802 |
| Activities conducted outdoors, % | 70 (60–80) | 60 (35–77.5) | 70 (67–80) | .2702 |
| Compulsory use of masks indoors, No. (%) | 35 (85.4) | 7 (100) | 28 (82.4) | .229 |
| Assessed compliance with indoor mask wearing (0–10 scale) | 8 (7–9) | 8 (7.5–8.5) | 8 (7–9) | .9 |
| Compulsory use of masks outdoors, No. (%) | 24 (60) | 4 (66.7) | 20 (58.8) | .7176 |
| Assessed compliance with outdoor mask wearing (0–10 scale) | 8 (6–9) | 9 (7.5–9.75) | 8 (6–9) | .2738 |
| Handwashing frequency, No. (%) | .0030 | |||
| >5 times/day | 26 (63.4) | 1 (14.3) | 25 (73.5) | |
| <5 times/day | 15 (36.6) | 6 (85.7) | 9 (26.5) | |
| Presence of hydroalcoholic gel dispensers on site, No. (%) | 40 (100) | 7 (100) | 33 (100) |
Data are presented as median (interquartile range) unless otherwise indicated.
DISCUSSION
This study prospectively assessed the risk of SARS-CoV-2 transmission in school-like environments implementing prevention measures. We found that, in these conditions, transmission rates to other children and adults were low. We estimated an effective reproduction number in summer schools of Re* = 0.3. This transmission rate below 1 suggests that summer schools did not act as amplifiers of the pandemic. During the study period, the community effective reproduction number (Re) was around 1.9 in the surrounding areas, which were following a sustained growth. We acknowledge that the comparison between the 2 indices is not straightforward, because children spent only 24% of the hours in a week in summer schools (8 hours on weekdays). Nevertheless, we believe that the renormalized reproduction number as used in this study can be used as a proxy for a rough comparison. This renormalization provides a value of , which remains lower than that in the community.
We believe that the criteria used for calculating the renormalized reproduction number in summer schools is conservative. For instance, we did not consider in the time ratio that children spend a significant number of hours sleeping in a room either alone or with a close relative at home. In addition, the average number of social interactions is probably higher during the time at the summers school as compared to the rest of the day. Both factors would even reduce the renormalized reproduction number in summer schools. Therefore, the transmission inside summer schools was similar or lower than the transmission among the general population in that period of time.
Our results are in agreement with previous studies [21–23] suggesting that children were not primary drivers of SARS-CoV-2 transmission in schools in the setting of low community prevalence. Studies reporting transmission rates in Switzerland, Ireland, and Australia during the first months of the Covid-19 pandemic in early 2020 reported lower transmissions rates than those observed for other respiratory viruses, such as influenza [24]. Similar data are shown in other reports in which the pediatric transmission rate was very low and did not point to children as the main culprits of COVID-19 transmission [9]. Other studies described outbreaks initiated at schools or school-like environments in Israel or the United States [25]. These outbreaks generally occurred in conditions of high and rapidly increasing community prevalence, close contact, and absence of preventive measures [1, 2, 16]. A frequent concern is the underdetection of transmission of SARS-CoV-2 in school-like settings due to the frequency of asymptomatic infection. This study represents the first prospective study evaluating transmission rates in school-like environments with routine, asymptomatic testing that implemented protocols for prevention of COVID-19 transmission. Our results provide evidence to support the notion that, in these circumstances, the transmission rates among children attending schools are low, even accounting for asymptomatic transmission. Secondary infection rates in this study were similar among children and adults. In contrast, several studies have reported higher rates of SARS-CoV-2 infection in teachers with respect to children in a school community [26, 27], including in the setting of asymptomatic screening. This difference may have been due to a relatively low event rate, causing lack of power to detect a difference, or to better adherence to infection prevention protocols by staff members within participating summer schools.
Regarding the relationship between transmission rate and age, previous studies suggested a greater risk of transmission in teenagers. In the present study, no differences in transmission rates were observed according to age, albeit the total number of index cases >12 years of age was small. We observed a correspondence between the prevalence of infection per district and the number of new index cases found in the same district. This finding supports that summer schools did not act as super-spreading hotspots, but rather reflected the underlying community transmission. Our finding concurs with a recent report [27] of school outbreaks toward the end of the first wave, which concluded that school transmission reflects that in the wider immediate community. Other studies have reported that school reopening does not appear to significantly affect community transmission, especially in the setting of low levels of community transmission.
From a public health perspective, the results of this study support implementation of prevention measures in schools to reduce the burden of COVID-19 in schools and school-like environments. Such measures may be applicable with much less disruption, financial costs, or harm than full closure. Summer schools in Barcelona were allowed to open provided they could guarantee adequate implementation of such preventive measures. Distribution of children in bubble groups of an average size of 10 individuals may have been an efficient measure at containing the spread of infections, facilitating contact traceability and allowing selective quarantines without having to close the entire facility. Interestingly, frequent handwashing was associated with decreased transmission rates.
Of note in this study, some SARS-CoV-2 infections were identified by screening using RT-PCR in saliva. This allowed identification of asymptomatic cases and illustrates the feasibility of using saliva for community screening. Saliva has been described as a reservoir for the virus and diagnostic tests for COVID-19 have been validated. Most importantly, saliva sampling was well accepted by children. The rate of false-negative RT-PCR saliva results relative to NP samples in those children with paired samples was only 0.8%.
This study has some limitations. There was a short follow-up (minimum of 2 weeks, and up to a maximum of 5 weeks) that could mask further infections and transmissions, secondary to a more prolonged contact between the summer school participants. Second, the community rate was low at the time of the study and results could be different under high-transmission community rates. The analysis presented is restricted to PCR results, but serological tests in saliva are pending. This could theoretically demonstrate a higher incidence and transmission rate, although the evaluation of antibodies in saliva for SARS-CoV-2 infections is still pending validation. However, the weekly follow-up with a molecular technique should minimize this possibility. Incidentally, recent studies have suggested that serology (including saliva) may overestimate clinical infections in children, as they may produce antibodies on exposure while so rapidly clearing the virus that it never becomes detectable via RT-PCR [28]. Finally, many summer-camp activities (median value 75%) were outdoors, where it is well known that increased ventilation drastically decreases the risk of transmission.
In summary, transmission rates among children and adults in summer school settings implementing strict preventive measures were low in comparison with community transmission rates. These results support current policies of school reopening under strict preventive measures.
Supplementary Data
Supplementary materials are available at Clinical Infectious Diseases online. Consisting of data provided by the authors to benefit the reader, the posted materials are not copyedited and are the sole responsibility of the authors, so questions or comments should be addressed to the corresponding author.
Notes
Acknowledgments. Hospital Sant Joan de Déu Biobank for sample management and processing.
Financial support. This work was supported by Banco de Santander and Stavros Niarkos Foundation, through the KIDS Corona platform.
Potential conflicts of interest. All authors: No reported conflicts of interest.
All authors have submitted the ICMJE Form for Disclosure of Potential Conflicts of Interest. Conflicts that the editors consider relevant to the content of the manuscript have been disclosed.
REFERENCES
Author notes
J. J. G.-G. and E. G. contributed equally to this work as co–senior authors.

