


Abstract
The incidence of herpes zoster (HZ) has been increasing in recent decades. Although 2 vaccines for HZ are available, there have been few studies on the incidence rates of HZ and postherpetic neuralgia (PHN) since their introduction. This study examined the incidence rates of HZ and PHN from 1994 to 2018 in the United States to determine if they have continued to increase since introduction of the HZ vaccines.
A de-identified longitudinal administrative claims database, the OptumLabs Data Warehouse, was used to assess incidence rates among individuals continuously enrolled in the database for ≥365 days with no prior history of HZ or PHN. Unstandardized and standardized incidence rates were calculated by year, 10-year age groups, sex, and race/ethnicity.
There were 610 766 individuals with HZ (median age, 56.3; interquartile range, 43.0–68.7 years; 59.8% women; 70.6% white). From 1994 to 2018, the incidence of HZ increased from 286.0 (95% confidence interval [CI], 259.1–312.8) to 579.6 (95% CI, 554.2–605.0) cases per 100 000 person-years, an annual increase of 3.1% (95% CI, 2.5–3.6%). Since 2007, annual HZ incidence rates have decreased in individuals ≤20 and >60 years old. The overall incidence rate of PHN was 57.5 (95% CI, 56.0–59.0) cases per 100 000 person-years. The proportion of individuals with HZ who developed PHN was higher from 2007 to 2018 than from 1994 to 2006.
HZ incidence rates have continued to increase in age groups for which HZ vaccines are not currently recommended, warranting a review of current vaccine recommendations.
Despite the common occurrence and great morbidity caused by herpes zoster (HZ), there is a relative lack of epidemiological studies on HZ incidence. Herpes zoster, or shingles, is an infection that occurs when latent varicella zoster virus reactivates from a cranial-nerve or dorsal-root ganglia, resulting in a dermatomal rash [1]. Over 1 million new cases of HZ occur in the United States each year and approximately 30% of all Americans will have HZ in their lifetime [2–4]. Herpes zoster can cause significant long-term sequelae, including a form of chronic, neuropathic pain known as postherpetic neuralgia (PHN) [5].
There are 2 vaccines for HZ: a live attenuated vaccine (zoster vaccine live; ZVL) and a subunit vaccine (recombinant zoster vaccine; RZV) [6]. The live vaccine was approved by the Food and Drug Administration (FDA) for adults 60 years of age and older in 2006 and for adults 50 and over in 2011 [6]. The recombinant vaccine was approved in 2017 for adults 50 years of age and older and is the preferred vaccine by the Advisory Committee on Immunization Practices (ACIP) [6]. Although a vaccine for HZ has been available for over a decade, there have been few studies on HZ incidence rates in the era of zoster vaccines.
Studies on HZ incidence prior to the introduction of ZVL found HZ incidence rates were increasing through the early 2000s, but there is no consensus on the reason for this increase [2, 7, 8]. Of the few reports in recent years, studies from the IBM MarketScan claims database found incidence rates were still increasing overall through 2016, but had started declining in adolescents and showed signs of plateauing in the elderly [9–11]. Given the large disease burden associated with HZ and limited studies since vaccine introduction, it is important to determine current estimates of HZ incidence and understand if risks are changing in particular demographic groups.
The primary objective of this study was to examine the incidence of HZ and PHN from 1994 to 2018 by age, sex, and race/ethnicity to determine if incidence rates have continued to increase since zoster vaccine introduction in 2006.
METHODS
Study Design and Eligibility
This was a retrospective, observational cohort study using OptumLabs Data Warehouse (OLDW; OptumLabs Inc, Cambridge, MA). The OLDW database includes de-identified electronic health and administrative claims data for patients enrolled in commercial insurance, Medicare Advantage, and Medicare Part D in the United States. Approximately 63 million unique patients had de-identified healthcare and administrative claims from 1 January 1994 to 31 December 2018 and were included in this study.
To be included, enrollees must have been continuously enrolled for 365 or more days and not have a prior International Classification of Diseases (ICD) 9th or 10th revision code for HZ (ICD-9 053.XX; ICD-10 B02.XX) or PHN (ICD-9 053.1X; ICD-10 B02.2X). Patients with a new ICD-9 or -10 revision code for HZ and/or PHN were counted as an incident case. Only PHN cases that occurred following a diagnosis of HZ were counted. Information was extracted on the patient’s year of birth, sex, and race/ethnicity. Age and sex (men, women, unknown) were collected from enrollment records, with age estimated by year of birth, as exact birth dates were unavailable. Age and decade of birth were tabulated into 10-year age groups. Race/ethnicity was assigned by an external vendor, Ethnic Technologies (E-Tech). E-Tech is a rule-based system that combines analysis of first names, middle names, surnames, and surname prefixes and suffixes with geographic criteria [12]. OptumLabs assigns these values into 1 of 5 compliance-determined race/ethnicity code values: Non-Hispanic White, Non-Hispanic Black, Hispanic, Asian, and Unknown.
In OLDW, the age of individuals is capped at 89 years old to maintain privacy. This is done by restricting birth year to 89 years prior to the year of data extraction. Since data extraction occurred in 2019, individuals born before 1930 had their birth year rounded up to 1930.
Standardization
Age- and sex-stratified analyses were standardized to the 2010 US Census [13]. External standardization against the census was not possible for race/ethnicity due to differences in classification. Instead, race-related analyses were standardized internally using the average proportion of each race/ethnicity in the years 2014 through 2018 in the OLDW database.
Statistical Analyses
For each calendar year, the unstandardized incidence rates of HZ and PHN were computed by dividing the number of cases by the number of person-years at risk for each demographic group. Incidence rates were reported per 100 000 person-years.
Results were reported for the time ranges 1994 to 2006 and 2007 to 2018 to allow for comparisons of incidence rates from before and after FDA approval of ZVL in 2006 [6]. All reported incidence rates were standardized unless otherwise specified. Records with missing data for a variable of interest were included in the unstandardized results for Table 1 but excluded from standardized results.
Unstandardized Incidence Rates and Description of the Study Population, 1994 to 2018
| Herpes Zoster | Postherpetic Neuralgia | ||||
|---|---|---|---|---|---|
| Number of Person-years | Number of Cases | Unstandardized Incidence Ratea | Number of Cases | Unstandardized Incidence Ratea | |
| Overall | |||||
| 121 504 921 | 610 766 | 502.7 | 79 059 | 65.1 | |
| Sex | |||||
| Women | 62 042 649 | 365 511 | 589.1 | 49 929 | 80.5 |
| Men | 59 457 761 | 245 244 | 412.5 | >29 119 | 49.0 |
| Otherb | 4511 | 11 | 243.9 | <11 | 243.9 |
| Race/ethnicity | |||||
| Asian | 4 647 069 | 18 829 | 405.2 | 2467 | 53.1 |
| Black | 10 675 516 | 46 856 | 438.9 | 6955 | 65.2 |
| Hispanic | 10 695 047 | 44 936 | 420.2 | 6419 | 60.0 |
| White | 80 969 924 | 431 066 | 532.4 | 55 126 | 68.1 |
| Unknown | 14 517 365 | 69 079 | 475.8 | 8092 | 55.7 |
| Age group, y | |||||
| ≤10 | 12 478 843 | 7493 | 60.1 | 242 | 1.9 |
| 11–20 | 15 692 000 | 22 043 | 140.5 | 716 | 4.6 |
| 21–30 | 12 609 681 | 33 260 | 263.8 | 1675 | 13.3 |
| 31–40 | 17 835 024 | 65 264 | 365.9 | 4415 | 24.8 |
| 41–50 | 20 593 326 | 94 868 | 460.7 | 8285 | 40.2 |
| 51–60 | 18 858 966 | 134 462 | 713.0 | 14 650 | 77.7 |
| 61–70 | 12 113 100 | 116 422 | 961.1 | 18 055 | 149.1 |
| ≥71c | 11 323 981 | 136 954 | 1209.4 | 31 021 | 273.9 |
| Decade of birth | |||||
| 1930–1939 | 9 577 610 | 113 426 | 1184.3 | 25 181 | 262.9 |
| 1940–1949 | 13 932 844 | 132 419 | 950.4 | 21 378 | 153.4 |
| 1950–1959 | 19 502 328 | 131 516 | 674.4 | 15 307 | 78.5 |
| 1960–1969 | 20 476 440 | 100 414 | 490.4 | 9387 | 45.8 |
| 1970–1979 | 16 440 384 | 63 103 | 383.8 | 4612 | 28.1 |
| 1980–1989 | 14 016 437 | 40 723 | 290.5 | 2116 | 15.1 |
| 1990–1999 | 15 304 063 | 23 919 | 156.3 | 831 | 5.4 |
| 2000–2009 | 10 314 972 | 4710 | 45.7 | 224 | 2.2 |
| 2010–2018 | 1 939 843 | 536 | 27.6 | 23 | 1.2 |
Abbreviation: OLDW, OptumLabs Data Warehouse.
aUnstandardized incidence rate is the number of cases per 100 000 person-years.
bIndividuals who had both men and women or neither sex listed. For cell counts <11, OptumLabs requires values to be reported as <11 rather than reporting actual values in order to protect patient privacy. In addition, in order to prevent back calculation, the value in another cell in the same subgroup is lowered and reported with a greater-than sign to keep the total case count the same. The incidence rate for postherpetic neuralgia for “other” sex is calculated for n = 11 to further prevent back calculation and maintain individual privacy.
cFrom 1994 to 2000, the 61- to 70-year-old age group included individuals over 70 years old. In the OLDW , age is capped at 89 years old to maintain patient privacy. Individuals aged 71 and older from 1994 to 2000 cannot be differentiated from those younger than 70 because birth years earlier than 1930 were assigned the year 1930.
Time trends were assessed using Huber robust regression on the standardized annual incidence rates for each age-sex-race/ethnicity combination [14], a conservative procedure that relies on the variability of summary statistics each year as a basis for inference, rather than the person-time denominator. The differences in incidence rate slopes for 1994 to 2006 and 2007 to 2018 were likewise calculated using Huber regression. The 95% confidence intervals (CIs) were derived from time-series bootstraps of the Huber regression unless indicated otherwise.
For reporting aggregate standardized incidence rates from 1994 to 2018, annual incidence rates were averaged and CIs constructed by time-series bootstrap (resampling from annual residuals). Incidence rate ratios were calculated using standardized incidence rates (Supplementary Methods), with CIs calculated by time-series bootstrap. Analyses were considered statistically significant when P < .001. Semiparametric regression was conducted for data display (generalized additive modeling based on age and time, using the general tensor product to represent interactions; R package mgcv; The R Project for Statistical Computing) [15].
All statistical analyses were conducted in R (The R Project for Statistical Computing, version 3.6; available at: http:/www.r-project.org). This study was performed in accordance with the 1964 Declaration of Helsinki and its later amendments. The University of California San Francisco Institutional Review Board granted approval for this study.
RESULTS
Herpes Zoster
A total of 63 million unique patients encompassing 121 million person-years met the inclusion criteria from 1 January 1994 to 31 December 2018. Over this period, 610 766 cases of HZ were reported, giving an overall standardized incidence rate of 476.2 (95% CI: 468.3, 483.8) HZ cases per 100 000 person-years. The median age of patients with HZ was 56.3 years (interquartile range: 43.0, 68.7). Table 1 displays additional demographic information.
The incidence rate of HZ increased by 3.1% (95% CI: 2.5%, 3.6%) annually. The overall observed rate increased from 286.0 (95% CI: 259.1, 312.8) cases per 100 000 person-years in 1994 to 579.6 (95% CI: 554.2, 605.0) cases per 100 000 person-years in 2018. Figure 1 shows the change in HZ incidence rates over time by age. From 1994 to 2006, the incidence rate increased annually in all age groups over 10 years old (P < .001) (Figure 2, Supplementary Table 1). The overall incidence rate continued to increase each year from 2007 to 2018, although the average rate of increase decelerated among individuals 31 to 60 years of age and declined in individuals 11 to 20 and 61 to 70 years of age (P < .001) (Figure 2, Supplementary Table 1). These results were stratified by sex (Figure 2) and race/ethnicity (Figure 3).
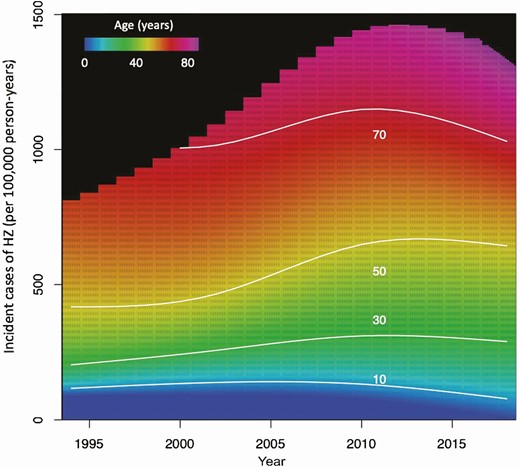
Incidence rate of HZ by age, 1994 to 2018. Note: From 1994 to 2000, the 61- to 70-year-old age group included individuals over 70 years old. In OLDW, age is capped at 89 years old to maintain patient privacy. Individuals ages 71 and older from 1994 to 2000 cannot be differentiated from those younger than 70 because birth years earlier than 1930 were assigned the year 1930. Abbreviations: HZ, herpes zoster; OLDW, OptumLabs Data Warehouse.
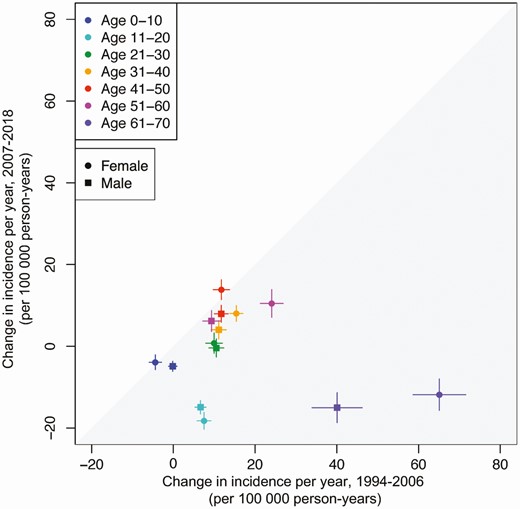
Annual change in herpes zoster incidence rate by sex, 1994 to 2006 versus 2007 to 2018. Note: From 1994 to 2000, the 61- to 70-year-old age group included individuals over 70 years old. In OLDW, age is capped at 89 years old to maintain patient privacy. Individuals ages 71 and older from 1994 to 2000 cannot be differentiated from those younger than 70 because birth years earlier than 1930 were assigned the year 1930. Abbreviation: OLDW, OptumLabs Data Warehouse.
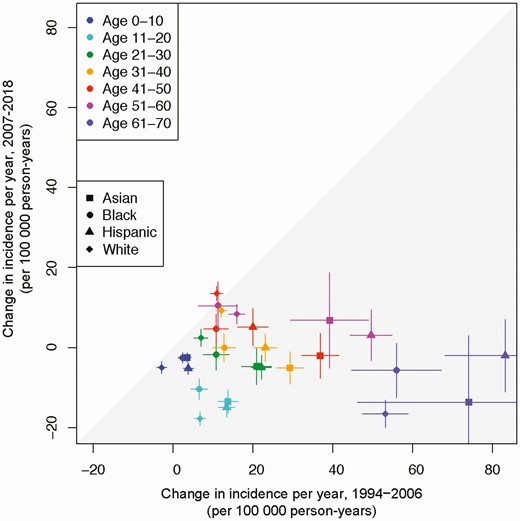
Annual change in herpes zoster incidence rate by race/ethnicity, 1994 to 2006 versus 2007 to 2018. Note: From 1994 to 2000, the 61- to 70-year-old age group included individuals over 70 years old. In OLDW, age is capped at 89 years old to maintain patient privacy. Individuals aged 71 and older from 1994 to 2000 cannot be differentiated from those younger than 70 because birth years earlier than 1930 were assigned the year 1930. Abbreviation: OLDW, OptumLabs Data Warehouse.
The incidence rate of HZ was 395.6 (95% CI: 388.1, 402.4) cases per 100 000 person-years in men and 556.1 (95% CI: 547.2, 565.2) cases per 100 000 person-years in women (Table 2). Incidence rates were 507.4 (95% CI: 498.8, 515.9) cases per 100 000 person-years in whites, 418.7 (95% CI: 410.4, 426.5) cases per 100 000 person-years in blacks, 372.1 (95% CI: 360.4, 384.5) cases per 100 000 person-years in Asians, and 388.8 (95% CI: 377.8, 401.3) cases per 100 000 person-years in Hispanics (Table 2).
Standardized Incidence Rate and Incidence Rate Ratios of Herpes Zoster and Postherpetic Neuralgia by Time Period
| 1994 to 2018 | 1994 to 2006 | 2007 to 2018 | ||
|---|---|---|---|---|
| Incidence Rate Ratio (95% CI) | Overall Standardized Incidence Rate (95% CI)a | Overall Standardized Incidence Rate (95% CI)a | Overall Standardized Incidence Rate (95% CI)a | |
| Herpes zoster | ||||
| Sex | ||||
| Women | … | 556.1 (547.2, 565.2) | 444.5 (433.2, 455.1) | 677.1 (663.6, 691.6) |
| Men | .72 (.70, .74) | 395.6 (388.1, 402.4) | 329.0 (317.8, 338.5) | 467.8 (458.3, 476.4) |
| Race/ethnicity | ||||
| Asian | .73 (.69, .77) | 372.1 (360.4, 384.5) | 306.9 (285.6, 330.7) | 442.7 (436.0, 449.1) |
| Black | .82 (.79, .85) | 418.7 (410.4, 426.5) | 336.3 (323.3, 348.3) | 508.0 (499.0, 516.0) |
| Hispanic | .76 (.72, .79) | 388.8 (377.8, 401.3) | 303.2 (286.6, 324.8) | 481.5 (470.4, 491.0) |
| White | … | 507.4 (498.8, 515.9) | 414.4 (402.8, 423.8) | 608.2 (595.4, 621.4) |
| Age group, y | ||||
| ≤10 | … | 77.0 (73.7, 80.3) | 110.2 (104.2, 116.2) | 41.0 (39.0, 43.0) |
| 11–20 | 2.4 (2.0, 2.8) | 141.2 (135.6, 147.3) | 163.6 (157.7, 170.2) | 117.0 (107.2, 127.5) |
| 21–30 | 4.2 (2.9, 6.4) | 236.2 (229.6, 243.4) | 203.7 (194.1, 215.5) | 271.4 (263.6, 280.0) |
| 31–40 | 5.9 (4.1, 9.2) | 323.4 (317.2, 329.1) | 263.3 (252.2, 274.0) | 388.5 (385.5, 391.8) |
| 41–50 | 7.6 (5.2, 11.8) | 422.7 (416.2, 429.1) | 354.0 (342.2, 366.0) | 497.1 (494.2, 499.8) |
| 51–60 | 11.6 (8.1, 17.6) | 660.6 (652.0, 668.3) | 582.0 (567.5, 594.8) | 745.7 (739.0, 752.2) |
| 61–70 | 15.7 (11.1, 23.3) | 902.4 (873.4, 932.2) | 810.5 (772.1, 853.7) | 1001.9 (960.9, 1041.7) |
| ≥71b | 18.7 (13.1, 27.9) | 1129.8 (1095.7, 1162.2) | 986.8 (917.5, 1063.1) | 1201.3 (1170.4, 1234.8) |
| Decade of birth | ||||
| 1930–1939 | 30.6 (26.0, 36.7) | 923.7 (897.8, 950.6) | 786.5 (753.1, 823.4) | 1072.3 (1034.8, 1110.7) |
| 1940–1949 | 25.3 (21.4, 30.5) | 768.2 (752.9, 783.8) | 662.9 (642.6, 682.7) | 882.2 (859.6, 905.4) |
| 1950–1959 | 19.3 (16.0, 23.5) | 576.3 (568.4, 583.8) | 502.4 (489.2, 515.2) | 656.4 (650.0, 662.2) |
| 1960–1969 | 14.3 (11.7, 17.5) | 409.3 (404.0, 414.2) | 344.5 (335.1, 353.3) | 479.6 (476.5, 482.9) |
| 1970–1979 | 10.1 (8.5, 12.1) | 292.5 (287.4, 297.4) | 245.4 (236.7, 253.9) | 343.5 (339.4, 347.9) |
| 1980–1989 | 5.9 (5.2, 6.6) | 199.4 (196.3, 202.3) | 189.7 (184.7, 194.4) | 210.0 (206.7, 212.6) |
| 1990–1999 | 2.7 (2.4, 3.0) | 128.5 (125.9, 131.0) | 147.6 (143.6, 151.4) | 107.8 (104.5, 111.2) |
| 2000–2009 | 1.2 (1.1, 1.3) | 81.1 (77.8, 84.9) | 126.0 (119.3, 135.4) | 55.0 (52.5, 57.5) |
| 2010–2018c | … | 34.6 (33.4, 35.9) | … | 34.6 (33.4, 35.9) |
| Postherpetic neuralgia | ||||
| Sex | ||||
| Women | … | 70.3 (68.4, 72.4) | 42.8 (40.7, 45.2) | 100.1 (97.2, 103.2) |
| Men | .63 (.61, .67) | 44.5 (43.2, 46.0) | 29.4 (27.6, 31.6) | 60.9 (58.8, 62.8) |
| Race/ethnicity | ||||
| Asian | .73 (.71, .76) | 44.3 (40.5, 48.0) | 28.2 (21.1, 35.0) | 61.8 (59.0, 64.4) |
| Black | .83 (.80, .84) | 55.6 (53.4, 57.8) | 32.2 (28.8, 36.0) | 80.8 (78.1, 83.4) |
| Hispanic | .77 (.74, .79) | 49.7 (46.3, 54.0) | 27.6 (22.0, 35.7) | 73.6 (70.8, 76.0) |
| White | … | 60.1 (58.5, 61.8) | 38.7 (37.0, 40.6) | 83.3 (80.6, 86.1) |
| Age group, y | ||||
| ≤10 | … | 1.6 (1.2, 2.0) | 1.2 (.8, 1.6) | 2.1 (1.5, 2.8) |
| 11–20 | 2.4 (1.9, 3.3) | 4.0 (3.6, 4.5) | 3.5 (2.9, 4.2) | 4.6 (3.9, 5.1) |
| 21–30 | 6.9 (5.2, 10.2) | 11.7 (10.8, 12.7) | 9.6 (8.1, 11.3) | 14.0 (13.1, 14.9) |
| 31–40 | 12.7 (9.2, 19.5) | 22.1 (20.9, 23.2) | 17.0 (15.2, 18.9) | 27.5 (26.2, 29.1) |
| 41–50 | 21.1 (15.0, 33.4) | 35.0 (33.9, 36.2) | 25.3 (23.6, 27.4) | 45.5 (44.7, 46.3) |
| 51–60 | 40.0 (28.5, 62.9) | 67.8 (65.5, 70.4) | 52.6 (49.2, 56.7) | 84.4 (81.4, 86.9) |
| 61–70 | 77.0 (56.3, 117.3) | 131.6 (126.4, 137.2) | 106.2 (98.3, 115.8) | 159.1 (152.4, 165.7) |
| ≥71b | 120.6 (87.0, 186.2) | 228.5 (219.7, 236.6) | 184.1 (164.9, 203.9) | 250.7 (242.5, 257.9) |
| Decade of birth | ||||
| 1930–1939 | 97.7 (58.7, 213.5) | 148.6 (143.4, 154.0) | 105.9 (99.6, 113.5) | 194.8 (186.6, 203.0) |
| 1940–1949 | 64.4 (39.1, 139.8) | 101.1 (98.1, 104.4) | 75.1 (71.5, 79.3) | 129.3 (124.4, 134.1) |
| 1950–1959 | 36.9 (21.9, 81.8) | 58.3 (57.1, 59.7) | 44.9 (43.3, 46.7) | 72.9 (71.1, 74.8) |
| 1960–1969 | 21.3 (12.7, 47.5) | 33.1 (32.3, 33.9) | 24.8 (23.6, 26.1) | 42.0 (41.2, 43.0) |
| 1970–1979 | 11.7 (7.2, 25.3) | 18.6 (18.0, 19.4) | 14.2 (13.2, 15.5) | 23.4 (22.8, 24.1) |
| 1980–1989 | 5.4 (3.6, 11.0) | 9.2 (8.7, 9.7) | 7.4 (6.7, 8.4) | 11.1 (10.7, 11.5) |
| 1990–1999 | 2.2 (1.6, 3.8) | 4.0 (3.6, 4.4) | 3.4 (2.9, 3.9) | 4.7 (4.2, 5.2) |
| 2000–2009 | 1.0 (.9, 1.3) | 2.3 (1.9, 2.8) | 2.3 (2.0, 2.6) | 2.4 (1.7, 3.0) |
| 2010–2018c | … | 2.0 (1.3, 2.7) | … | 2.0 (1.3, 2.7) |
Abbreviations: CI, confidence interval; OLDW, OptumLabs Data Warehouse.
aPer 100 000 person-years.
bFrom 1994 to 2000, the 61- to 70-year-old age group included individuals over 70 years old. In OLDW, age is capped at 89 years old to maintain patient privacy. Individuals aged 71 and older from 1994 to 2000 cannot be differentiated from those younger than 70 because birth years earlier than 1930 were assigned the year 1930.
cIncidence rate for 1994 to 2006 not available for the 2010–2018 cohort because the first period of observation was prior to cohort date of birth.
Postherpetic Neuralgia
From 1994 to 2018, a total of 79 059 cases of PHN were reported, with 12.8% of individuals with a diagnosis of HZ developing PHN. The median age of patients with PHN was 65.9 years old (interquartile range: 53.5, 74.8 years). The overall standardized incidence rate was 57.5 (95% CI: 56.0, 59.0) cases per 100 000 person-years and increased over the whole study period. From 1994 to 2006, the annual change in incidence rate of PHN was 2.9 (95% CI: 1.9, 4.0) cases per 100 000 person-years. From 2007 to 2018, the annual rate of change in the incidence rate was 2.3 (95% CI: 2.1, 2.7) cases per 100 000 person-years. The difference in the change in annual incidence rate between the 2 time periods was not statistically significant (−0.3 cases per 100 000 person-years; 95% CI: −1.9, 1.4).
The incidence of PHN increased with age, from 1.6 (95% CI: 1.2, 2.0) cases per 100 000 person-years in individuals younger than 10 years of age to 228.5 (95% CI: 219.7, 236.6) cases per 100 000 person-years in individuals 71 years of age and older (Table 2). The incidence of PHN was higher in whites compared with blacks, Asians, and Hispanics (Table 2). The incidence of PHN was higher in women compared with men (Table 2). The overall proportion of individuals with HZ who developed PHN was higher from 2007 to 2018 compared with 1994 to 2006 for both sexes, adjusting for age (P < .001) (Figure 4).
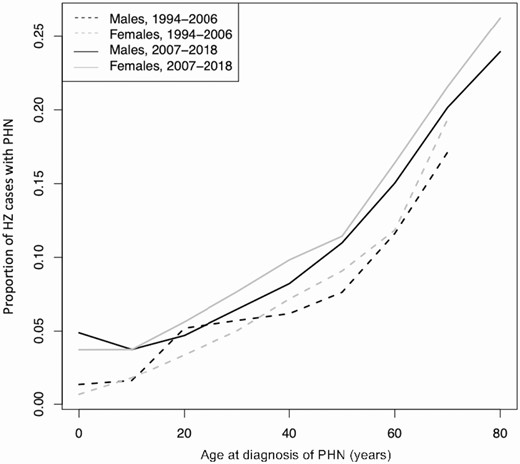
Proportion of HZ cases with PHN by age, 1994 to 2006 versus 2007 to 2018. Note: From 1994 to 2000, the 61- to 70-year-old age group included individuals over 70 years old. In OLDW, age is capped at 89 years old to maintain patient privacy. Individuals ages 71 and older from 1994 to 2000 cannot be differentiated from those younger than 70 because birth years earlier than 1930 were assigned the year 1930. Abbreviations: HZ, herpes zoster; OLDW, OptumLabs Data Warehouse; PHN, postherpetic neuralgia.
DISCUSSION
Herpes Zoster
The overall incidence rates of HZ and PHN continued to increase from 1994 through 2018 across all races/ethnicities and both sexes. However, since 2007, HZ incidence started to decline in individuals younger than 20 years old and in those older than 60 years old, while continuing to increase in individuals aged 31 to 60 years old. The risk of HZ increased with age and was higher in women and white individuals.
A number of studies have looked at HZ incidence rates prior to ZVL approval in 2006, but there have been few studies since then [2, 7, 8]. A recent study on HZ ophthalmicus, a form of HZ that occurs when varicella zoster virus reactivates along the ophthalmic branch of the trigeminal nerve, found that overall incidence rate has continued to increase through 2018 [16]. Reports using the IBM MarketScan database found incidence rates of HZ were decreasing among adolescents aged 17 and younger, increasing in middle-aged groups, and plateauing in individuals aged 50 and older in the years leading up to 2016 [9–11]. This study, using the OLDW database, found a similar annual decline in HZ incidence in the youngest age groups but also found a prominent annual decline in HZ incidence rates in the oldest age groups since 2007. This difference among the oldest ages may be due to the availability of additional years of data, during which RZV was introduced.
Widespread childhood varicella vaccination may be responsible for the falling incidence rates among children. A varicella vaccine was approved in the United States for children 12 months of age and older in 1995 [17]. One observational study found that from 2003 to 2014, the incidence rate of HZ was 78% lower among vaccinated adolescents aged 17 years and younger compared with their unvaccinated counterparts [18]. Given that more than 90% of the US population born since 2010 has received at least 1 dose of varicella vaccine, the protective effect of the vaccine may be a driver of the decreasing incidence rates in younger age groups [19].
The continued increase in HZ incidence rates in individuals between the ages of 31 and 60 years is concerning and warrants attention. There are a few theories on why incidence rates may be increasing among middle-aged adults. One theory is that childhood varicella zoster virus vaccination has decreased the circulation of wild-type varicella virus [19, 20]. Without this exposure, the general population receives less exogenous immune boosting against varicella, increasing the risk of virus reactivation [19, 20]. However, studies have shown that the incidence of HZ has been increasing in the United States since before varicella vaccination introduction and is similar in countries with and without varicella vaccination [7, 21, 22]. Enhanced awareness of HZ by patients and healthcare practitioners, increased surveillance, and improved electronic health record coding practices are other potential drivers of the increasing number of HZ cases among middle-aged adults.
A potential explanation for the observed decline in HZ incidence rates in older patients is the introduction of ZVL and RZV. In clinical trials, RZV had 97.2% efficacy against HZ in individuals aged 50 and older and ZVL had 61.6% efficacy in adults aged 60 and older [1, 23]. Although these vaccines are efficacious, low coverage levels dampen their impact. Estimates from National Health Interview Surveys indicate ZVL coverage in 2017 was approximately 5.7% for individuals aged 50–59 years old and 34.9% for individuals 60 years of age and older [24]. For RZV, approximately 8% of vaccine-eligible individuals had at least 1 dose within OLDW.
The FDA has approved both zoster vaccines for individuals aged 50 and older, but the ACIP only recommends ZVL for individuals aged 60 and older, compared with age 50 and above for RZV [6]. In this study, the risk of HZ infection was highest in individuals aged 60 and older, although a large number of cases occurred in individuals younger than 60 years of age. The median age of disease within the cohort was 56.3 years old. If incidence rates continue to increase in individuals aged 31 to 60 years old and decrease in those aged 61 years and older, the average age of HZ onset may decline. Taking this into consideration, public health authorities may need to re-evaluate age recommendations for vaccination.
Herpes zoster incidence was highest in whites. Despite the fact that racial minorities have lower vaccination rates [25], these results suggest that minority groups have lower incidence rates of HZ compared with whites. This is supported by existing literature, including 2 meta-analyses, which found that black individuals had a relative risk of 0.54 and 0.69 for HZ compared with white individuals [26, 27]. The cause of this remains unknown, but may be due to racial differences in healthcare-seeking behaviors, quality of care, or inherent genetic differences [21, 28, 29].
Men were approximately 30% less likely than women to develop HZ, consistent with other studies. A meta-analysis of 62 studies found the relative risk of HZ infection in women was 1.3 times greater compared with men [26]. Researchers have theorized that differences in the immune response to latent viral infections or distinct hormonal patterns may play a role in the varying risk of HZ by sex [30, 31].
Postherpetic Neuralgia
In this study, the incidence rate of PHN continued to increase from 1994 to 2018 across all age groups, races/ethnicities, and sexes. Although limited in number, other studies also found that the incidence rate of PHN has been increasing over time and with older age [32, 33]. The median age of patients with PHN was 65.9 years old, nearly a decade older than the median age of patients with HZ, indicating that PHN is still predominantly a disease of the elderly. In clinical trials, ZVL had 66% efficacy against PHN in individuals aged 60 and over and RZV had 88% efficacy in individuals aged 70 and over [23, 34]. It is unclear if the incidence of PHN is truly increasing or if the observed changes are due to additional factors. Increased awareness of the disease, increased availability of medications for treatment, and better coding practices may explain the increase in PHN cases observed over time.
There is no consensus on the association between sex and PHN [32, 35]. However, the proportion of individuals with HZ who developed PHN was higher in women across nearly all age groups in this study. The incidence of PHN was also highest among white individuals.
Limitations
Due to the observational nature of this study, it is not possible to determine the cause of the observed changes in HZ and PHN incidence rates. Vaccination rates for HZ were not assessed and no direct association between vaccination rates and incidence could be made. Given the large sample size, there is the risk of minor differences being statistically significant, but conservative statistical analyses were used to mitigate this possibility. The OLDW does not differentiate race from ethnicity, so both are reported jointly to reflect the classification system in the database.
The OLDW only captured individuals enrolled in commercial insurance programs, so it does not include individuals aged 65 and older enrolled in traditional Medicare plans. However, the study’s generalizability was enhanced by standardizing to the US Census for age and sex and standardizing internally for race/ethnicity. Since the maximum age was restricted to 89 years old, it was not possible to differentiate individuals born in 1930 from those born earlier. Although there were individuals older than age 70 in the period 1994 to 2000, they could not be separated from the 61- to 70-year-old age group. The number of individuals above the age limit is expected to be small and not have a major impact on the results for the oldest age groups.
Herpes zoster diagnosis was ascertained by a single ICD-9 or ICD-10 code for HZ since patients with milder disease may only have 1 visit for this condition. While the decision to use a single ICD code minimizes the chance of missing cases, there is a risk of overdiagnosis and inflating calculated incidence rates. However, the observed incidence rate estimates are similar to rates published in the literature, suggesting this methodology is reasonable [36, 37]. Verification of the accuracy of diagnoses was not possible, but physician diagnoses using ICD-9 codes have been shown to have a sensitivity of more than 90% for HZ and more than 85% for PHN [38].
Conclusions
In this large epidemiological study from 1994 to 2018, the overall incidence rates of both HZ and PHN continued to increase annually in the United States. However, in the years following vaccine introduction from 2007 to 2018, HZ incidence decreased annually among individuals younger than 21 years old and in those older than 60 years old. During this same time period, HZ incidence rates continued to increase in individuals aged 31 to 60 years old. Given these findings, it is crucial that healthcare providers and policymakers continue to advocate for HZ vaccination and consider revising age recommendations for vaccination to include individuals younger than 50 years of age.
Supplementary Data
Supplementary materials are available at Clinical Infectious Diseases online. Consisting of data provided by the authors to benefit the reader, the posted materials are not copyedited and are the sole responsibility of the authors, so questions or comments should be addressed to the corresponding author.
Notes
Acknowledgments. The authors thank Nina Veeravalli, Lead Research Analyst at OptumLabs, for providing logistical and administrative support related to accessing the OptumLabs Data Warehouse.
Financial support. This work was supported by the National Eye Institute and Office of Research on Women’s Health at the National Institutes of Health (grant number R01 EY028739; to N. R. A.) and the OptumLabs Data Warehouse (research credit to N. R. A.). The Department of Ophthalmology at the University of California, San Francisco, is supported by an unrestricted grant from the Research to Prevent Blindness Foundation; a core grant from the National Eye Institute at the National Institutes of Health (grant number EY06190); and the That Man May See Foundation.
Potential conflicts of interest. R. R. T., C. L. K., C. D. E., T. C. P., E. K., and N. R. A. received nonfinancial support from OptumLabs (Cambridge, MA) outside the submitted work. All authors have submitted the ICMJE Form for Disclosure of Potential Conflicts of Interest. Conflicts that the editors consider relevant to the content of the manuscript have been disclosed.

