


Abstract
Acute gastroenteritis (AGE) burden, etiology, and severity in adults is not well characterized. We implemented a multisite AGE surveillance platform in 4 Veterans Affairs Medical Centers (Atlanta, Georgia; Bronx, New York; Houston, Texas; and Los Angeles, California), collectively serving >320 000 patients annually.
From 1 July 2016 to 30 June 2018, we actively identified inpatient AGE case patients and non-AGE inpatient controls through prospective screening of admitted patients and passively identified outpatients with AGE through stool samples submitted for clinical diagnostics. We abstracted medical charts and tested stool samples for 22 pathogens by means of multiplex gastrointestinal polymerase chain reaction panel followed by genotyping of norovirus- and rotavirus-positive samples. We determined pathogen-specific prevalence, incidence, and modified Vesikari severity scores.
We enrolled 724 inpatients with AGE, 394 non-AGE inpatient controls, and 506 outpatients with AGE. Clostridioides difficile and norovirus were most frequently detected among inpatients (for AGE case patients vs controls: C. difficile, 18.8% vs 8.4%; norovirus, 5.1% vs 1.5%; P < .01 for both) and outpatients (norovirus, 10.7%; C. difficile, 10.5%). The incidence per 100 000 population was highest among outpatients (AGE, 2715; C. difficile, 285; norovirus, 291) and inpatients ≥65 years old (AGE, 459; C. difficile, 91; norovirus, 26). Clinical severity scores were highest for inpatient norovirus, rotavirus, and Shigella/enteroinvasive Escherichia coli cases. Overall, 12% of inpatients with AGE had intensive care unit stays, and 2% died; 3 deaths were associated with C. difficile and 1 with norovirus. C. difficile and norovirus were detected year-round with a fall/winter predominance.
C. difficile and norovirus were leading AGE pathogens in outpatient and hospitalized US veterans, resulting in severe disease. Clinicians should remain vigilant for bacterial and viral causes of AGE year-round.
Acute gastroenteritis (AGE), characterized by diarrhea, vomiting, fever, and abdominal pain, causes 1.3 million deaths globally every year [1]. In the United States, AGE causes 179 million cases and 1 million hospitalizations annually [2, 3]. Historically, AGE prevention and control efforts have focused on children, but adults experience a substantial proportion of illness; most US deaths are in older adults [3, 4]. Both viral and bacterial pathogens play important roles in AGE across all age groups, and norovirus and Clostridioides difficile are important emerging infectious causes of AGE among US adults, including AGE-associated deaths [4]. In the United States, norovirus causes 20 million AGE illnesses and about 800 deaths every year [5]. C. difficile, increasingly observed in community and acute care settings, caused an estimated 453 000 infections with 29 000 associated deaths in 2011 [6]. Other pathogens, such as rotavirus, contribute to AGE in children [7], but the adult burden is largely unknown.
Despite accumulating evidence on the importance of specific pathogens for AGE, population-based studies of the endemic burden of all-cause AGE in adults are rare. Although some data are available on bacterial pathogens [8], lack of population-based data on viral pathogens hinders estimations of pathogen-specific prevalence and incidence to inform clinical management and interventions, such as vaccines. Past viral AGE burden studies used indirect methods, such as billing codes without laboratory confirmation of disease; relied on clinician-ordered diagnostic testing results, which can bias detection away from viral pathogens; or focused on groups or populations that limit generalizability [3, 7, 9–11]. Moreover, traditional surveillance methods have been limited by infrequent diagnostic testing, except in severe AGE cases or outbreak settings [12]. With norovirus and C. difficile vaccines in clinical trials among all age groups [13, 14], robust pathogen-specific burden estimates are needed for baseline data that can serve as benchmarks for future impact evaluations.
To address these gaps, SUPERNOVA (Surveillance Platform for Enteric and Respiratory Infectious Organisms in the Veterans Affairs population) was established as a multisite outpatient and inpatient surveillance platform in VA medical centers (VAMCs) in Atlanta, Georgia; Bronx, New York; Houston, Texas; and Los Angeles, California. The project was initially designed to estimate the norovirus burden through passive surveillance [15, 16]; in 2015, an active surveillance pilot was launched at 1 site to characterize the AGE etiologic burden [17]. Subsequently, SUPERNOVA expanded to include active and passive AGE surveillance at all 4 sites, as well as testing for 22 gastrointestinal pathogens.
In the current article, we describe findings from the first 2 years of prospective, inpatient and outpatient multisite surveillance for AGE, with standardized methods and laboratory testing. We sought to estimate prevalence and incidence of outpatient encounters and inpatient hospitalizations for AGE due to norovirus, in the context of other viral, bacterial, and parasitic pathogens. Secondary objectives included describing the severity of illness among hospitalized patients with AGE caused by specific pathogens. Findings will inform clinical AGE management in adults and future treatment and control interventions for AGE pathogens.
METHODS
Participants and Case Definitions
SUPERNOVA sites served 322 468 unique veterans in outpatient and inpatient settings in fiscal year 2018 (24 485 in the Bronx, 83 477 in Los Angeles, 104 926 in Houston, and 109 580 in Atlanta). For inpatient active surveillance, veterans ≥18 years of age admitted to a participating VAMC were screened for eligibility during 2 surveillance years (from 1 July 2016 to 30 June 2017 and from 1 July 2017 to 30 June 2018). Active cases were defined as the occurrence of ≥3 loose stools, ≥2 episodes of vomiting, or ≥1 episode of both loose stool and vomiting in a 24-hour period and illness ≤10 days in duration. Patients were excluded if symptoms were present for >10 days or attributed to a noninfectious cause; if they were transferred from another hospital after admission of >48 hours; or if they were enrolled within the previous month. Controls were patients without AGE symptoms for ≥2 weeks, and were frequency matched to case patients by age bracket (<65 or ≥65 years) and admission date (±1 week). All inpatients meeting inclusion criteria during core surveillance hours were invited to participate (Supplementary Methods). For outpatient passive surveillance, patients with stool specimens collected for clinician-requested diagnostic testing in each site’s catchment area that met the case definition—acute onset of AGE symptoms recorded in the medical chart—were included in outpatient surveillance.
Laboratory Testing
Whole stool specimens were tested at each VAMC using the BioFire FilmArray Gastrointestinal Panel (bioMérieux), a polymerase chain reaction (PCR)–based multidiagnostic assay with targets for 22 viral, bacterial, and parasitic pathogens (https://www.biomerieux-diagnostics.com/filmarrayr-gi-panel). Stool samples with norovirus or rotavirus detected using this panel were shipped to the Centers for Disease Control and Prevention for real-time reverse-transcription quantitative PCR testing and genotyped by sequencing [18–21].
Statistical Analysis
The final analysis included the Houston VAMC from 1 July 2016 through 30 November 2016, and all 4 sites after the Atlanta, Bronx, and Los Angeles VAMCs began surveillance from 1 December 2016 through 30 June 2018. We calculated the prevalence of each pathogen among case patients and controls; examined the severity of illness, including duration of illness, hospital stay, modified Vesikari score (Supplementary Table 1), and intensive care unit (ICU) stay; and identified deaths by follow-up interview for inpatients, stratified by pathogens. We generated confidence intervals by bootstrapping or by assuming Poisson and conducted comparisons with Mann-Whitney, χ 2, and Fisher exact tests in SAS 9.4 software (SAS Institute). We report in-depth results for case patients where pathogen prevalence significantly differed between case patients and controls.
The incidence per 100 000 person-years among a VA patient population was calculated based on previously published methods [15, 17]. To identify only incident episodes of AGE, we counted encounters within 30 days as a single episode. Inpatient incidence estimates were stratified as community onset (illness onset before admission or on the day of or the day after admission) or hospital onset (illness onset ≥2 days after admission).
RESULTS
Enrollment, Demographics, and Risk Factors for AGE Case Patients
Over the 2-year surveillance period, 793 inpatients were enrolled (53% of eligible patients), and 724 (91%) completed all baseline study procedures (Figure 1). For outpatients, 544 stool specimens were available from clinician-ordered diagnostic testing; 506 (93%) met eligibility criteria and were included in analyses (Figure 1). Stool specimens were collected a median of 3 days after symptom onset for inpatients, and 4 days after onset for outpatients.
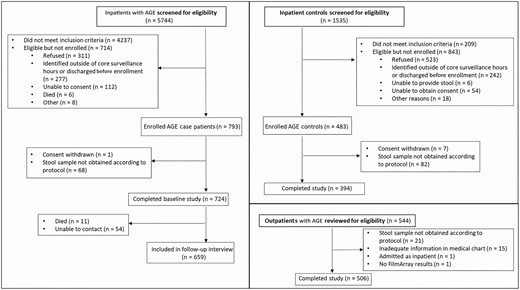
Screening, enrollment and study completion for inpatients with acute gastroenteritis (AGE), inpatient controls, and outpatients with AGE, from July 2016 to June 2018.
Most participants were male, reflective of the veteran population. Their median ages were 64 years for inpatients with AGE and 63 years for controls (P = .5) (Table 1). Inpatients with AGE were more likely than controls to have human immunodeficiency virus (HIV) (8.4% vs 2.4%; P = .003), severe renal disease (18.1% vs 4.9%; P < .001), or household contact with a patient with AGE (5.2% vs 2.3%; P = .02) or to be transplant recipients (2.8% vs 0%; P = .01).
Demographic Characteristics and Risk Factors for Inpatients with Acute Gastroenteritis (AGE), Inpatient Controls, and Outpatients With AGE, July 2016 to June 2018
| Characteristic or Factor | Inpatients With AGE, No. (%)a (n = 724) | Inpatient Controls, No. (%)a (n = 394) | P Valueb | Outpatients With AGE, No. (%)a (n = 506) |
|---|---|---|---|---|
| Age, median (range; IQR), y | 64 (25–96; 55–70) | 63 (23–94; 56–69) | .48 | 58 (23–95; 44–68) |
| Male sex | 673 (93.0) | 366 (92.9) | .97 | 454 (89.7) |
| Race | ||||
| White | 343 (49.0) | 182 (48.4) | <.001 | 253 (50) |
| Black | 329 (47.0) | 169 (45.0) | 209 (41.3) | |
| Asian | 0 (0) | 9 (2.4) | 5 (1) | |
| Otherc | 28 (4.0) | 16 (4.3) | 14 (2.8) | |
| Hispanic ethnicity | 102 (14.1) | 43 (11.1) | .15 | 83 (16.7) |
| Study site | ||||
| Atlanta, GA | 130 (18) | 100 (25.4) | <.001 | 130 (25.7) |
| Bronx, NY | 65 (9) | 46 (11.7) | 50 (9.9) | |
| Houston, TX | 375 (51.8) | 98 (24.9) | 184 (36.4) | |
| Los Angeles, CA | 154 (21.3) | 150 (38.1) | 142 (28.1) | |
| Usual source of primary care | NA | |||
| VA primary care clinic | 619 (86.1) | 355 (91.7) | .006 | … |
| Non-VA source of cared | 100 (13.9) | 32 (8.3) | … | |
| Residence in 2 wk before admission | NA | |||
| Private residence (apartment/house) | 270 (82.6) | 179 (87.7) | .23 | … |
| Long-term care/skilled nursing facility | 11 (3.4) | 5 (2.5) | … | |
| Hotel | 2 (0.6) | 1 (0.5) | … | |
| Anywhere outside (eg, street, vehicle, abandoned building) | 4 (1.2) | 2 (1) | … | |
| Homeless shelter/emergency or temporary housing | 3 (0.9) | 4 (2) | … | |
| Other | 13 (4) | 1 (0.5) | … | |
| Multiple residences | 24 (7.3) | 12 (5.9) | … | |
| Medical conditionse | NA | |||
| HIV | 56 (8.4) | 5 (2.4) | .003 | … |
| Cancer | 87 (13) | 26 (12.6) | .87 | … |
| Transplant | 19 (2.8) | 0 (0) | .01 | … |
| Immunosuppressive therapy | 23 (3.4) | 4 (1.9) | .28 | … |
| Severe renal disease | 60 (18.1) | 10 (4.9) | <.001 | … |
| Other AGE risk factors | NA | |||
| Prior hospitalization within 30 d | 33 (10) | 16 (7.9) | .44 | … |
| Recent travel history | 6 (0.8) | 2 (0.5) | .72 | … |
| Antibiotic use in 2 wk before illness onset | 91 (13.2) | 46 (11.9) | .55 | … |
| Animal contact | 248 (34.3) | 162 (41.2) | .02 | … |
| Household contact with AGE case patient | 37 (5.2) | 9 (2.3) | .02 | … |
Abbreviations: AGE, acute gastroenteritis; HIV, human immunodeficiency virus; IQR, interquartile range; NA, not applicable; VA, Veterans Affairs.
aData represent no. (%) of patients and controls unless otherwise specified. Some data were missing for race, ethnicity, residence before admission, previous hospitalization, prior antibiotic use, and household contact, representing <5% for each variable.
bP values based on χ 2, Fisher exact, or Wilcoxon rank-sum tests used to compare inpatients with AGE and controls.
c“Other” includes American Indian/Alaskan Native, Native Hawaiian/Pacific Islander, multiple races, or other race.
dNon-VA sources of care included a physician’s office, non-VA emergency room, urgent care center, or other non-VA site.
eData were available for HIV/AIDS, cancer, transplants, and immunosuppressive therapy for case patients (n = 667) from October 2016 to June 2018 and for controls (n = 206) from October 2017 to June 2018. Sensitivity analysis of data from only October 2017 to June 2018 resulted in similar proportions and levels of significance. For severe renal disease (severe kidney disease or kidney failure (stage 4 [glomerular filtration rate 15–29] or 5 [glomerular filtration rate <15, or requirement for dialysis]) and prior hospitalization within 30 days, data were available for case patients (n = 331) and controls (n = 206) from October 2017 to June 2018.
Pathogen Prevalence, Seasonality, and Laboratory Testing
Among inpatients, prevalence of 6 pathogens differed significantly between case patients and controls: C. difficile (18.8% vs 8.4%; P < .001), norovirus (5.1% vs 1.5%; P = .003), Campylobacter (3.9% vs 0.5%; P <.001), Shigella/enteroinvasive Escherichia coli (EIEC) (2.2% vs 0%; P = .003), Salmonella (1.8% vs 0.3%; P = .03), and rotavirus (1.5% vs 0%; P = .01) (Figure 2A). In the outpatient setting, norovirus (10.7%) and C. difficile (10.5%) were leading pathogens (Figure 2B). Among both inpatients and outpatients, most patients with C. difficile or norovirus (inpatients, 84% and 70%, respectively; outpatients, 75% and 80%) had only a single pathogen detected with FilmArray; the most common codetection was C. difficile and norovirus (in 8 inpatients and 2 outpatients). The highest norovirus prevalence was in adults aged ≥85 years (13%–36% by setting; Supplementary Table 2).

Prevalence of pathogens detected by means of the BioFire FilmArray Gastrointestinal Panel, from July 2016 to June 2018. A, Inpatients with acute gastroenteritis (AGE) and non-AGE inpatient controls. *Significant difference (P < .05; χ 2 test) in prevalence between case patients and controls for the following pathogens: Clostridioides difficile (P < .001), norovirus (P = .003), Campylobacter spp. (P < .001), Shigella/enteroinvasive Escherichia coli (EIEC) (P = .003), Salmonella (P = .03), and rotavirus (P = .01). The following pathogens are on the FilmArray panel but are not included because there were no positive detections: Vibrio cholerae, Escherichia coli O157, Aeromonas, and Cyclospora cayetanensis. Two stool specimens from inpatient controls were excluded owing to inconclusive results. B, Outpatients with AGE. The following pathogens on the FilmArray panel are not included because there were no positive detections: Entamoeba histolytica, Plesiomonas shigelloides, V. cholerae, E. coli O157, and Aeromonas. Two outpatient stool specimens were excluded owing to inconclusive results. Abbreviations: EAEC, enteroaggregative Escherichia coli; EPEC, enteropathogenic Escherichia coli; ETEC, enterotoxigenic Escherichia coli; G. lamblia, Giardia lamblia; STEC, Shiga-like toxin-producing Escherichia coli; Y. enterocolitica, Yersinia enterocolitica.
Most AGE cases in inpatients were community onset (80%) rather than hospital onset (20%); 78% of C. difficile cases, and 95% of norovirus cases were community onset (Supplementary Tables 2 and 3). The prevalence of C. difficile in community-onset cases did not differ from that in hospital-onset cases (18% vs 21%, respectively; P = .4), and the prevalence of norovirus was higher in community-onset cases (6% vs 1%; P = .03).
AGE cases were identified year-round (Figure 3A and 3B). Norovirus was detected every month, most commonly in November–January, reaching a peak prevalence of 16% in December. Rotavirus showed a distinct peak in April. Among bacterial pathogens, C. difficile was also detected year-round and reached a peak prevalence of 23% in October.
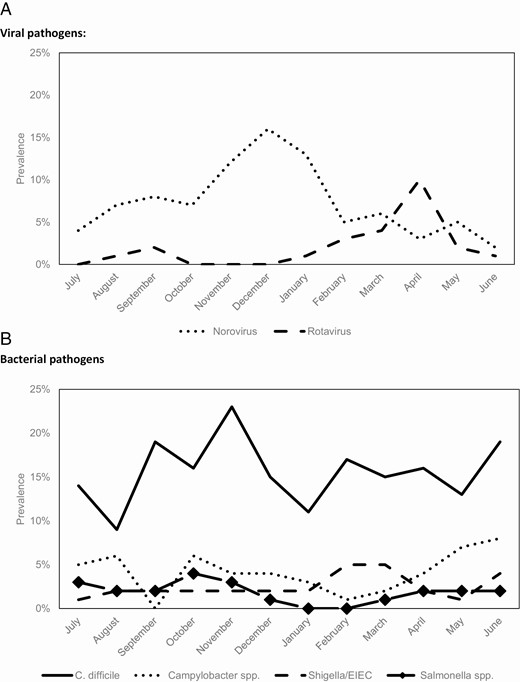
Seasonality of viral and bacterial pathogens among inpatient and outpatient cases, from July 2016 to June 2018. A, Viral pathogens. B, Bacterial pathogens. Abbreviations: C. difficile, Clostridioides difficile; EIEC, enteroinvasive Escherichia coli.
Norovirus-positive samples were typed into 7 GI and 12 GII types; GII.4 Sydney[P16] (56%) viruses were most common, followed by GII.2[P16] (11%) (Figure 4). The most common rotavirus genotypes were G12P[8] (79%) and G2P[4] (11%). For inpatient AGE cases with clinician-ordered testing data, 83% of C. difficile cases (55 of 66) positive by BioFire assay were also tested with PCR in the respective institution’s clinical laboratory (Cepheid Xpert C. difficile or Xpert C. difficile/Epi; Cepheid); of these cases, 87% (48 of 55) were also positive for C. difficile by clinical laboratory test. Clinical symptoms were similar among C. difficile–positive cases tested by both methods (data not shown).
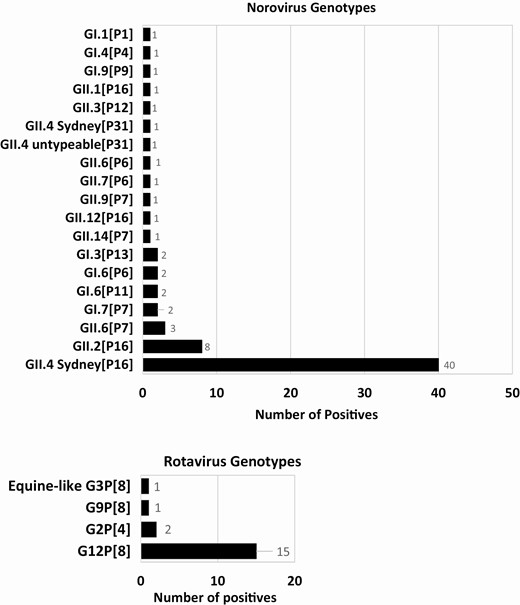
Genotypes for norovirus (n = 71) and rotavirus (n = 19).
Incidence Estimates
The incidence of AGE hospitalizations was higher in adults ≥65 old (459 per 100 000 population) than in those <65 years old (315 per 100 000) (Table 2). For outpatients, the reverse pattern was observed, with a slightly higher incidence in those aged <65 years (3100 vs 2247 per 100 000 in those aged ≥65 years). These age group and setting trends were also observed for norovirus, Campylobacter, and rotavirus. Of note, C. difficile and Salmonella had higher rates in adults ≥65 years of age for both inpatients and outpatients.
Incidence Rate Estimates Among Acute Gastroenteritis Case Patients (Inpatients and Outpatients), by Pathogen and Overall, July 2016 to June 2018
| Setting | Rate per 100 000 Population (95% CI)a | ||||||
|---|---|---|---|---|---|---|---|
| AGE | Clostridioides difficile | Norovirus | Campylobacter | Shigella/EIEC | Salmonella | Rotavirus | |
| Inpatients | |||||||
| Overall | 380 (363–396) | 71.3 (61.3–82.3) | 19.4 (13.9–26.2) | 14.7 (9.4–20.4) | 8.4 (4.7–12.6) | 6.8 (3.7–10.5) | 5.8 (2.6–9.4) |
| Attributable Fraction (AF)b | … | 43 (41.5–44.7) | 13.8 (10.7–14.8) | 12.8 (0–15.8) | 8.4 (4.7–12.6) | 5.9 (0–7.6) | 5.8 (2.6–9.4) |
| Age group | |||||||
| <65 y | 315 (293–334) | 56.2 (44.5–68.8) | 14.3 (7.6–21.8) | 10.1 (5–15.9) | 10.1 (5–15.9) | 5.9 (1.7–10.1) | 5.0 (1.7–9.2) |
| ≥65 y | 459 (433–484) | 90.6 (70.9–110) | 26.3 (15.8–38.1) | 21 (11.8–32.8) | 5.3 (1.3–11.8) | 7.9 (2.6–14.4) | 6.6 (1.3–11.8) |
| Exposure setting | |||||||
| Community onset | 218 (207–230) | 55.6 (45.6–64) | 18.3 (12.3–23.9) | 13.6 (8.9–18.3) | 7.9 (4.2–11.5) | 6.8 (3.1–11) | 5.8 (2.6–9.4) |
| Hospital onset | 388 (347–430) | 114 (79.6–145) | 7.6 (0–19) | 7.6 (0–19) | 3.8 (0–11.4) | 0 (0–0) | 0 (0–0) |
| Season | |||||||
| Winter (November–April) | 504 (474–532) | 84.8 (67.3–101) | 29 (18.6–39.5) | 12.8 (5.8–19.7) | 10.4 (4.2–16.6) | 5.8 (1.2–11.6) | 11.6 (5.8–19.7) |
| Summer (May–October) | 375 (351–402) | 65.4 (50.9–80.0) | 12.5 (6.2–19.7) | 17.7 (9.3–26) | 7 (2.3–12.8) | 8.3 (3.1–14.5) | 1.0 (0–3.1) |
| Surveillance year | |||||||
| July 2016 to June 2017 | 268 (249–288) | 46 (34.0–58.1) | 15 (8–23) | 10 (4.6–16.4) | 6.4 (1.8–11.8) | 4.6 (.9–9.1) | 8.0 (3.0–14) |
| July 2017 to June 2018 | 479 (453–503) | 94.6 (76.7–111) | 23.1 (14.7–32.6) | 16.3 (9.6–24.9) | 8.6 (3.8–15.3) | 7.6 (2.9–13.4) | 3.2 (0–7.4) |
| Outpatients | |||||||
| Overall | 2715 (2674–2755) | 285 (207–361) | 291 (226–366) | 140 (91.6–194) | 80.8 (43.1–121) | 32.3 (10.8–59.2) | 80.8 (48.5–119) |
| Age group | |||||||
| <65 y | 3100 (3041–3158) | 272 (188–371) | 329 (225–441) | 169 (93.9–254) | 112.7 (56.4–178) | 28.2 (0–65.7) | 103 (47–159) |
| ≥65 y | 2247 (2192–2302) | 310 (207–426) | 245 (155–349) | 103 (38.7–181) | 38.7 (0–77.5) | 38.7 (0–90.4) | 51.7 (12.9–103) |
| Season | |||||||
| Winter (November–April) | 3369 (3321–3417) | 455 (313–611) | 542 (381–703) | 147 (73.2–234) | 128 (56.9–213) | 28.4 (0–71.1) | 142 (56.9–227) |
| Summer (May–October) | 2854 (2810–2899) | 225 (139–321) | 253 (149–372) | 238 (133–357) | 64.1 (21.4–117) | 42.8 (5.3–85.5) | 53.5 (10.7–102) |
| Surveillance year | |||||||
| July 2016 to June 2017 | 2517 (2460–2574) | 306 (178–428) | 242 (129–354) | 113 (48.4–202) | 48.4 (0–112) | 16.1 (0–48.4) | 145 (56.5–242) |
| July 2017 to June 2018 | 2892 (2835–2950) | 283 (200–374) | 324 (233–420) | 158 (91.4–224) | 99.7 (49.9–157) | 41.6 (8.3–83.1) | 49.9 (16.6– 91.4) |
Abbreviations: AGE, acute gastroenteritis; CI, confidence interval; EIEC, enteroinvasive Escherichia coli.
aCIs for AGE outpatient estimates and inpatient community and hospital-onset inpatient estimates were calculated assuming Poisson distribution. Remaining estimates including pathogen-specific CIs calculated using bootstrapping.
bThe attributable fraction (AF) was calculated for inpatient pathogens based on the odds ratio (OR) of that pathogen’s prevalence among case patients and controls, using the following formula: (OR –1)/OR. The AF is an estimate of the percentage of AGE cases that can be attributed to infection with the pathogen of interest. (The AF was not calculated for other inpatient variables, owing to the small sample size for controls after stratification.)
C. difficile and norovirus had the highest inpatient and outpatient incidence rates (C. difficile, 71.3 and 285 per 100 000, respectively; norovirus, 19.4 and 291 per 100 000). The hospital-onset rate for C. difficile (114 per 100 000) was notably higher than that other pathogens, and higher than the C. difficile community-onset rate (55.6 per 100 000). For norovirus, the community-onset rate (18.3 per 100 000) was more than twice the hospital-onset rate (7.6 per 100 000). Norovirus incidence was twice as high in winter (November–April) as in summer (May–October), among both outpatients (542 vs 253 per 100 000) and inpatients (29 vs 12.5 per 100 000).
Clinical Symptoms and Severity of Illness Among Inpatients
Almost all inpatients with AGE had diarrhea (94%), and half had vomiting; the median duration of illness at follow-up was 7 days (Table 3). By modified Vesikari clinical severity scores, inpatient AGE cases were largely classified as moderate (42%) or severe (52%). Among all pathogens, norovirus, rotavirus, and Shigella/EIEC had higher median severity scores, and the largest proportions of severe scores (73%, 73%, and 80%, respectively).
Clinical Symptoms and Severity of Illness for Inpatient AGE cases, Overall and by Single and Multiple Pathogensa
| AGE (n = 724) | C. difficile (n = 120) | Norovirus (n = 27) | Campylobacter spp. (n = 22) | Shigella/ EIEC (n = 10) | Salmonella spp. (n = 10) | Rotavirus (n = 11) | Multiple co-pathogens (n = 20) | |
|---|---|---|---|---|---|---|---|---|
| Frequency of clinical symptoms, n (%) | ||||||||
| Fever | 164/718 (23) | 19/118 (16) | 4/27 (15) | 6/22 (27) | 5/10 (50) | 2/10 (20) | 3/11 (27) | 5/20 (25) |
| Diarrhead | 680/723 (94) | 118/120 (98) | 27/27 (100) | 22/22 (100) | 10/10 (100) | 10/10 (100) | 11/11 (100) | 19/19 (100) |
| Vomiting | 378/724 (52) | 56/120 (47) | 23/27 (85) | 7/22 (32) | 5/10 (50) | 1/10 (10) | 8/11 (73) | 12/20 (60) |
| Only diarrhea | 346/723 (48) | 64/120 (53) | 4/27 (15) | 15/22 (68) | 5/10 (50) | 9/10 (90) | 3/11 (27) | 8/19 (42) |
| Only vomiting | 43/723 (6) | 2/120 (2) | 0 | 0 | 0 | 0 | 0 | 0 |
| Duration of clinical symptoms in days, median (range; IQR) | ||||||||
| Fever at enrollment | 2 (1–10; 1–4) | 3 (1–8; 2–4) | 1 (1–1; 1–1) | 3 (3–5; 3–3) | 2 (1–4; 2–2) | 2 (1–2; 1–2) | 1 (1–1; 1–1) | 2 (1–8; 1–4) |
| Diarrhea in 24 hours, episodes | 5 (1–48; 4–8) | 5 (1–30; 3–7) | 5 (2–40; 4–15) | 8 (3–30; 5–20) | 7 (4–20; 4–10) | 13 (4–30; 8–20) | 10 (4–20; 5–15) | 5 (2–20; 4–10) |
| Vomiting in 24 hours, episodes | 3 (1–118; 2–6) | 3 (1–118; 2–6) | 4 (1–20; 2–11) | 2 (1–7; 1–3) | 3 (1–4; 1–3) | 4 (4–4; 4–4) | 3 (1–15; 2–12) | 2 (1–11; 2–5) |
| Illness at enrollment | 4 (1–10; 3–6) | 4 (1–10; 3–7) | 3 (1–10; 2–5) | 4 (1–10; 4–6) | 5 (2–9; 4–7) | 5 (3–10; 4–5) | 4 (2–7; 4–5) | 4 (2–10; 3–5) |
| Illness at follow-up | 7 (1–15; 4–9) | 7 (1–14; 4–9) | 6 (1–12; 3–7) | 8 (1–15; 6–9) | 7 (2–11; 4–10) | 7 (3–10; 7–10) | 7 (2–12; 6–9) | 5 (2–15; 4–7) |
| Diarrhea at enrollment | 4 (1–10; 2–5) | 4 (1–10; 2–6) | 2 (1–10; 2–5) | 4 (1–10; 3–6) | 5 (2–9; 3–6) | 5 (3–10; 4–5) | 4 (1–7; 2–5) | 3 (1–10; 2–5) |
| Diarrhea at follow-up | 6 (1–15; 4–8) | 6 (1–14; 4–8) | 4 (1–10; 2–7) | 7 (1–15; 6–9) | 6 (2–11; 4–9) | 7 (3–10; 7–10) | 7 (1–12; 6–8) | 5 (1–15; 3–6) |
| Vomiting at enrollment | 2 (1–10; 1–4) | 2 (1–9; 1–4) | 1 (1–6; 1–3) | 1 (1–7; 1–2) | 2 (1–4; 2–4) | 4 (4–4; 4–4) | 3 (1–3; 2–3) | 2 (1–6; 2–3) |
| Vomiting at follow-up | 3 (1–13; 2–5) | 3 (1–10; 2–6) | 2 (1–10; 1–5) | 3 (1–7; 2–4) | 4 (1–6; 2–4) | 6 (6–6; 6–6) | 3 (3–6; 3–4) | 3 (1–8; 2–4) |
| Severity of illness | ||||||||
| Modified Vesikari Score (MVS), median (range)b | 11 (4–19) | 10 (4–18) | 13 (8–17) | 11 (7–17) | 12 (10–16) | 11 (8–17) | 12 (9–18) | 12 (7–16) |
| Mild MVS, n (%) | 38 (6) | 4 (4) | 0 | 0 | 0 | 0 | 0 | 0 |
| Moderate MVS, n (%) | 293 (42) | 56 (49) | 7 (27) | 8 (36) | 2 (20) | 5 (50) | 3 (27) | 9 (47) |
| Severe MVS, n (%) | 362 (52) | 54 (47) | 19 (73) | 14 (63) | 8 (80) | 5 (50) | 8 (73) | 10 (53) |
| ICU stay, n (%) | 89/724 (12) | 20/120 (17) | 2/27 (7) | 1/22 (5) | 2/10 (20) | 0 | 1/11 (9) | 3/20 (15) |
| Duration of ICU stay in days, median (range; IQR) | 3 (1–38; 2–6) | 2 (1–11; 2–6) | 11 (10–12; 10–12) | 2 (2–2; 2–2) | 3 (1–4; 1–4) | 0 | 2 (2–2; 2–2) | 3 (3–4; 3–4) |
| Duration of hospital stay in days, median (range; IQR) | 5 (1–196; 3–10) | 6 (2–72; 3–16) | 4 (1–66; 2–8) | 4 (2–26; 3–7) | 3 (1–26; 3–5) | 4 (2–8; 3–6) | 4 (2–38; 2–6) | 5 (1–28; 3–8) |
| Duration of hospital stay for community-onset cases | 4 (1–95; 3–7) | 5 (2–72; 3–8) | 3 (1–13; 2–7) | 4 (2–8; 3–6) | 3 (1–26; 3–5) | 4 (2–8; 3–6) | 4 (2–38; 2–6) | 5 (1–20; 3–7) |
| Duration of hospital stay for hospital-onset cases | 15 (1–196; 9–24) | 20 (5–51; 11–24) | 36 (6–66; 6–66) | 26 (26–26; 26–26) | 0 | 0 | 0 | 18 (8–28; 8–28) |
| 23 hour stay, n (%) | 86/724 (12) | 12/120 (10) | 6/27 (22) | 2/22 (9) | 1/10 (10) | 0 | 1/11 (9) | 3/20 (15) |
| Death, n (%)c | 17/723 (2) | 3/120 (3) | 1/27 (4) | 0 | 0 | 0 | 0 | 0 |
aPathogen-specific columns include AGE cases with single pathogen detections, independent of the other 5 pathogens in the table. Any co-detection (≥2) between the six pathogens are included in the multiple co-pathogens column.
bIf cases were missing data for certain measurements, a Vesikari score was not assigned, pathogen (% missing): AGE (4%), Norovirus (3%), C. difficile (6%), Salmonella (8%). Modified Vesikari scoring was defined as follows: Mild (0–6), Moderate (7–10), Severe (≥11). See supplementary appendix for scoring components.
cAmong these deaths, 14 occurred while hospitalized. Three deaths occurred within 1–12 days following discharge; one died in inpatient hospice, one died within 24 hours of transferring to inpatient palliative care, and one died after discharge. Deaths following discharge were ascertained when attempting the follow-up interview at 3–5 weeks post-enrollment.
Campylobacter spp. includes jejuni, coli, and upsaliensis. EIEC=Enteroinvasive E. coli
dDiarrhea was defined as 3 or more loose stools within a 24 hour period
Overall, 12% of AGE case patients had ICU stays. By pathogen, Shigella/EIEC and C. difficile case patients had the highest proportion of ICU stays (20% and 17%, respectively) (Table 3). By exposure, patients with hospital-onset AGE were twice as likely to have an ICU stay, and their median hospital stay was almost 4 times that of patients with community-onset AGE (22% vs 10% and 15 vs 4 days, respectively; both P < .01). Among the medical conditions examined (HIV, cancer, transplants, immunosuppressive therapy, and renal disease), only severe renal disease or renal failure was associated with more severe disease in patients with AGE; those with renal disease had a longer median hospital stay and a higher death rate than those without renal disease (7 vs 5 days [P = .005] and 8% vs 2% [P = .01], respectively).
Seventeen deaths (2%) were captured among inpatients with AGE. These included 1 norovirus-associated and 3 C. difficile–associated deaths. There was 1 other enteric detection among the deaths (enteroaggregative E. coli), but based on the clinical course of illness and detailed record review, this pathogen was not believed to be a contributing factor. In the remaining 12 deaths, no pathogens were detected.
DISCUSSION
SUPERNOVA is a novel multisite AGE surveillance platform in the United States using prospective, active and passive, population-based surveillance with standardized case definitions and laboratory confirmation in a medically attended veteran population. We captured mild to severe AGE illness, including hospitalized cases, ICU stays, and deaths, and identified higher risk groups for AGE, including patients with certain medical conditions (HIV, transplants, and renal disease), and older adults. Testing for a wide range of AGE pathogens in a standardized fashion allowed us to identify C. difficile and norovirus as leading AGE pathogens, detected in inpatient and outpatient settings every month of the year, with a fall and winter predominance. These data will aid clinicians in clinical diagnosis and management for adults with AGE seeking medical care.
Norovirus was the leading viral pathogen in inpatients and outpatients with AGE. In our multisite surveillance, it is the second leading pathogen after C. difficile in inpatients with AGE, and the first in outpatients with AGE. Previous single-setting burden estimates for norovirus in US adults suggested that outpatient visits account for a greater proportion of cases than inpatient hospitalizations [3, 9, 15, 17]. Our findings build on these studies, demonstrating higher norovirus prevalence in outpatients (10.7%) and inpatients with community-onset AGE (6%) than in those with hospital-onset AGE (1%), and norovirus incidence estimates >1 order of magnitude greater in outpatient (291 per 100 000) than in inpatient (19.4 per 100 000) and hospital-onset settings (7.6 per 100 000).
We also demonstrate that sporadic cases of norovirus were more common in the fall and winter months, from October through January, reaching peak prevalence of 1 in 6 AGE cases in December, and genotype GII.4 Sydney[P16] was detected in just more than half of norovirus positives. Although the genotypes are consistent with national outbreak surveillance [22], our outpatient and hospital surveillance detected an increase in norovirus cases approximately 2 months earlier in the fall. Earlier detection in the norovirus winter season can alert public health professionals to increase prevention and control efforts, and provide clinicians with timely data to inform appropriate testing and clinical decision making. We also demonstrate the heightened risk of older adults infected with norovirus. Every year in the United States, adults ≥65 years old account for almost half of norovirus hospitalizations and are at high risk for severe norovirus disease, including longer duration of symptoms and death [23]. In our study, norovirus prevalence was significantly higher in adults ≥85 years old, and the incidence of hospitalizations was almost twice as high in adults ≥65 years old as in younger adults.
C. difficile was the leading pathogen among inpatients; hospital-onset incidence was >10 times higher than any other pathogen, and twice the C. difficile community-onset incidence. Substantial C. difficile burden among veterans has been recognized [24, 25], and a national longitudinal study of veterans in 2003–2014 found increasing rates for initial and recurrent C. difficile episodes over time [25]. However, retrospective studies relying on ICD codes and laboratory test results are influenced by changing diagnostics, including increased use of nucleic acid amplification tests, which are more sensitive than toxin assays. More recent data from Centers for Disease Control and Prevention demonstrate that although community-associated C. difficile cases have increased, healthcare-associated cases are decreasing [26, 27]. In addition, there is increased recognition that many hospitalized patients with toxigenic C. difficile in their stool, identified either by toxigenic culture or nucleic acid amplification test (as in our surveillance), may be only colonized. This is reflected in clinical practice guidelines that highlight the importance of testing only patients with a high pretest likelihood for C. difficile and using more specific tests when this cannot be reasonably assured, as well as consideration of a multistep algorithm for testing [28]. Together with the high detection rate of C. difficile in non-AGE controls, this suggests that our C. difficile attributable fraction estimates, which indicate a 40% lower inpatient incidence rate, may provide more realistic estimates. From a clinical standpoint, these findings suggest that clinicians may consider the colonization rate in controls before starting antibiotic treatment in the setting of a positive result. Nonetheless, even with these lower adjusted estimates, C. difficile remained the leading inpatient pathogen, and adults ≥65 years of age with C. difficile had higher incidences than younger adults in both inpatients and outpatients, an important finding because older adults have higher morbidity and mortality rates related to C. difficile infection [29].
Our platform was also unique in its capture of adult rotavirus AGE cases, which demonstrated a distinct winter-spring peak and higher incidence in the first surveillance year. Rotavirus is a well-known cause of diarrhea in children, yet the epidemiology and burden of rotavirus in adult populations is not well understood, particularly in the postvaccination era. Indeed, we identified only 1 other study in the United States reporting rotavirus incidence rates in adults in the ambulatory setting, using an insurance claim database in the prevaccine era in outpatient and emergency rooms [9]. The reported incidence in the outpatient setting (8–19 per 100 000) was much lower than in our study (overall, 81 per 100 000; winter peak, 142 per 100 000); this difference could be due in part to infrequent stool diagnostic testing for rotavirus in adults, and it demonstrates the strength of our surveillance. Adult rotavirus prevalence estimates are similarly sparse. Interestingly, our rotavirus prevalence estimates (inpatients, 1.5%; outpatients, 3%) were similar to that reported from a hospital that retrospectively tested adult stool specimens collected for bacterial stool culture February to May each year from 2006 to 2011 (2.8%), as well as outpatient adult stool specimens submitted to a managed care organization in 2012–2013 (1%–3%) [30, 31]. Widespread rotavirus vaccination in children has altered the US rotavirus seasonal pattern to biennial peaks from January to April [32], and G12P[8] has been the predominant strain detected since 2012 [21]; both the seasonality and genotyping in children are consistent with our findings in the current adult population.
The severity of disease for several pathogens was notable. Shigella/EIEC, norovirus, and rotavirus cases had the highest proportion of severe disease as measured by modified Vesikari score, whereas Shigella/EIEC and C. difficile cases had the highest proportion of ICU stays. Case patients with C. difficile had the longest median hospital stay, and those with norovirus the longest median ICU stay. Among AGE case patients who died, C. difficile and norovirus were the only pathogens detected that were believed to contribute to death. These patients had significant medical histories in addition to AGE, including cardiac, pulmonary, and renal disease that contributed to their hospitalization course and deaths.
In addition to specific pathogens, our case definition and data collection among all AGE case patients allowed for identification of subpopulations with AGE that may be at higher risk for more severe disease. First, inpatients ≥65 years old with AGE had higher disease incidence and longer median hospital stays than younger adults. Second, patients with AGE were more likely than controls to have HIV, be transplant recipients, or have severe or end-stage renal disease. In particular, AGE case patients with severe renal disease or renal failure had a longer median hospital stay and a death rate that was 4 times higher than AGE case patients without renal disease. Although diarrhea is common in patients with end-stage renal disease, its etiology can be challenging to determine and may include both infectious and noninfectious causes [33]; as such, this finding merits additional investigation as our surveillance continues. A third group of patients, with hospital-onset AGE, while representing only 1 in 5 AGE hospitalizations, were twice as likely to have an ICU stay and were notable for their higher AGE incidence compared with community-onset case patients. Patients with hospital-onset AGE had longer stays, almost 4 times longer than in patients with community-onset AGE.
Our findings are subject to limitations. First, it was challenging to obtain consent and enroll ICU patients with AGE, and some patients with AGE died before enrollment; therefore, our surveillance may underestimate AGE severity. As previously noted, PCR-based assays are sensitive, and bacterial pathogens were not independently confirmed by culture or toxin assay; detection may not indicate causation. However, the significantly higher case detection rates compared with controls, high single-pathogen detection among C. difficile and norovirus cases, and clinical symptoms and severity consistent with expected presentations for these pathogens gives us confidence in our interpretation. Finally, veterans are predominantly male, and results may not be representative of all US adults.
In conclusion, we offer robust assessment of the burden of AGE and specific AGE pathogens, including norovirus and C. difficile, in an adult population before vaccine introduction for these pathogens. Ongoing surveillance will allow further characterization of AGE pathogens, genotyping, burden, and risk factors in adults. Clinicians can use these data to inform clinical diagnosis and management for adults seeking medical care for AGE.
Supplementary Data
Supplementary materials are available at Clinical Infectious Diseases online. Consisting of data provided by the authors to benefit the reader, the posted materials are not copyedited and are the sole responsibility of the authors, so questions or comments should be addressed to the corresponding author.
Notes
Acknowledgments. The authors thank the study site participants for their time and contributions. They also gratefully acknowledge the following individuals for their contributions to the surveillance system and laboratory testing: Emory University: Ben Lopman, Jessica Ingersoll, and Candace Miller; Baylor College of Medicine: Robert Atmar and Frederick Neill; Houston Veterans Affairs Medical Center (VAMC): Mahwish Mushtaq, David Diaz Voss Varela, Rosalba Gomez, Bashir Lengi, Ernesto Ruiz, and Martha Bilbatua; Atlanta VAMC: Nana Addo Padi-Adjirackor, Elena Morales, Janet Thonkulpitak, Theron Clark-Stuart, Abeer Moanna, and Nora Oliver; Bronx VAMC: Johane Simelane, Sarah Smith, Amelia Tisi, and Guerry (Anabelle) Perez; Los Angeles VAMC: Matthew Goetz, Anthony Matolek, Evan Goldblatt, and Aleksandra (Sasha) Poteshkina; and Palo Alto VAMC: Madhuri Agrawal, Jessica Lopez, and Jude Lopez.
Disclaimer. The views expressed in this manuscript are those of the authors and do not necessarily reflect the position or policy of the Centers for Disease Control and Prevention, the Department of Veterans Affairs, or the United States government.
Financial support. This study was funded by the Centers for Disease Control and Prevention and by the Emory Center for AIDS Research (funding for laboratory personnel at the Atlanta VAMC).
Potential conflicts of interest. V. C. M. reports grants from Gilead, ViiV, and Bayer, and personal fees from Lilly, Gilead, and ViiV, outside the submitted work. All other authors report no potential conflicts. All authors have submitted the ICMJE Form for Disclosure of Potential Conflicts of Interest. Conflicts that the editors consider relevant to the content of the manuscript have been disclosed.

