


Abstract
The evidence base for severe acute respiratory syndrome coronavirus-2 (SARS-CoV-2) is nascent. We sought to characterize SARS-CoV-2 transmission within US households and estimate the household secondary infection rate (SIR) to inform strategies to reduce transmission.
We recruited patients with laboratory-confirmed SARS-CoV-2 infection and their household contacts in Utah and Wisconsin during 22 March 2020–25 April 2020. We interviewed patients and all household contacts to obtain demographics and medical histories. At the initial household visit, 14 days later, and when a household contact became newly symptomatic, we collected respiratory swabs from patients and household contacts for testing by SARS-CoV-2 real-time reverse-transcription polymerase chain reaction (rRT-PCR) and sera for SARS-CoV-2 antibodies testing by enzyme-linked immunosorbent assay (ELISA). We estimated SIR and odds ratios (ORs) to assess risk factors for secondary infection, defined by a positive rRT-PCR or ELISA test.
Thirty-two (55%) of 58 households secondary infection among household contacts. The SIR was 29% (n = 55/188; 95% confidence interval [CI], 23%–36%) overall, 42% among children (aged <18 years) of the COVID-19 patient and 33% among spouses/partners. Household contacts to COVID-19 patients with immunocompromised conditions and household contacts who themselves had diabetes mellitus had increased odds of infection with ORs 15.9 (95% CI, 2.4–106.9) and 7.1 (95% CI: 1.2–42.5), respectively.
We found substantial evidence of secondary infections among household contacts. People with COVID-19, particularly those with immunocompromising conditions or those with household contacts with diabetes, should take care to promptly self-isolate to prevent household transmission.
The severe acute respiratory syndrome coronavirus-2 (SARS-CoV-2) outbreak that began in China in December 2019 has become a global pandemic. As of 3 July 2020, the United States has reported the greatest number of cases and deaths worldwide [1]. Transmission has been reported in many settings, including healthcare facilities and family and community gatherings [2–4]. In China, household transmission and contact tracing investigations found that a range of 3% to 32% of household contacts acquired infection [5–10]. However, published data on systematic household transmission investigations in US households are scarce.
A better understanding of SARS-CoV-2 transmission in US households requires estimating secondary household transmission and transmission risk factors in the context of US living conditions and practices. During March 2020–May 2020, a period of shelter-in-place orders and social distancing recommendations across the United States (Supplementary Figure 1), we conducted a household transmission investigation in Utah and Wisconsin. These states were chosen based on interested public health partners and relatively low coronavirus disease 2019 (COVID-19) prevalence, reducing the risk of additional community exposure to household contacts. We sought to estimate the household secondary infection rate (SIR) of SARS-CoV-2 and evaluate potential risk factors for secondary infection to inform public health recommendations.
METHODS
Household Identification and Enrollment
The Centers for Disease Control and Prevention (CDC) collaborated with state and local health departments in the Milwaukee, Wisconsin, and Salt Lake City, Utah, metropolitan areas to identify persons with laboratory-confirmed SARS-CoV-2 infection captured by public health surveillance during 22 March 2020–25 April 2020. In Wisconsin, SARS-CoV-2 outpatient testing was limited to persons who met CDC criteria for influenza testing [11] and excluded asymptomatic or mildly symptomatic persons who were not healthcare workers [12]. Outpatient testing in Utah required clinical features (fever, cough, or shortness of breath) and an epidemiologic risk factor [13]. The investigation team defined persons identified by local health departments as “index patients.” Households were selected by convenience sampling and considered eligible if the index patient was not hospitalized at the time, lived with ≥1 additional person, and tested positive for SARS-CoV-2 by real-time reverse-transcription polymerase chain reaction (rRT-PCR) from a nasopharyngeal (NP) swab collected ≤10 days prior to enrollment. All persons in the household were asked to participate; we excluded households where >1 person declined.
Prior to the first household visit, questionnaires capturing demographic characteristics, medical histories, and recent symptoms were administered to index patients and all household contacts by phone. A household-level questionnaire captured physical characteristics of the residence (eg, square footage, number of bedrooms and bathrooms). For each household, the investigation team conducted an initial in-person visit (on day 0) and a visit 14 days later (day 14). The investigation period was defined as 14 days, which is the maximum duration of the SARS-CoV-2 incubation period [14, 15]. On day 0 and day 14, we collected an NP swab, self-collected anterior nasal swab, and blood sample for all persons living in the household, including the index patient. Each person completed a daily symptom diary during days 0–14. A newly symptomatic person prompted an interim visit during which repeat swabs were obtained for all household contacts. During day 0 and day 14 visits, we interviewed household members on precautionary practices to reduce transmission. Additional information regarding household selection and investigation protocols is included in the Supplementary Appendix.
Laboratory Testing
Swabs were tested at the Milwaukee Health Department Laboratory (MHDL) and the Utah Public Health Laboratory (UPHL) using the CDC 2019 Novel Coronavirus Real Time RT-PCR assay [16]. Blood samples were processed at MHDL and UPHL; sera were subsequently shipped to CDC and tested using a CDC-developed SARS-CoV-2 enzyme-linked immunosorbent assay (ELISA) [17].
Definitions
We classified all persons living in an enrolled household into 1 of 2 categories: “primary patient” or “household contact.” For each household, we defined a primary patient as the person with a positive SARS-CoV-2 rRT-PCR test with symptom onset >1 day prior to symptom onset of other persons in the household with laboratory-confirmed SARS-CoV-2 infection. The primary patient differed from the index patient if, during the investigation, we confirmed SARS-CoV-2 infection in a person with a symptom-onset date that was earlier than that of the index patient. For asymptomatic patients, onset was defined as the date of specimen collection for the first positive rRT-PCR test. Household contacts were defined as all persons living in the same household as the primary patient. Household contacts were considered to have had secondary infections if they tested positive by either rRT-PCR or ELISA. This approach was chosen after evaluating symptom-onset dates and day 0 and day 14 test results among rRT-PCR–negative, seropositive household contacts and their corresponding primary patients. Immunocompromising conditions were defined as medical history of human immunodeficiency virus infection with CD4 counts <200, history of solid organ or stem cell transplant, cancer diagnosis with current treatment, or taking immunosuppressive medication as defined in CDC guidelines (Supplementary Table 1) [18].
Statistical Analyses
For analyses, we excluded households for which the primary patient could not be determined. We summarized household environment characteristics, as well as demographic characteristics and medical histories of primary patients and household contacts. We estimated the SIR as the proportion of participating household contacts with secondary infection and estimated the serial interval as the number of days from symptom onset of the primary patient to symptom onset of the associated household contact with secondary infection. Statistical tests of trends were calculated using the Cochran-Armitage trend test. Two-sided P values and 95% confidence intervals (CIs) for binomial proportions were calculated with χ 2 tests and Wilson score intervals, respectively.
Characteristics of household environments, primary patients, and household contacts were assessed as potential risk factors. We estimated unadjusted odds ratios (ORs) and 95% CIs for potential risk factors of secondary infection among household contacts using a generalized estimation equation approach [19]. To account for within-household correlation, we specified an exchangeable correlation structure by households. To address potential misclassification of secondary infections among household contacts, we excluded contacts with evidence of SARS-CoV-2 infections by serology only and repeated SIR calculations and risk factor analysis. We estimated risk ratios and their 95% CIs for household environment characteristics as potential risk factors for whether any secondary transmission occurred in the household. We described precautionary practices reported by households on day 0 and day 14.
Data collected from questionnaires and symptom diaries were entered into a REDCap electronic database hosted at CDC [20, 21]. Analyses were conducted in SAS Enterprise Guide, version 7.1 (SAS Institute, Cary, NC).
Ethical Considerations
This protocol was reviewed by CDC human subjects research officials. The activity was deemed nonresearch as part of the COVID-19 public health response.
RESULTS
Study Population
We enrolled 62 households (Utah, n = 36; Wisconsin, n = 26) and excluded 4 households for which we could not identify the primary patient. Among the remaining 58 households (Utah, n = 34; Wisconsin, n = 24), 58 primary patients and 188/197 (95%) household contacts were included in the analysis; 9 household contacts declined participation after their respective households were initially enrolled. The median number of persons per household was 4 (range, 2–16; Supplementary Table 2). The median house size was 2200 square feet (range, 600–8000).
Demographic and clinical characteristics of primary patients and household contacts are shown in Table 1. The median age was 40 years (range, 16–90) for primary patients and 22 years (range, <1–76) for household contacts. Among 58 primary patients, 21 (36%) had at least 1 underlying medical condition; the most common symptoms were respiratory (n = 56, 97%), followed by neurologic (n = 51, 88%), constitutional (n = 50, 86%), and gastrointestinal (n = 41, 71%; Supplementary Table 3). One primary patient was asymptomatic and tested based on a known nonhousehold exposure. Median intervals to the day 0 household visit were 11 days (interquartile range [IQR], 8–16) from symptom onset of the primary patient and 6 days (IQR, 4–8) from collection of the first positive specimen of the primary patient. Among 58 primary patients, 3 (5%) required hospitalization and 1 (2%) died.
Demographic and Clinical Characteristics of Primary Patients and Household Contacts
| Characteristic | Primary Patients n = 58, n (%) | Household Contacts n = 188, n (%) |
|---|---|---|
| Age, y | ||
| <18a | 1 (2) | 68 (36) |
| 18–49 | 39 (67) | 88 (47) |
| 50–64 | 16 (28) | 26 (14) |
| ≥65 | 2 (3) | 6 (3) |
| Sex | ||
| Male | 32 (55) | 92 (49) |
| Female | 26 (45) | 96 (51) |
| Race | ||
| White | 44 (76) | 143 (76) |
| Black | 10 (17) | 24 (13) |
| Other | 3 (5) | 20 (11) |
| Not specified | 1 (2) | 1 (1) |
| Ethnicity | ||
| Hispanic/Latino | 7 (12) | 32 (17) |
| Non-Hispanic/Latino | 49 (84) | 155 (82) |
| Not specified | 2 (3) | 1 (1) |
| Underlying medical conditionb | ||
| ≥1 underlying medical condition | 21 (36) | 60 (32) |
| Any chronic lung disease | 9 (16) | 33 (18) |
| Any cardiovascular disease | 7 (12) | 17 (9) |
| Diabetes mellitus | 3 (5) | 5 (3) |
| Any chronic renal disease | 2 (3) | 2 (1) |
| Any immunocompromising condition or medication | 2 (3) | 2 (1) |
| Any chronic liver disease | 0 (0) | 2 (1) |
| Pregnantc | 0/26 (0) | 3/37 (8) |
| Smoking or vaping status | ||
| Currently smoking or vaping | 0 (0) | 18 (10) |
| Former smoking or vaping | 13 (22) | 17 (9) |
| No smoking or vaping history | 45 (78) | 153 (81) |
aThe 1 primary patient was aged 16 years. Among household contacts, 1 was aged <1 year, 28 were aged 1–9 years, and 39 were aged 10–17 years.
bDetails on the definition of underlying medical conditions are included in Supplementary Table 1.
cThe denominator for pregnancy status was among women aged 15–44 years only.
Secondary Infections Among Household Contacts
Among all 58 households, 31 (54%; 95% CI, 41%–66%) had secondary transmission. Fifty-two of 188 household contacts acquired secondary infections (SIR, 28%; 95% CI, 22%–34%). The median serial interval was 5 days (IQR, 4–9; Figure 1). Among 52 household contacts who acquired secondary infection, 44/52 (85%) had a positive rRT-PCR test and 46/50 (92%) had SARS-CoV-2 antibodies (Supplementary Table 4). By the initial household visit, 43/52 (83%) had acquired secondary infection; 9 (17%) household contacts acquired secondary infection during the 14-day investigation period. Eight (15%) of 52 household contacts with secondary infection had detectable SARS-CoV-2 antibodies but no positive rRT-PCR test during the investigation. Among these 8 household contacts, 3 (38%) seroconverted between day 0 and day 14, 4 (50%) were seropositive on day 0, and 1 (12.5%) did not have serology testing on day 0 but was rRT-PCR–negative and seropositive on day 14; all 8 were symptomatic with symptom onset occurring ≥2 days after symptom onset of the corresponding primary patient.
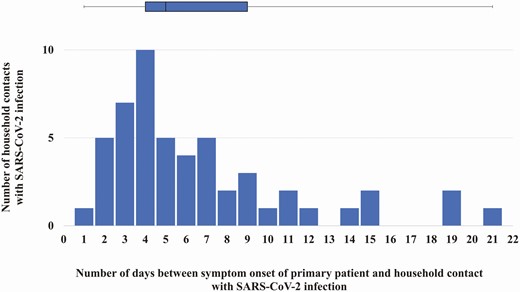
The number of household contacts with SARS-CoV-2 infection by the number of days between symptom onset of the primary patient and the symptom onset of the associated household contact. The bar graph is the distribution of the number of days between symptom onset in a primary patient and symptom onset of a household contact with SARS-CoV-2 infection. The box (median and interquartile ranges) and whisker (range) plot is of the serial interval for all household contacts with SARS-CoV-2 infection. Two household contacts had symptom onset 1 day after the primary patient; they remained included in this investigation as both had SARS-CoV-2 test results by real-time reverse-transcription polymerase chain reaction or enzyme-linked immunosorbent assay that were negative on day 0 and positive on day 14, suggesting that the SARS-CoV-2 infection was later than reported. Abbreviation: SARS-CoV-2, severe acute respiratory syndrome coronavirus-2.
Among family members, SIRs were highest among children (aged <18 years) of the primary patient (18/43, 42%), adult children (≥18 years) of the primary patient (6/17, 35%), and spouses/partners of the primary patient (11/33, 33%; Figure 2). Among all age groups, household contacts who were children of the primary patient were more likely to acquire secondary infection than household contacts who were not children of the primary patient, although this was significantly different only among household contacts aged 10–17 years (SIR, 15/26 or 58% vs 1/13 or 8%; P < .05). Repeat analysis using only positive rRT-PCR results to define secondary infections demonstrated an overall SIR of 44/188, or 23% (95% CI, 18%–30%; Supplementary Table 5). When stratified by relationship to the primary patient, we did not find significant differences in SIRs between secondary infections defined by rRT-PCR results compared with secondary infections defined by rRT-PCR and ELISA results.
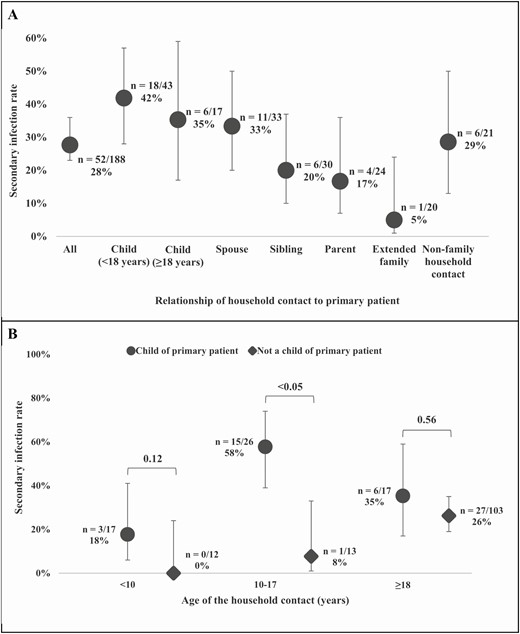
Household secondary infection rates among household contacts by relationship of the household contact to the primary patient (A) and by the age of the household contact stratified by relationship to the primary patient (B). P values were calculated using the χ2 test and 95% confidence intervals for the binomial proportions by the Wilson score interval. Among the 17 adult children of the primary patients (A), 5/6 (83%) with secondary infection were aged 18–22 years.
Household contacts with diabetes mellitus had higher odds of secondary infection compared with those who did not have diabetes (SIR, 80% vs 26%; OR, 7.8; 95% CI, 1.3–47.3; Table 2). Household contacts of a male primary patient were more likely to have secondary infection than those of a female primary patient (SIR, 36% vs 18%; OR, 2.4; 95% CI, 1.1–5.3). Household contacts of a primary patient with an immunocompromising condition compared with contacts of a primary patient without an immunocompromising condition had increased odds of secondary infection (SIR, 88% vs 25%; OR, 18.1; 95% CI, 2.6–125.1). Both household contacts of the 1 asymptomatic primary patient and the 3 household contacts of the 1 primary patient aged <18 years remained uninfected. In this investigation, age and race of the primary patient or household contact were not associated with significantly different odds of secondary infection among household contacts (Supplementary Table 6). Repeat risk factor analyses that excluded household contacts who were seropositive but rRT-PCR–negative produced similar results, with the exception that household contacts of primary patients with constitutional symptoms were found to be more likely to have a secondary infection (SIR, 27%; OR, 2.8; 95% CI, 1.1–7.2; Supplementary Table 7).
Underlying Medical Conditions and Pregnancy Status of Primary Patients and Household Contacts as Potential Risk Factors for Severe Acute Respiratory Syndrome Coronavirus-2 Infection Among Household Contacts
| Underlying Medical Condition | Risk Factor Present | Risk Factor Absent | Odds Ratiob (95% Confidence Interval) |
|---|---|---|---|
| Number of Household Contacts With Severe Acute Respiratory Syndrome Coronavirus-2 Infection a /total no. (%) | |||
| Primary patient characteristics | |||
| Underlying medical conditionc | |||
| Any chronic lung disease | 4/27 (15) | 48/161 (30) | 0.5 (.2–1.4) |
| Diabetes mellitus | 3/7 (43) | 49/181 (27) | 2.2 (.3–13.9) |
| Any cardiovascular disease | 1/14 (7) | 51/174 (29) | .2 (<.1–1.9) |
| Any chronic renal disease | 1/4 (25) | 51/184 (28) | 1.1 (.1–18.9) |
| Any chronic liver disease | 0/0 (0) | 52/188 (28) | – |
| Any immunocompromising condition or medication | 7/8 (88) | 45/180 (25) | 18.1 (2.6–125.1) |
| Pregnantd | 0/0 (0) | 7/58 (12) | – |
| Household contact characteristics | |||
| Underlying medical conditionc | |||
| Any chronic lung disease | 9/33 (27) | 43/155 (28) | 1.1 (.4–2.3) |
| Diabetes mellitus | 4/5 (80) | 48/183 (26) | 7.8 (1.3–47.3) |
| Any cardiovascular disease | 4/17 (24) | 48/171 (28) | .9 (.3–2.5) |
| Hypertension | 4/15 (27) | 41/166 (25) | .9 (.3–2.6) |
| Any chronic renal disease | 1/2 (50) | 51/186 (27) | 2.8 (.2–38.4) |
| Any chronic liver disease | 1/2 (50) | 51/186 (27) | 2.0 (.2–21.8) |
| Any immunocompromising condition or medication | 1/2 (50) | 51/186 (27) | 2.3 (.3–18.3) |
| Pregnantd | 2/3 (67) | 11/34 (32) | 5.1 (.3–86.3) |
aSevere acute respiratory syndrome coronavirus-2 infection was defined as having a positive real-time reverse transcription-polymerase chain reaction test or enzyme-linked immunosorbent assay. The reference group is the absence of the risk factor.
bThe OR and its 95% confidence interval was determined using a generalized estimation equation model with an exchangeable correlation structure and logit link to account for clustering of similar characteristics within households. ORs were not calculated for characteristics with 0% or 100% cells.
cDetails on the definition of underlying medical conditions are included in Supplementary Table 1.
dThe denominator for pregnancy status was among women aged 15–44 years only.
Secondary Transmission and Precautionary Practices in Households
Among 31 households with secondary transmission, 7 (23%) had a 100% SIR (Figure 3). More persons living in the household correlated with an increase in households with any secondary transmission (Cochran-Armitage trend: P = .06). Households with <6 persons had a median of 1 secondary infection (IQR, 1–2) and households with ≥6 persons had a median of 3 secondary infections (IQR, 2–4). The risk of transmission within a household was not different based on square footage per person or number of persons per bedroom or per bathroom (Supplementary Table 8).
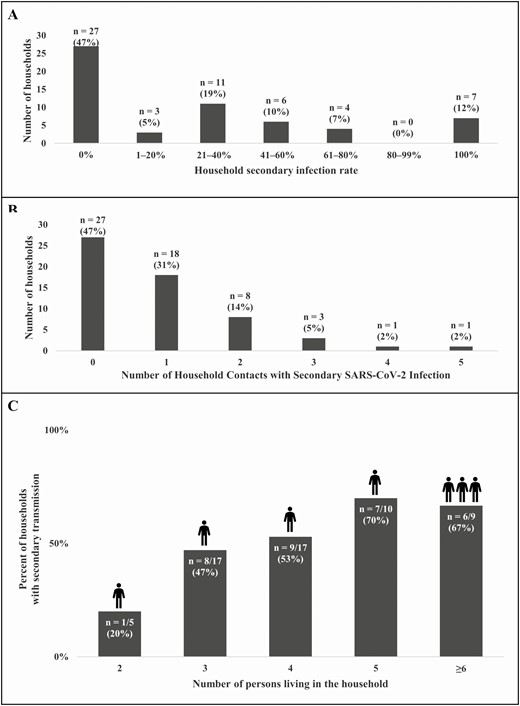
Number of households by household secondary infection rate ranges (A), by number of secondary infections per household (B), and percent of households with secondary transmission by number of persons living in the household (C). C, The icons above the bars represent the median number of household contacts with secondary SARS-CoV-2 infection within each category of number of persons in the household. Abbreviation: SARS-CoV-2, severe acute respiratory syndrome coronavirus-2.
Among the 58 households, 55 (95%) reported precautionary practices at any point following symptom onset of the first laboratory-confirmed COVID-19 patient in the household; 51 (88%) households reported ill persons sleeping in a separate bedroom and 33 (57%) reported use of cloth face covers or masks by ill persons (Figure 4). Household-level precautionary practices assessed were not associated with preventing household transmission (Supplementary Table 8).
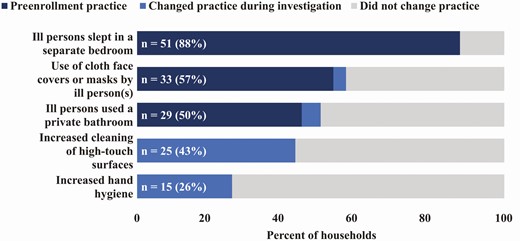
Reported precautionary practices in households during the initial and final household visits. The labels indicate the total number of households (out of 58 households) that reported the precautionary practice during the initial (day 0) and final (day 14) household visit. Cleaning of high-touch surfaces and hand hygiene practices were not assessed at the day 0 household visit.
DISCUSSION
These findings suggest that US household settings may lead to substantial SARS-CoV-2 transmission. By the day 0 household visit, 83% of the secondary infections among household contacts had already occurred, highlighting the importance of timely case identification and isolation. Transmission occurred in 55% of households, and the SIR was 29% among household contacts. We demonstrate potentially increased infection risk among children and spouses of primary patients living in the same household, household contacts of primary patients with an immunocompromising condition, household contacts of male primary patients, and household contacts with diabetes mellitus.
Previously reported household SIRs from China were 3%–32% [5–10], and a recent point-prevalence study of household transmission in the State of New York estimated a 38% SIR [22]. One study from China estimated a 28% SIR for spouses of primary patients and 4% for household contacts aged <18 years by SARS-CoV-2 rRT-PCR testing [6]. We observed similar SIRs of 33% among spouses of primary patients and 23% among household contacts aged <18 years after limiting our results to detection by rRT-PCR alone. Our SIRs may vary from those in China and New York based on differences in sociocultural context and an investigation protocol (ie, entire household testing, 14-day follow-up, serologic testing) that likely captured infections missed in point-prevalence surveys, routine contact tracing, or rRT-PCR testing alone.
People with diabetes mellitus within our investigation had increased odds of acquiring SARS-CoV-2 infection, although collinearity between diabetes mellitus and obesity could have confounded the association. Among COVID-19 patients, comorbidities such as diabetes and cardiovascular, cerebrovascular, and oncologic diseases have been identified as risk factors for severe disease and increased mortality [14, 23–27]. Our findings illustrate that increased risk posed by diabetes for COVID-19 could include susceptibility to SARS-CoV-2 infection as well as increased morbidity and mortality, particularly among people with poorly controlled diabetes [28, 29]. People with diabetes are at increased risk for infection generally [30, 31] as well as infection and severe illness caused by other beta-coronaviruses (ie, Middle East respiratory syndrome coronavirus, severe acute respiratory syndrome coronavirus) [32–35]. More than 34 million people in the United States, or about 1 in 10, have been diagnosed with diabetes [36]. Given potential increased risk of SARS-CoV-2 infection, plus risk for severe outcomes if infected, people with diabetes should take precautionary measures, including separating from people with known COVID-19, as currently recommended by the CDC [37].
Household contacts of immunocompromised primary patients may have increased odds of secondary infection. Increased transmission could potentially result from greater viral shedding associated with rapid disease progression, severe illness, or prolonged shedding in these patients or from more intimate and sustained caregiving needs among these patients [38]. Future research should address infection prevention practices for nonprofessional, in-house caregivers who are caring for immunocompromised loved ones and experiencing increased exposure [39]. In addition, household contacts of male primary patients had increased odds of secondary infection in our investigation. The reasons for this are unclear, although it may reflect behavioral differences between male primary patients and female primary patients or increased viral shedding as males have a higher likelihood of developing severe symptoms [7, 24].
Most households demonstrated willingness to adopt precautionary practices, with most reporting ill persons sleeping in a separate bedroom and more than half reporting use of cloth face covers or masks by ill persons. Although we did not find transmission differences between households where ill persons isolated and those where they did not, we were unable to capture the extent, timing, and consistency of such precautionary practices. A household transmission study from China, however, demonstrated that mask use and self-isolation decreased risk of secondary SARS-CoV-2 infection in households [8]. Further investigations are needed to identify measures that may be acceptable to and successful within US households.
These results must be considered with respect to several limitations. First, we assumed that household transmission was responsible for infections among household contacts. The household SIR could therefore be an overestimation, although concurrent stay-at-home orders should have limited community exposures. Second, misclassification of primary patients would affect risk factor analysis. Third, households were from convenience samples from 2 states and not representative of all US households. Future studies should assess, for example, households of primary patients with severe illness and transmission dynamics in apartment buildings. Fourth, transmission had already occurred in some households by enrollment due to delays in testing and reporting at the time of the investigation. Timelier enrollment would help differentiate between transmission generations and refine our risk factor analysis among household contacts. Fifth, we may have missed infections as repeat respiratory swabs were not obtained within a 24-hour period to confirm or exclude SARS-CoV-2 infection and additional transmission chains could have occurred after the investigative period. Sixth, timing and consistency of precautionary practices were not obtained, and we were unable to evaluate their efficacy. Finally, our approach to assessing household-level risk factors for secondary transmission did not account for individual-level characteristics. Our findings should thus be considered hypothesis-generating and suitable for evaluation in future analytic studies.
Households are likely major settings of SARS-CoV-2 transmission in the United States. Transmission dynamics are not uniform across or within households, and some people, including spouses and children of primary patients, people living with immunocompromised primary patients, and people with diabetes, may be at higher risk of secondary infection. Given public health guidance to isolate at home when sick or to quarantine at home when exposed, effective strategies to reduce household transmission of SARS-CoV-2 are urgently needed. People who have COVID-19 or suspect they may have COVID-19 should separate from other people within the household to the extent possible, use cloth face covers, and increase cleaning of high-touch surfaces to reduce transmission [37]. People at high risk for developing severe outcomes from SARS-CoV-2 infection, particularly people with diabetes as they may also be at higher risk for acquiring infection, should be especially vigilant in separating from COVID-19 patients and taking other precautionary measures as recommended by CDC [40].
Supplementary Data
Supplementary materials are available at Clinical Infectious Diseases online. Consisting of data provided by the authors to benefit the reader, the posted materials are not copyedited and are the sole responsibility of the authors, so questions or comments should be addressed to the corresponding author.
Notes
Acknowledgments. The authors acknowledge the following individuals. Utah: Davis County Health Department: Heather Gibb, Sara Hall; Summit County Health Department: Carolyn Rose; Salt Lake County Health Department: Dagmar Vitek, Ilene Risk, Lee Cherie Booth, Jeff Sanchez, Madison Clawson, Tara Scribellito, Ha Khong, Carlene Claflin, Theresa Beesley, Victoria Castaneda; Utah Department of Health: Nathan LaCross, Robyn Atkinson-Dunn, COVID-19 response team. Wisconsin: North Shore Health Department: Kala Hardy, Christine Cordova, Kevin Rorabeck, Kathleen Platt; City of Milwaukee Health Department: Catherine Bowman, Nancy Burns, Barbara Coyle, Elizabeth Durkes, Carol Johnsen, Jill LeStarge, Erica Luna-Vargas, Sholonda Morris, Mary Jo Gerlach, Jill Paradowski, Bill Rice, Michele Robinson, Virginia Thomas, Keara Jones, Chelsea Watry, Richard Weidensee, Jeanette Kowalik, Heather Paradis, Julie Katrichis; Wauwatosa Health Department: Laura Conklin, Paige Bernau, Emily Tianen; Wisconsin Department of Health Services: COVID-19 response team; City of Milwaukee Laboratory SARS-CoV-2 Testing Team: Jordan Hilleshiem, Beth Pfotenhauer, Manjeet Khubbar, Jennifer Lentz, Zorangel Amezquita-Montes, Kristin Schieble, Noah Leigh, Joshua Weiner, Tenysha Guzman, Kathy Windham, and Julie Plevak. Centers for Disease Control and Prevention (CDC): CDC COVID-19 Response Team: Claire Midgley, Melissa Rolfes, Mayer Antoine, Adebowale Ojo, Alicia Fry, Fiona Havers; Laboratory Task Force: Brandi Limbago, Michelle Owens, Wendi Kuhnert-Tallman, Jeff Johnson, Collette Leaumont; Field Investigations Team: Jenny Milucky, Emily Weston, Jessica Smith, Michelle Johnson Jones, Jennifer Huang, Erin Moritz, Aubrey Gilliland, Laura Calderwood, Jennifer Imaa, Kaytlin Renfro, Allison Miller, Katie Bantle, Margaret Williams, Stacy Thorne, Jana Manning, Micha Ghertner, Adriane Niare, Yoonjae Kang, Charlotte D. Kaboré.
Disclaimer. The findings and conclusions in this report are those of the authors and do not necessarily represent the official position of the CDC.
Potential conflicts of interest. The authors: No reported conflicts of interest. All authors have submitted the ICMJE Form for Disclosure of Potential Conflicts of Interest.
References
Author notes
N. M. L. and V. T. C. contributed equally to this work.

