


Abstract
The World Health Organization’s Treat-All guidance recommends CD4 testing before initiating antiretroviral therapy (ART), and routine viral load (VL) monitoring (over CD4 monitoring) for patients on ART.
We used regression discontinuity analyses to estimate changes in CD4 testing and VL monitoring among 547 837 ART-naive patients enrolling in human immunodeficiency virus (HIV) care during 2006–2018 at 225 clinics in 26 countries where Treat-All policies were adopted. We examined CD4 testing within 12 months before and VL monitoring 6 months after ART initiation among adults (≥20 years), adolescents (10–19 years), and children (0–9 years) in low/lower-middle-income countries (L/LMICs) and high/upper-middle-income countries (H/UMICs).
Treat-All adoption led to an immediate decrease in pre-ART CD4 testing among adults in L/LMICs, from 57.0% to 48.1% (−8.9 percentage points [pp]; 95% CI: −11.0, −6.8), and a small increase in H/UMICs, from 90.1% to 91.7% (+1.6pp; 95% CI: 0.2, 3.0), with no changes among adolescents or children; decreases in pre-ART CD4 testing accelerated after Treat-All adoption in L/LMICs. In L/LMICs, VL monitoring after ART initiation was low among all patients in L/LMICs before Treat-All; while there was no immediate change at Treat-All adoption, VL monitoring trends significantly increased afterwards. VL monitoring increased among adults immediately after Treat-All adoption, from 58.2% to 61.1% (+2.9pp; 95% CI: 0.5, 5.4), with no significant changes among adolescents/children.
While on-ART VL monitoring has improved in L/LMICs, Treat-All adoption has accelerated and disparately worsened suboptimal pre-ART CD4 monitoring, which may compromise care outcomes for individuals with advanced HIV.
Country-level adoption of the World Health Organization’s (WHO’s) 2015 recommendation for universal treatment of all people living with human immunodeficiency virus (PLWH) [1]—also known as “Treat-All”—has improved access to life-saving antiretroviral therapy (ART), particularly in low-resource settings where ascertaining treatment eligibility based on CD4 levels constituted a barrier to timely treatment initiation [2, 3]. Nevertheless, pre-ART CD4 testing remains essential for assessing patients’ risk of opportunistic infections (OIs) and identifying patients with advanced human immunodeficiency virus (HIV) disease and elevated mortality risks who should be prioritized for differentiated care [4, 5]. Pre-ART CD4 levels also provide important information for monitoring progress towards population health goals of earlier diagnosis and treatment of HIV [6–8].
Despite its importance for guiding HIV care, since adoption of Treat-All, pre-ART CD4 testing is increasingly deprioritized in favor of scaling up viral load (VL) testing for patients on ART [4, 9, 10]. The US President’s Emergency Fund for AIDS Relief (PEPFAR) has reduced support for pre-ART CD4 testing—even in settings where capacity for VL testing remains suboptimal [3, 5, 10, 11]—and studies suggest that pre-ART CD4 testing has decreased markedly in recent years [12, 13], raising concerns about potential negative consequences for patient care. While VL monitoring is recommended at 6 and 12 months after ART initiation and at least annually thereafter to ascertain treatment success or failure and to guide decisions regarding regimen switches and differentiated care strategies [14–17], it is not a substitute for pre-ART CD4 testing, and it has limited value for assessing disease progression and mortality risks for patients entering or re-engaging in care [18].
The impact of national adoption of Treat-All policies on routine laboratory monitoring practices in HIV care is unknown. Using data from the International epidemiology Databases to Evaluate AIDS (IeDEA) research consortium, we estimated the effect of Treat-All policy adoption on pre-ART CD4 testing practices and on VL monitoring after ART initiation.
METHODS
Data Sources and Management
The IeDEA consortium pools observational clinical data on approximately 1.7 million PLWH ever enrolling in care at approximately 400 care and treatment sites in 46 countries [19]—sites whose practices reflect national and local treatment guidelines. De-identified data were approved for use by local research ethics committees and were standardized in accordance with IeDEA data definitions [20].
Exposure and Outcomes
The exposure of interest was enrollment in HIV care before versus on or after national adoption WHO’s Treat-All recommendations. We identified the date when universal ART eligibility was extended to all adult patients in each country, based on policy documents, literature, and inputs from in-country experts, as described elsewhere [12, 21, 22].
Primary outcomes of interest were (1) pre-ART CD4 testing and (2) VL monitoring 6 months after ART initiation among patients with sufficient potential follow-up time (see “Inclusion and Exclusion Criteria”). To align with WHO recommendations that pretreatment CD4 testing be performed every 6–12 months when ART initiation is delayed [23], we defined pre-ART CD4 testing as the presence of any CD4 measurement (count or percent) within the 12 months prior to and up to 7 days after ART initiation. We defined VL monitoring as the presence of any VL test at 6 months (±3 months) after ART initiation.
Inclusion and Exclusion Criteria
Patients
All ART-naive patients who enrolled in HIV care between 2006 and 2018, had complete information on age and sex, and sufficient potential follow-up time between ART initiation and the earliest of database closure, documented transfer to another site, or death were eligible, regardless of age. Analyses of pre-ART CD4 testing and VL monitoring, respectively, were restricted to patients with at least 7 days’ and at least 9 months’ potential follow-up time after ART initiation.
Sites
All IeDEA sites that contributed patient data for at least 365 days prior to and after national adoption of Treat-All were eligible. Sites were excluded if enrollment and service delivery dates had been shifted for anonymization purposes.
Countries
Countries where WHO’s Treat-All policy was not officially adopted in national guidelines by December 2018 were excluded.
Other Definitions
Age Group
Adults were defined as 20 years or older at enrollment at an IeDEA site, with adolescents defined as 10–19 years and children defined as younger than 10 years.
Country Income Classification
Information on each country’s income group in 2017—low- and lower-middle-income country (L/LMIC) versus high/upper-middle-income country (H/UMIC)—was compiled from World Bank databases [24].
Statistical Analysis
We used descriptive statistics to summarize patient characteristics and the proportion of patients with laboratory monitoring outcomes of interest.
To estimate the effect of national Treat-All policy adoption on laboratory monitoring, we used a sharp regression discontinuity (RD) in time design [25]. For all outcomes, we treated patients’ date of enrollment in HIV care as a continuous treatment assignment variable, using the date of national Treat-All policy adoption as a cutoff threshold. Patients enrolling in care prior to the cutoff were considered unexposed to Treat-All, and those enrolling on or after the cutoff were considered exposed.
To assess key RD assumptions, we plotted the density of patients enrolling in HIV care, by month, and examined whether there was evidence of bunching of observations before or after national policy adoption, which would suggest manipulation of enrollment dates. We also used RD analysis to assess systematic differences in patient age and sex distributions before and after Treat-All adoption.
We examined the effect of Treat-All adoption on laboratory testing outcomes for each of the 3 age groups, stratified by country income level. We used local linear regression models [26] within data-driven Imbens-Kalyanaraman (IK) bandwidth intervals, derived using a rectangular (uniform) kernel [27] to estimate risk differences just before and just after Treat-All adoption as follows [28]:
where Yi is the patients’ probability of receiving the laboratory test, Zi is the number of days between patients’ enrollment date and national Treat-All adoption date (negative for patients enrolling before Treat-All adoption), and 1[Zi ≥ 0] indicates enrollment on or after the date of Treat-All adoption. Calculated using the subset of observations within IK bandwidth intervals, the effect of interest is the difference in local linear predictions at the threshold (ie, as the threshold is approached from above vs below) [28].
In sensitivity analyses, we estimated risk differences at the threshold using the IK bandwidths ±3 months, as well as IK bandwidths computed with a triangular kernel and with a second-order polynomial term. We also estimated differences at the threshold controlling for unbalanced covariates among those enrolling before and after Treat-All adoption. To assess how the local average treatment effect varied with marginal changes in the date of Treat-All adoption, as might occur with heterogeneous site-level policy introduction within countries, we also estimated the treatment effect derivative (TED), which, under the local policy invariance assumption, is equivalent to the marginal threshold treatment effect (MTTE) [29–31]. Finally, for the VL monitoring outcome, we performed an additional sensitivity analysis that excluded patients enrolling in HIV care during the 9 months immediately prior to Treat-All adoption, as VL testing for these patients may have taken place after Treat-All introduction.
To examine trends in the percentage of patients with laboratory monitoring before and after Treat-All adoption, we compared slopes from linear models regressing testing against time for the 2 years before and after Treat-All adoption, using an interaction term to assess differences in percentage point (pp) changes per year in testing in the pre– and post–Treat-All periods.
All statistical analyses were performed using STATA 15.1 (StataCorp, College Station, TX, USA).
RESULTS
Sample Characteristics
Data were available for 547 837 patients with 7 or more days of potential follow-up time after ART initiation who had enrolled in HIV care at 225 clinics/programs in 26 countries where WHO’s Treat-All recommendation had been adopted. Of these, 492 980 patients had sufficient potential follow-up time for assessment of VL monitoring at 6 months after ART initiation.
Most patients were female (62.9%), with a median age at enrollment of 33.7 years (interquartile range, 26.7–41.7 years). The majority of patients were from IeDEA cohorts in East and Southern Africa, and more than 80% had enrolled in care prior to Treat-All adoption (Table 1).
Sample Characteristics, by Study Outcome
| Characteristics at Enrollment in HIV Care | Pre-ART CD4 Testing,a n (% of Total) | Viral Load Monitoring at 6 Months After ART Initiation,b n (% of Total) |
|---|---|---|
| Patients | 547 837 | 492 980 |
| Sites | 225 | 224 |
| Countries | 26 | 26 |
| Region | ||
| Asia-Pacific | 7483 (1.4%) | 7076 (1.4%) |
| Central Africa | 31 936 (5.8%) | 31 598 (6.4%) |
| East Africa | 185 469 (33.9%) | 168 495 (34.2%) |
| North America | 25 465 (4.7%) | 24 307 (4.9%) |
| Southern Africa | 282 810 (51.6%) | 248 607 (50.4%) |
| West Africa | 14 674 (2.7%) | 12 897 (2.6%) |
| Country income level | ||
| Low/lower-middle income | 327 750 (59.8%) | 292 380 (59.3%) |
| High/upper-middle income | 220 087 (40.2%) | 200 600 (40.7%) |
| Sex | ||
| Male | 203 359 (37.1%) | 181 545 (36.8%) |
| Female | 344 478 (62.9%) | 311 435 (63.2%) |
| Age at enrollment, years | ||
| Median (IQR) | 33.7 (26.7–41.7) | 33.7 (26.8–41.7) |
| Age group at enrollment | ||
| Adults (>19 years) | 494 661 (90.3%) | 445 893 (90.5%) |
| Adolescents (10–19 years) | 21 336 (3.9%) | 17 992 (3.7%) |
| Children (<10 years) | 31 840 (5.8%) | 29 095 (5.9%) |
| Period of enrollment | ||
| Before Treat-All introduction | 456 466 (83.3%) | 424 671 (86.1%) |
| After Treat-All introduction | 91 371 (16.7%) | 68 309 (13.9%) |
Abbreviations: ART, antiretroviral therapy; HIV, human immunodeficiency virus; IQR, interquartile range.
aART-naive patients enrolling in HIV care 2006–2018, with at least 7 days of potential follow-up time after ART initiation.
bART-naive patients enrolling in HIV care 2006–2018 with at least 9 months (273 days) of potential follow-up time after ART initiation.
Patients enrolling before and after national Treat-All adoption were similar with respect to age and sex (Supplementary Table 1A–B), and no major discontinuities were observed in the numbers of patients enrolling in HIV care around the Treat-All threshold date for either analytic sample (Supplementary Figure 1).
Pre-ART CD4 Testing
Among those enrolling in HIV care from 2006 and 2018 and initiating ART, the percentage with a pre-ART CD4 test was 67.1%, 58.1%, and 59.5% for adult, adolescent, and pediatric patients, respectively, in L/LMICs Table 2 and 89.4%, 83.8%, and 71.0%, respectively, in H/UMICs (Table 3). In L/LMICs, the percentage of patients with pre-ART CD4 testing was markedly lower after Treat-All adoption, with smaller changes in H/UMICs.
Pre–Antiretroviral Therapy (ART) CD4 Testing (Within 12 Months Before ART Initiation), Before and After Treat-All Introduction in Low- and Lower-Middle-Income Countries
| Patient Group | |||
|---|---|---|---|
| Adults (>19 Years)a | Adolescents (10–19 Years)b | Children (<10 Years)c | |
| n | 291 428 | 14 363 | 21 959 |
| Baseline CD4 monitoring, n (%) | 195 642 (67.1) | 8338 (58.1) | 13 070 (59.5) |
| Before Treat-All adoption | 181 835 (73.4) | 7665 (64.8) | 12 691 (62.9) |
| After Treat-All adoption | 13 807 (31.6) | 673 (26.6) | 379 (21.3) |
| Risk difference at the Treat-All adoption threshold, PP (95% CI)d | −8.9 ( −11.0, −6.8) | −6.0 (−12.4, .4) | −3.6 (−8.7, 1.4) |
| P value | <.0001 | .067 | .158 |
| Imbens-Kalyanaraman bandwidth, days | 282 | 448 | 756 |
| No. within bandwidth | 34 509 | 3421 | 4642 |
| TED (95% CI) | −.073 (−.086, −.060) | −.013 (−.039, .012) | −.03 (−.042, −.018) |
| TED P value | <.0001 | .300 | <.0001 |
| Predicted outcomes at the Treat-All threshold,d (95% CI) | |||
| Enrollment just before Treat-All adoption (%) | 57.0 (55.5, 58.4) | 41 (36.3, 45.7) | 34.5 (31, 38.0) |
| Enrollment just after Treat-All adoption (%) | 48.1 (46.6, 49.5) | 35 (30.7, 39.4) | 30.8 (27.2, 34.5) |
| Relative change at threshold (%) | −15.6 | −14.6 | −10.6 |
| Slopes before and after Treat-All adoptione | |||
| Percentage point change per year before Treat-All | −2.1 (−2.9, −1.4) | −4.4 (−7.4, −1.4) | 0.3 (−2.5, 3.1) |
| Percentage point change per year after Treat-All | −13.9 (−14.7, −13.1) | −9.3 (−12.5, −6.0) | −12.2 (−15.8, -8.7) |
| P value for interaction term (difference in slopes) | <.0001 | 0.037 | <.0001 |
Abbreviations: PP, percentage point; CI, confidence interval; TED, treatment effect derivative.
aBurundi, Cambodia, Cameroon, Cote d’Ivoire, Kenya, Lesotho, Malawi, Mozambique, Republic of Congo, Rwanda, Senegal, Tanzania, Uganda, Zimbabwe.
bBenin, Burundi, Cambodia, Cameroon, Cote d’Ivoire, Ghana, India, Kenya, Lesotho, Malawi, Mozambique, Republic of Congo, Rwanda, Senegal, Tanzania, Uganda, Vietnam, Zimbabwe.
cBenin, Burundi, Cambodia, Cameroon, Cote d’Ivoire, Ghana, India, Kenya, Lesotho, Malawi, Mozambique, Republic of Congo, Rwanda, Tanzania, Uganda, Vietnam, Zimbabwe.
dRisk difference and predicted outcomes at the Treat-All threshold are from regression discontinuity analysis estimating the difference in local linear predictions at the threshold (ie, in the limit, as the threshold is approached from above and below). The Imbens-Kalyanaraman bandwidth defines the region in which the relationship between enrollment timing and testing outcome is assumed to be linear in local linear regression models.
eSlope comparison is from separate linear regression models comparing the 2 years before Treat-All adoption and after adoption.
Pre–Antiretroviral Therapy (ART) CD4 Testing (Within 12 Months Before ART Initiation), Before and After Treat-All Introduction in High- and Upper-Middle-Income Countries
| Patient Group | |||
|---|---|---|---|
| Adults (>19 years)a | Adolescents (10–19 Years)b | Children (<10 Years)c | |
| n | 203 233 | 6973 | 9881 |
| Baseline CD4 monitoring, n (%) | 181 643 (89.4) | 5844 (83.8) | 7014 (71.0) |
| Before Treat-All adoption | 146 590 (90.3) | 4490 (84.4) | 6497 (71.8) |
| After Treat-All adoption | 35 053 (85.8) | 1354 (82) | 517 (62.4) |
| Risk difference at the Treat-All adoption threshold, PP (95% CI)d | 1.6 (0.2, 3.0) | −.5 (−5.6, 4.7) | 3.1 (−5.4, 11.6) |
| P value | .022 | .854 | .477 |
| Imbens-Kalyanaraman bandwidth, days | 289 | 739 | 761 |
| No. within bandwidth | 27 283 | 2797 | 1922 |
| TED (95% CI) | −.013 (−.022, −.005) | −.024 (−.037, −.011) | 0 (−.021, .020) |
| TED P value | .002 | <.0001 | .985 |
| Predicted outcomes at the Treat-All threshold,d (95% CI) | |||
| Enrollment just before Treat-All adoption (%) | 90.1 (89.1, 91.1) | 88.9 (85.2, 92.6) | 62.7 (57, 68.4) |
| Enrollment just after Treat-All adoption (%) | 91.7 (90.8, 92.6) | 88.4 (84.8, 92.0) | 65.8 (59.5, 72.1) |
| Relative change at threshold (%) | 1.8 | −0.5 | 4.9 |
| Slopes before and after Treat-All adoptione | |||
| Percentage point change per year before Treat-All | 0.2 (−0.3, 0.8) | 3.4 (0, 6.8) | −3.2 (−8.2, 1.7) |
| Percentage point change per year after Treat-All | −6.6 (−7.2, −5.9) | −5.7 (−9.1, −2.3) | −3.8 (−10.0, 2.3) |
| P value for interaction term (difference in slopes) | <.0001 | <.0001 | .880 |
Abbreviations: PP, Percentage point; CI, confidence interval; TED, treatment effect derivative.
aCanada, China including Hong Kong SAR, South Africa, South Korea, United States.
bCanada, Malaysia, South Africa, South Korea, Thailand, United States.
cMalaysia, South Africa, Thailand.
dRisk difference and predicted outcomes at the Treat-All threshold are from regression discontinuity analysis estimating the difference in local linear predictions at the threshold (ie, in the limit, as the threshold is approached from above and below). The Imbens-Kalyanaraman bandwidth defines the region in which the relationship between enrollment timing and testing outcome is assumed to be linear in local linear regression models.
eSlope comparison is from separate linear regression models comparing the 2 years before Treat-All adoption and after adoption.
Effect of Treat-All on Pre-ART CD4 Testing (Regression Discontinuity Analysis)
In L/LMICs, there was a substantial decrease in pre-ART CD4 testing after Treat-All adoption, with an 8.9-pp decrease (95% confidence interval [CI: −11.0, −6.8) among adults, from 57.0% of patients enrolling in care just before Treat-All adoption to 48.1% just afterwards (Table 2 and Figure 1A). Statistically nonsignificant decreases were observed among adolescents and children. In H/UMICs, where pre-ART CD4 testing was almost universal (90.1%) among adults just before Treat-All adoption, there was a small increase just afterwards (+1.6; 95% CI: +0.2, +3.0), with no changes among adolescents or children (Table 3). The TED estimates were near zero, and RD estimates were robust to alternative bandwidths (Supplementary Table 2).
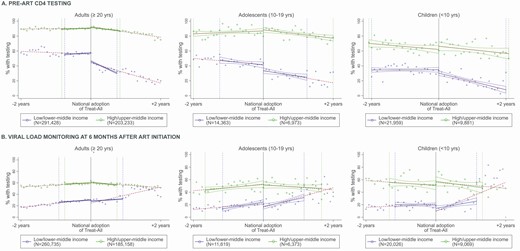
Trends in pre-ART CD4 testing (A) and viral load monitoring (B) before and after Treat-All adoption, by age group and country income level. Solid blue/green lines: Predicted rate of testing within IK bandwidth before and after Treat-All adoption in L/LMICs (dark grey) and H/UMICs (light grey). Dotted lines: Predicted rate of testing in the two years before and after Treat-All adoption. Dotted vertical lines: IK bandwidths in L/LMICs (dark grey) and H/UMICs (light grey). Abbreviations: ART, antiretroviral therapy; IK, Imbens-Kalyanaraman. Refer online version for color figure.
Trends in pre-ART CD4 Testing Before and After Treat-All (Slope Comparison)
During the 2 years before Treat-All adoption, pre-ART CD4 testing began decreasing among adult patients in L/LMICs (−2.1 pp/year; 95% CI: −2.9, −1.4), and the decrease accelerated markedly in the 2 years afterwards (−13.9 pp/year; 95% CI: −14.7, −13.1) (Table 2). Similar decreases in the average annual rate of pre-ART CD4 testing were observed in L/LMICs among adolescents in the 2 years after Treat-All adoption (−9.3 pp/year; 95% CI: −12.5, −6.0) and among children (−12.2 pp/year; 95% CI: −15.8, −8.7).
In H/UMICs, the rate of pre-ART CD4 testing was stable among all patients during the 2 years before Treat-All adoption, and it decreased among adults (−6.6 pp/year; 95% CI: −7.2, −5.9) and adolescents (−5.7 pp/year; 95% CI: −9.1, −2.3) during the 2 years after Treat-All adoption, with no change among children (Table 3).
Viral Load Monitoring After ART Initiation
Overall, 10.6–11.9% of patients enrolling in HIV care from 2006 to 2018 in L/LMICs had a VL test at 6 months after ART initiation, versus 49.3–55.8% of patients in H/UMICs (Tables 4 and 5).
Viral Load Monitoring After Antiretroviral Therapy Initiation, Before and After Treat-All Introduction in Low/Lower-Middle-Income Countries
| Patient Group | |||
|---|---|---|---|
| Adults (>19 Years)a | Adolescents (10–19 Years)b | Children (<10 Years)c | |
| n | 260 735 | 11 619 | 20 026 |
| Viral load monitoring after ART initiation, n (%) | 31 147 (11.9) | 1295 (11.1) | 2128 (10.6) |
| Before Treat-All adoption | 20 930 (9.1) | 938 (9.1) | 1858 (9.9) |
| After Treat-All adoption | 10 217 (34.7) | 357 (26.5) | 270 (22.6) |
| Risk difference at the Treat-All adoption threshold, PP (95% CI)d | −1.7 (−3.5, .2) | −6.0 (−12.5, .5) | −4.7 (−10.6, 1.1) |
| P value | .074 | .069 | .112 |
| Imbens-Kalyanaraman bandwidth, days | 328 | 421 | 423 |
| No. within bandwidth | 37 204 | 2431 | 2463 |
| TED (95% CI) | −.007 (−.017, .003) | −.01 (−.039, .018) | .018 (−.008, .045) |
| TED P value | .174 | .485 | .171 |
| Predicted outcomes at the Treat-All threshold,e (95% CI) | |||
| Enrollment just before Treat-All adoption (%) | 30.1 (28.8, 31.4) | 24.8 (20.4, 29.2) | 19.8 (15.7, 23.9) |
| Enrollment just after Treat-All adoption (%) | 28.5 (27.2, 29.7) | 18.8 (14.0, 23.5) | 15.1 (10.9, 19.2) |
| Relative change at threshold (%) | −5.5 | −24.3 | −23.9 |
| Slopes before and after Treat-All adoptionb | |||
| Percentage point change per year before Treat-All | 7.2 (6.4, 7.9) | 5.0 (2.3, 7.8) | 2.9 (0.4, 5.5) |
| Percentage point change per year after Treat-All | 14.3 (13.2, 15.4) | 15.7 (10.8, 20.6) | 23.4 (17.9, 28.8) |
| P value for interaction term (difference in slopes) | <.0001 | <.0001 | <.0001 |
Abbreviations: ART, antiretroviral therapy; PP, percentage point; CI, confidence interval; TED, treatment effect derivative.
aBurundi, Cambodia, Cameroon, Cote d’Ivoire, Kenya, Lesotho, Malawi, Mozambique, Republic of Congo, Rwanda, Senegal, Tanzania, Uganda, Zimbabwe.
bBenin, Burundi, Cambodia, Cameroon, Cote d’Ivoire, Ghana, India, Kenya, Lesotho, Mozambique, Republic of Congo, Rwanda, Senegal, Tanzania, Uganda, Vietnam, Zimbabwe.
cBenin, Burundi, Cambodia, Cameroon, Cote d’Ivoire, Ghana, India, Kenya, Lesotho, Malawi, Mozambique, Republic of Congo, Rwanda, Tanzania, Uganda, Vietnam, Zimbabwe.
dRisk difference and predicted outcomes at the Treat-All threshold are from regression discontinuity analysis estimating the difference in local linear predictions at the threshold (ie, in the limit, as the threshold is approached from above and below). The Imbens-Kalyanaraman bandwidth defines the region in which the relationship between enrollment timing and testing outcome is assumed to be linear in local linear regression models.
eSlope comparison is from separate linear regression models comparing the 2 years before Treat-All adoption and after adoption.
Viral Load Monitoring After Antiretroviral Therapy Initiation, Before and After Treat-All Introduction in High/Upper-Middle-Income Countries
| Patient Group | |||
|---|---|---|---|
| Adults (>19 Years)a | Adolescents (10–19 Years)b | Children (<10 Years)c | |
| n | 185 158 | 6373 | 9069 |
| Viral load monitoring after ART initiation, n (%) | 103 273 (55.8) | 3144 (49.3) | 4773 (52.6) |
| Before Treat-All adoption | 83 411 (55.2) | 2447 (49.3) | 4391 (52.6) |
| After Treat-All adoption | 19 862 (58.1) | 697 (49.5) | 382 (52.8) |
| Risk difference at the Treat-All adoption threshold, PP (95% CI)d | 2.9 (.5, 5.4) | −5.0 (−13.5, 3.4) | 7.7 (−3.7, 19.2) |
| P value | .020 | .241 | .186 |
| Imbens-Kalyanaraman bandwidth, days | 275 | 596 | 472 |
| No. within bandwidth | 23 939 | 2141 | 1172 |
| TED (95% CI) | −.018 (−.034, −.002) | −.019 (−.044, .005) | −.014 (−.057, .028) |
| TED P value | .026 | .123 | .515 |
| Predicted outcomes at the Treat-All threshold,d (95% CI) | |||
| Enrollment just before Treat-All adoption (%) | 58.2 (56.4, 60.0) | 54.6 (48.4, 60.8) | 50.7 (42.6, 58.9) |
| Enrollment just after Treat-All adoption (%) | 61.1 (59.5, 62.8) | 49.6 (43.9, 55.3) | 58.5 (50.4, 66.5) |
| Relative change at threshold (%) | 5.0 | −9.2 | 15.2 |
| Slopes before and after Treat-All adoptione | |||
| Percentage point change per year before Treat-All | 3.4 (2.4, 4.3) | 6.3 (1.4, 11.2) | −3.7 (−9.1, 1.7) |
| Percentage point change per year after Treat-All | −4.2 (−5.2, −3.2) | −3.0 (−8.1, 2.0) | −4.7 (−11.7, 2.4) |
| P value for interaction term (difference in slopes) | <.0001 | .009 | .834 |
Abbreviations: ART, antiretroviral therapy; PP, Percentage point; CI, confidence interval; TED, treatment effect derivative.
aCanada, China including Hong Kong SAR, South Africa, South Korea, United States.
bCanada, Malaysia, South Africa, South Korea, Thailand, United States.
cMalaysia, South Africa, Thailand.
dRisk difference and predicted outcomes at the Treat-All threshold are from regression discontinuity analysis estimating the difference in local linear predictions at the threshold (ie, in the limit, as the threshold is approached from above and below). The Imbens-Kalyanaraman bandwidth defines the region in which the relationship between enrollment timing and testing outcome is assumed to be linear in local linear regression models.
eSlope comparison is from separate linear regression models comparing the 2 years before Treat-All adoption and after adoption.
Effect of Treat-All on Viral Load Monitoring (Regression Discontinuity Analysis)
There were statistically nonsignificant decreases in VL monitoring among adults, adolescents, and children in L/LMICs after Treat-All adoption (Table 4). In contrast, in H/UMICs, a small but significant increase in VL monitoring was observed among adults (+2.9 pp; 95% CI: 0.5, 5.4), from 58.2% of patients enrolling in care just before Treat-All adoption to 61.1% just afterwards (Table 5). No significant changes were observed among adolescents or children.
Treatment effect derivative estimates were close to zero or nonsignificant. In H/UMICs, sensitivity analyses generated qualitatively consistent results (Supplementary Table 3B). In L/LMICs, sensitivity analyses estimated with bandwidths larger than the IK bandwidths showed statistically significant decreases in VL monitoring among adults, adolescents, and children after Treat-All adoption. Sensitivity analyses that excluded patients enrolling in the 9 months before Treat-All adoption also showed a significant decrease in VL monitoring among children in L/LMICs (−7.4 pp; 95% CI: −13.1, −1.8), with no change among adults or adolescents (Supplementary Table 3A and Supplementary Figure 2).
Viral Load Monitoring Trends Before and After Treat-All (Slope Comparison)
While RD results showed no changes in VL monitoring after Treat-All adoption in L/LMICs, rates of VL monitoring, which began increasing prior to Treat-All, continued to increase among all age groups during the 2 years after Treat-All adoption, and the average annual rate of increase was significantly and markedly higher than during the 2 years prior (Table 4 and Figure 1B). In contrast, in H/UMICs where levels were already high, the average annual rate of VL monitoring among adults decreased slightly in the 2 years after Treat-All adoption—a change from pre–Treat-All trends (Table 5). Among adolescents in H/UMICs, the rate of VL monitoring stopped increasing after Treat-All adoption, and there was no significant change in the rate of VL monitoring among adolescents and children in H/UMICs.
DISCUSSION
National adoption of Treat-All policies has been followed by substantial decreases in pre-ART CD4 testing among adults in L/LMICs, whereas there were small but significant increases in pre-ART CD4 testing among adults in H/UMICs. While the elimination of CD4 count–based eligibility requirements has improved access to life-saving HIV treatment in L/LMICs, decreases in pre-ART CD4 testing may be an unintended consequence of Treat-All adoption. These decreases may have substantial clinical importance in settings where many patients enroll in HIV care with advanced disease [32] and are at risk of early mortality prior to and immediately after ART initiation [4]. Without pre-ART CD4 testing, many who would benefit from differentiated care for advanced HIV, as well as screening, prophylaxis, and treatment for OIs, are unlikely to be identified [4]. Although other studies have found no evidence that Treat-All adoption “crowds out” sicker patients [12, 21], the elimination of CD4 testing for ascertaining treatment eligibility may have led to declines in the quality of care for some PLWH under Treat-All.
No changes in pre-ART CD4 testing were observed among children—results that are in line with expectations, as pediatric Treat-All policies were recommended by the WHO and incorporated into national treatment guidelines before ART eligibility expansions for older age groups [33]. Nonetheless, low rates of pre-ART CD4 testing in children in L/LMICS are concerning, as late diagnosis of HIV among children remains prevalent in low-resource settings because of gaps in capacity for early infant diagnosis and rapid disease progression among children [34–37]. Children living with HIV, particularly those entering care with advanced HIV, also have persistently high mortality rates [36, 38].
It could be theorized that decreases in pre-ART CD4 testing in L/LMICs reflect the reallocation of resources toward VL monitoring, which has long been recommended over CD4 testing for identifying treatment failure [17]. Although rates of VL monitoring were increasing among all age groups in L/LMICs in the 2 years before Treat-All adoption, and the rate of change increased afterwards, with marked improvements by 2 years after Treat-All adoption, the lack of any immediate increases in VL monitoring in L/LMICs at Treat-All adoption likely reflects the limited capacity for VL monitoring in these settings at the time of Treat-All adoption, as well as delays in adopting WHO guidance on VL monitoring [39].
Importantly, our analysis highlights stark disparities in HIV-related laboratory monitoring by country income level that have been exacerbated by Treat-All policies. For pre-ART CD4 testing, these disparities appear to have widened just after Treat-All adoption, with adult patients in H/UMICs more than twice as likely as those in L/LMICs to have pre-ART CD4 testing and VL monitoring after ART initiation. These disparities were even larger among adolescents and children. Disparities in pre-ART CD4 testing have continued to widen after Treat-All adoption. Although disparities in VL monitoring appear to be lessened since Treat-All adoption, 2 years after Treat-All adoption fewer than half of all patients in L/LMICs had a VL test 6 months after initiating ART.
The use of a sharp RD design and real-world service delivery data across more than 200 HIV clinics in high- and low-resource settings are important strengths of this analysis. Analogous to a randomized controlled trial with perfect compliance when certain assumptions are met [28], this design provides support for interpreting differences in laboratory monitoring at the Treat-All threshold as causal effects. Important limitations should also be noted. First, limited data on patient characteristics restricted our ability to comprehensively assess differences between those enrolling in HIV care before and after Treat-All adoption. Where differences in the age and sex distributions of patients were observed, they were small in magnitude and did not influence effect estimates. Second, lags in clinic-level introduction of Treat-All policies relative to national policy adoption are known to have varied across clinics and countries included in this analysis, particularly in high-resource settings [22]. Small and nonsignificant changes in laboratory monitoring may reflect the heterogeneous timing of Treat-All policy introduction at clinics in these settings. In L/LMICs, where we have previously found minimal lags in clinic-level introduction of national Treat-All policies [22], our near-zero and nonsignificant TED estimates suggest that marginal differences in the timing of Treat-All introduction at the clinic level would have minimal influence on our effect estimates. Finally, pooling data from diverse clinics and settings within broad country income-group classifications likely masks substantial heterogeneity between ART programs and countries. Accordingly, further research to examine the impact of Treat-All adoption on laboratory testing practices at regional and national levels and by level of the health system is warranted, along with research on prophylactic treatment of OIs in settings where pre-ART CD4 testing is not performed.
Conclusions
While WHO’s Treat-All recommendation has increased access to life-saving treatment, it significantly reduced pre-ART CD4 testing among adult patients in L/LMICs, and disparities between high- and low-income settings in laboratory monitoring around ART initiation have widened with the roll-out of Treat-All. This may have exacerbated gaps in the quality of HIV care and related disparities. Given the importance of pre-ART CD4 testing for the identification of individuals who would benefit from an enhanced treatment package, including prophylaxis against OIs, and for efforts to track progress related to population-level goals of earlier diagnosis and treatment initiation, donors and governments should identify and address barriers to pre-ART CD4 testing while continuing to support the scale-up of VL testing.
Supplementary Data
Supplementary materials are available at Clinical Infectious Diseases online. Consisting of data provided by the authors to benefit the reader, the posted materials are not copyedited and are the sole responsibility of the authors, so questions or comments should be addressed to the corresponding author.
Notes
Acknowledgments. The authors acknowledge the patients and staff at all facilities who contributed data to this study, as well as the site investigators and data managers across the IeDEA collaboration (see Supplementary File 2).
Disclaimer. This work is solely the responsibility of the authors and does not necessarily represent the official views of any of the institutions mentioned below.
Financial support. This work was supported by the US National Institutes of Health’s National Institute of Allergy and Infectious Diseases; the Eunice Kennedy Shriver National Institute of Child Health and Human Development; the National Cancer Institute; the National Institute of Mental Health; the National Institute on Drug Abuse; the National Heart, Lung, and Blood Institute; the National Institute on Alcohol Abuse and Alcoholism; the National Institute of Diabetes and Digestive and Kidney Diseases; the Fogarty International Center; and the National Library of Medicine: Asia-Pacific (grant number U01AI069907); Caribbean, Central and South America network for HIV epidemiology (CCASAnet) (grant number U01AI069923); Central Africa (grant number U01AI096299); East Africa (grant number U01AI069911); North American AIDS Cohort Collaboration on Research and Design (NA-ACCORD) (grant number U01AI069918); Southern Africa (grant number U01AI069924); West Africa (grant number U01AI069919).
Potential conflicts of interest. K.N.A. reports grants from the National Institutes of Health (NIH) during the conduct of this study, as well as personal fees from the All of Us study, Trio Health, and MedIQ, outside the submitted work. K.W.-K. reports grants from NIH during the conduct of this study and grants from NIH outside the submitted work. E.B., O.T., and J.S.L. report grants from NIH. The authors: reported no conflicts of interest. All authors have submitted the ICMJE Form for Disclosure of Potential Conflicts of Interest. Conflicts that the editors consider relevant to the content of the manuscript have been disclosed.
International Epidemiology Databases to Evaluate AIDS (IeDEA) Consortium

