


Abstract
Antimicrobial use (AU) in days of therapy per 1000 patient-days (DOT/1000 pd) varies widely among children’s hospitals. We evaluated indirect standardization to adjust AU for case mix, a source of variation inadequately addressed by current measurements. Hospitalizations from the Pediatric Health Information System were grouped into 85 clinical strata. Observed to expected (O:E) ratios were calculated by indirect standardization and compared with DOT/1000 pd. Outliers were defined by O:E z-scores. Antibacterial DOT/1000 pd ranged from 345 to 776 (2.2-fold variation; interquartile range [IQR] 552–679), whereas O:E ratios ranged from 0.8 to 1.14 (1.4-fold variation; IQR 0.93–1.05). O:E ratios were moderately correlated with DOT/1000 pd (correlation estimate 0.44; 95% confidence interval, 0.19–0.64; P = .0009). Using indirect standardization to adjust for case mix reduces apparent AU variation and may enhance stewardship efforts by providing adjusted comparisons to inform interventions.
Optimizing antimicrobial use (AU) to prevent resistance is a public health priority, yet no gold standard exists for inpatient antimicrobial prescribing quality [1, 2]. Interhospital comparison of AU may drive improvement by defining standards and identifying opportunities for improvement [3]. One challenge for AU benchmarking is accounting for differences in composition of diagnoses and procedures among hospitals, which are likely to be a source of substantial and largely appropriate AU variation [4–8]. Methods to adjust for case mix should ideally “equalize” populations so that adjusted AU measurements more accurately reflect true practice variation. Case mix–adjusted metrics can increase clinician confidence and likelihood of initiating improvement [9].
Among children’s hospitals, despite reduced AU with implementation of antimicrobial stewardship programs (ASPs), AU based on the unadjusted measure of antimicrobial days of therapy per 1000 patient days (DOT/1000 pd) varies widely, even across comparable hospital locations such as pediatric intensive care units [5, 10–14]. This variation is hypothesized to arise in part from discretionary variation in practice, but with a component influenced by case mix and other patient-level risk factors [5, 13, 14]. Adjusting AU for case mix could enable more definitive assessment of practice variation and improvement opportunities. Various risk adjustment strategies for AU have been developed, some using regression modeling with adjustment based on hospital-level and unit-level predictors—including the National Healthcare Safety Network (NHSN) Standardized Antimicrobial Administration Ratios (SAARs)—with some incorporating patient-level predictors [7, 8, 15–19]. Applicability of these strategies to children’s hospitals is not established. One challenge in using location-based predictors is that children with similar diagnoses receive care in disparate locations across hospitals because of differences in unit availability and variable thresholds for admission to intensive care [20–23]. Development of a straightforward method to adjust children’s hospital AU for diagnoses and procedures using readily available predictors could enable better informed comparisons.
Indirect standardization is a method previously applied to adjust adult AU for clinical care indications [16, 24, 25]. Standardization is commonly used in epidemiology to compare event rates in populations of varying composition (eg, standardized mortality ratio, standardized infection ratio), with results translated into observed to expected ratios (O:E) [26–29]. One advantage of standardization over regression is that the approach can readily identify outlier clinical conditions or service lines within a hospital, enabling targeted antimicrobial stewardship. Our primary objective herein was to adapt an indirect standardization method to adjust children’s hospital AU for differences in case mix, and to evaluate this method’s utility for interhospital comparison and outlier detection.
METHODS
Data Source and Patient Population
A multicenter retrospective cohort study was conducted with data from the Pediatric Health Information System (PHIS) (Children’s Hospital Association, Lenexa, KS). The PHIS database contains administrative claims data from 51 children’s hospital systems in the United States. Participating hospitals are located in 28 states and the District of Columbia and represent approximately 15% of US pediatric hospitalizations. Data are deidentified before inclusion, and quality is ensured through a joint effort between Children’s Hospital Association and participating hospitals. This study was exempted from review per University of California San Francisco Institutional Review Board self-certification criteria. Hospitals participating in PHIS with complete AU data from January 1, 2016, to December 31, 2018, were included, with final analysis performed on a dataset from July 30, 2020. Within each hospital, all inpatient and observation hospitalizations were included, including neonatal hospitalizations.
Antimicrobial Use Measurements
Antimicrobial DOT were calculated as previously described according to calendar day of administration and summed within the following NHSN pediatric SAAR categories: all antibacterial agents (ALL), broad spectrum antibacterial agents predominantly used for hospital-onset infections (BSHO), broad spectrum antibacterial agents predominantly used for community-onset infections (BSCA), and antibacterial agents predominantly used for resistant Gram-positive infections (GramPos) [30, 31]. Routes of administration included intravenous, intramuscular, enteral, and/or inhaled as specified in NHSN protocols. For the purpose of this analysis, antimicrobials used during neonatal hospitalizations were categorized into pediatric SAAR categories; antimicrobials in the ALL category are equivalent for neonatal and pediatric SAARs [18].
Defining Strata for Standardization
The indirect standardization approach is summarized schematically in Figure 1. Clinical strata for indirect standardization were developed based on All Patients Refined Diagnosis Related Groups (APR-DRGs, version 36) [32]. APR-DRGs are based on proprietary hierarchical coding of the main indication for hospitalization and are mutually exclusive classifications that are widely used in healthcare payment, benchmarking, and case mix adjustment [33–36]. APR-DRGs were grouped together into a smaller number of strata through an iterative consensus-based process by 3 pediatric infectious diseases specialists (R. W., R. B., A. H.) using predefined criteria detailed in the Supplementary Material. Final clinical strata were further grouped into 15 “service lines”; mapping of APR-DRGs to clinical strata and service lines is detailed in Supplementary Table 2.
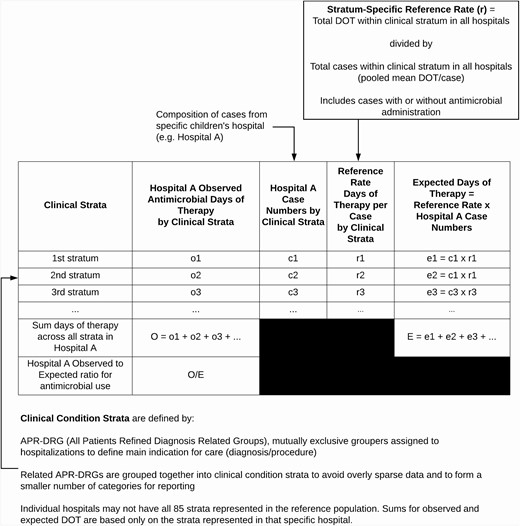
Schematic for applying the indirect standardization method to children’s hospitals’ antimicrobial use data to calculate observed to expected (O:E) ratios for interhospital comparison. The same calculations are applied to each hospital.
Stratum-Specific Reference Rates
Within each clinical stratum, the stratum-specific reference AU rate was the pooled mean DOT/case (within each AU category: ALL, BSHO, BSCA, and GramPos) from the reference population of all hospitalizations within participating hospitals for 2016 through 2018. The term “case” is used to refer to any hospitalization grouped within a stratum, regardless of whether an antimicrobial was given. The rationale for reference rate calculations is detailed in the Supplementary Material.
Observed to Expected Ratios
Stratum-specific reference rates were derived from 2016 through 2018 data; however, the O:E ratios were calculated using data from individual hospitals from the year 2018 only. Stratum-specific case numbers from each hospital in 2018 were multiplied by the stratum-specific reference rate (mean DOT/case) to calculate a stratum-specific expected DOT. Within each hospital, the expected DOT were summed across all strata. The observed DOT for each hospital was the actual measured DOT from the hospital for 2018, excluding DOT associated with hospitalizations assigned to 18 APR-DRGs excluded because of inadequately specific description (Supplementary Table 1).
Measurements Compared With Observed to Expected Ratios
Indirectly standardized O:E ratios were compared with unadjusted DOT/1000 pd calculated for the same cases in 2018 (excluding those cases assigned to 18 excluded APR-DRGs), with patient days calculated by calendar days admitted and summed for the entire hospital population. To compare ratios on an equivalent scale, a “normalized” O:E ratio was derived by setting the mean DOT/1000 pd among all hospitals as the expected value and each individual hospital’s DOT/1000 pd as the observed value.
Outlier Detection
Outlier hospitals were identified by calculating z-scores based on indirectly standardized O:E ratios. For each hospital, the O:E ratio was subtracted from the mean O:E ratio among all hospitals and divided by the corresponding standard deviation. If the resulting z-score was above 1.28 (above 90th percentile), the hospital was defined as a high outlier. If the resulting z-score was below –1.28 (below 10th percentile), the hospital was defined as a low outlier. Outlier conditions within each hospital were defined based on the same calculations but applied to the mean DOT/case and corresponding standard deviation.
Analysis
We hypothesized that a substantial portion of AU variation between children’s hospitals is attributable to case mix and therefore the approach developed here would attenuate variability between hospitals. To evaluate this hypothesis, within each AU category, indirectly standardized O:E ratios were compared with unadjusted DOT/1000 pd and the “normalized O:E ratio” as described using measures of variation (range, interquartile range [IQR]), correlation plots and coefficients. Performance of indirect standardization for outlier detection was evaluated by comparing hospitals’ outlier classification by indirect standardization versus unstandardized DOT/1000 pd. Stratum-specific data from hospitals with discordant classification were examined in detail to evaluate reasons for discordant classification. All statistical analyses were performed in SAS, version 9.4 (SAS Institute, Cary, NC).
RESULTS
A total of 2 528 622 hospitalizations from 51 hospitals were evaluated. Hospitalizations represented 326 APR-DRGs, which were grouped into 85 clinical strata for indirect standardization (Supplementary Figure 1, Supplementary Table 1). The reference population for deriving expected values included 2 433 846 hospitalizations following exclusion of 18 APR-DRGs with inadequately specific description; excluded APR-DRGs accounted for only 3.7% of cases and 5.5% of antibacterial DOT in the initial population. Observed values were derived from 826 880 hospitalizations in 2018; 375 273 (45%) involved receipt of at least 1 antibiotic.
Indirectly Standardized O:E Ratios vs Unstandardized Measurements
Indirectly standardized O:E ratios showed less apparent interhospital variation than unstandardized DOT/1000 pd. For all NHSN-monitored antibacterials (ALL), unstandardized DOT/1000 pd ranged from 345 to 776 (2.2-fold variation; IQR 552-679), whereas indirectly standardized O:E ratios ranged from 0.8 to 1.14 (1.4-fold variation; IQR 0.95-1.03) (Figure 2). Similarly, narrow ranges were observed for indirectly standardized O:E ratios for the BSHO (0.82-1.20), BSCA (0.75-1.23), and GramPos (0.76-1.38) categories.
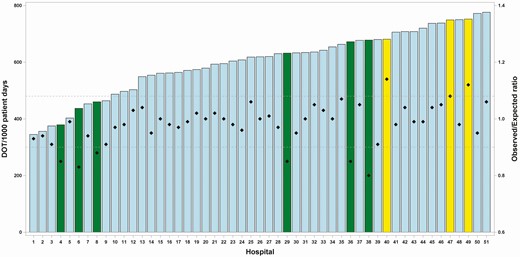
Children’s hospitals’ ALL antibacterial use metrics showing individual hospitals labeled on the X-axis, ordered by level of unadjusted antibacterial DOT/1000 pd (left axis), represented by bars. Diamonds represent O:E ratios derived by indirect standardization (right axis). Outlier hospitals (low and high) are highlighted in yellow (high outlier hospitals) and green (low outlier hospitals). Dashed horizontal lines represent 10th percentile (lower) and 90th percentile (upper) limits of the O:E ratio distribution. Abbreviations: ALL, all antibacterial agents; ODT/1000 pd, days of therapy per 1000 patient days; O:E, observed to expected ratio.
Figure 3 shows correlations between indirectly standardized O:E ratios and normalized O:E ratios (each hospital’s unstandardized DOT/1000 pd normalized to the mean DOT/1000 pd across all hospitals). There was a moderate degree of positive correlation between indirectly standardized O:E and normalized O:E for the categories ALL (correlation estimate 0.44; 95% confidence interval [CI], 0.19-0.64; P = .0009), BSHO (correlation estimate 0.42; 95% CI, 0.16-0.62; P = .002), and GramPos (correlation estimate 0.40; 95% CI, 0.14-0.61; P = .003). For BSCA antibacterials, there was a nonstatistically significant weakly positive correlation between indirectly standardized O:E and normalized O:E (correlation estimate 0.27; 95% CI, –0.004 to 0.50; P = .05).
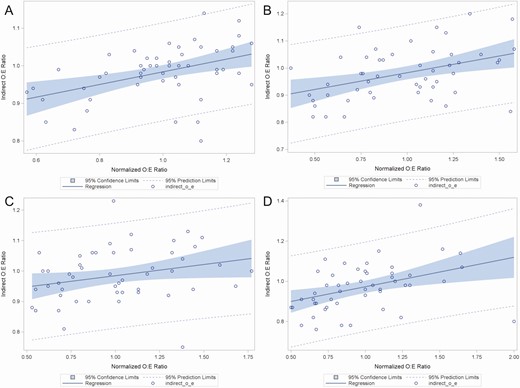
Correlation plots between “normalized O:E ratios” (X-axis) derived by dividing the antimicrobial days of therapy per 1000 patient-days (DOT/1000 pd) for each individual hospital by the mean DOT/1000 pd among all hospitals, and “indirect O:E ratios” (Y-axis) derived by indirect standardization. Panels represent correlations for antimicrobial groups defined by the National Healthcare Safety Network Antimicrobial Use Option. A All antibacterial agents (ALL); B broad spectrum antibacterial agents predominantly used for hospital-onset infections (BSHO); C broad spectrum antibacterial agents predominantly used for community-onset infections (BSCA); D antibacterial agents predominantly used for resistant Gram-positive infections (GramPos).
Classification of outlier hospitals for ALL antibacterials by indirectly standardized O:E versus unstandardized DOT/1000 pd (Table 1) was concordant for 39 (75%) of 51 hospitals. Discordant classifications involved reclassification of nonoutliers as outliers and vice versa, without changes in direction (high or low) of outlier status between the 2 methods.
Outlier Hospital Classification of 51 Children’s Hospitals by Indirectly Standardized O:E vs. Unstandardized DOT/1000 pd for ALL Antibacterials Category
| Method: Unstandardized DOT/1000 pd | |||||
|---|---|---|---|---|---|
| Low Outliera Hospitals, N (%) | Nonoutlier Hospitals, N (%) | High Outlierb Hospitals, N (%) | Total, N (%) | ||
| Method: indirectly standardized O:E | Low outliera hospitals, N (%) | 2 (4) | 4 (8) | 0 | 6 (12) |
| Nonoutlier hospitals, N (%) | 4 (8) | 35 (69) | 3 (6) | 42 (82) | |
| High outlierb hospitals, N (%) | 0 | 1 (2) | 2 (4) | 3 (6) | |
| Total, N (%) | 6 (12) | 40 (78) | 5 (10) | ||
Abbreviations: ODT/1000 pd, days of therapy per 1000 patient days; O:E, observed to expected ratio.
aBased on <10th percentile z-score.
bBased on >90th percentile z-score.
Outlier Hospital Examples
We examined stratum-specific data from selected example hospitals to assess how indirect standardization could influence comparisons between them. “Hospital 38” and “Hospital 49” were each within the upper half of hospitals for ALL DOT/1000 pd. By indirect standardization, hospital 49 had an O:E ratio of 1.12 and was classified as a high outlier, whereas hospital 38 had an O:E ratio of 0.80 and was classified as a low outlier (Figure 2).
Stratum-specific AU for each of these hospitals revealed differences between one another and the reference population. Focusing on the 25 conditions with highest total DOT within the reference population that have at least 50 cases in each of the 2 hospitals (Supplementary Table 2), the mean DOT/case in hospital 38 (low outlier) was below the reference rate for 21 of 25 conditions, whereas the mean DOT/case in hospital 49 (high outlier) was above the reference rate for 15 of 25 conditions.
Differences in clinical population composition accounted for hospital 38 having a low O:E ratio, while its unstandardized DOT/1000 pd was comparatively high. Hospital 38 had a lower proportion of neonatal cases than the reference population, with 3% of cases within neonatal strata versus 12% of cases in the reference population. Because neonatal cases contribute disproportionately to patient days versus antibacterial DOT, hospitals with fewer neonatal cases may have higher DOT/1000 pd despite having stratum-specific AU equivalent to or lower than peers [13]. Across all hospitals, there was a moderate negative correlation between the percentage of cases within neonatal strata and ALL DOT/1000 pd (correlation estimate –0.52; 95% CI, –0.70 to –0.30; P < .001), such that hospitals with a higher percentage of neonatal cases had lower DOT/1000 pd than those with a lower percentage of neonatal cases. The indirectly standardized O:E ratio mitigates the influence of these clinical population differences, reflecting observed versus expected AU for the cases reported from each hospital.
Identifying Outlier Clinical Conditions and Service Lines
Hospitals’ stratum-specific data can be examined to identify clinical strata for which AU substantially differs from peers. In the example of hospitals identified, applying the same outlier definitions to individual strata as for the overall O:E ratio, hospital 38 (low outlier) had 2 high outlier clinical strata, 50 nonoutlier clinical strata, and 25 low outlier clinical strata. Hospital 49 (high outlier) had 18 high outlier clinical strata, 61 nonoutlier clinical strata, and 1 low outlier clinical stratum. Identifying high outlier conditions could enable clinicians to target improvements in antimicrobial stewardship. For example, a clinician in hospital 49 may choose to focus stewardship efforts on patients with pneumonia/major respiratory tract infections and bronchiolitis/respiratory syncytial virus pneumonia, both clinical strata for which this hospital is a high outlier and that comprise a substantial proportion of hospitalizations. Identifying low outlier clinical strata may be beneficial in highlighting hospitals with best practices to sustain and spread.
To facilitate hospitals reviewing and reporting AU data by clinical categories, the 85 clinical strata were grouped into 15 clinical service lines, each of which can be assigned an O:E ratio using the same approach used for overall hospital AU. Figure 4 shows a violin plot distribution of hospital O:E ratios within each clinical service line, demonstrating variation in O:E ratios. A hospital seeking opportunities for antimicrobial stewardship may start by reviewing the overall O:E ratio, then reviewing service line O:E ratios and subsequently focusing on clinical strata within service lines that have high O:E.
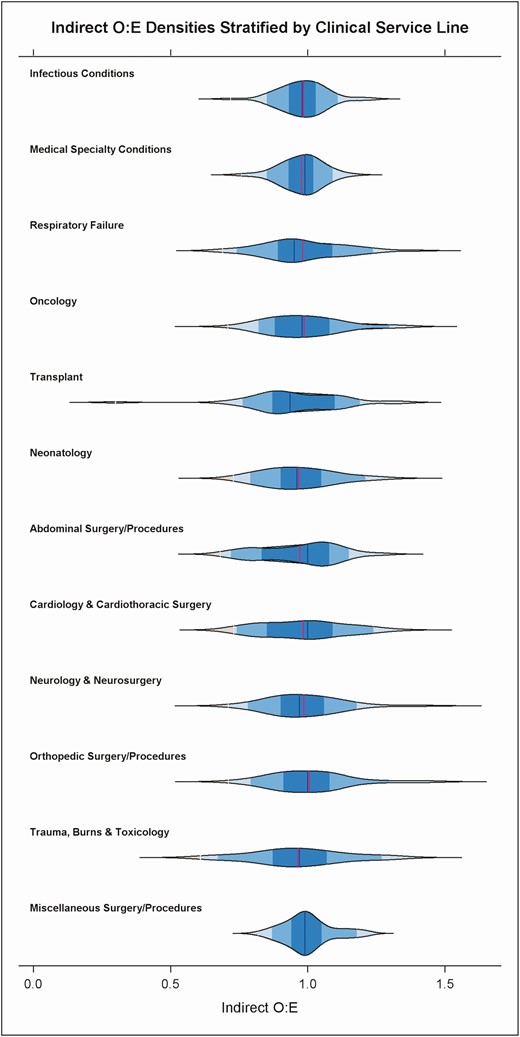
Violin plot showing density distribution of hospitals’ O:E ratios for ALL antibacterial use within clinical service lines defined by further grouping 85 clinical strata. The Obstetrics and Gynecology, Mental Health and Rehabilitation service lines are not displayed on the graph because of low antimicrobial use. Labels on the Y-axis indicate clinical service line categories. Abbreviations: ALL, all antibacterial agents; O:E, observed to expected ratio.
DISCUSSION
In this multicenter retrospective cohort study, we adapted a method of indirect standardization to adjust children’s hospitals’ AU for differences in case mix. The approach produces O:E ratios that show reduced interhospital variation when compared to unstandardized DOT/1000 pd, supporting the hypothesis that variation in case mix is an important contributor to observed variation in DOT/1000 pd. With adjustment for case mix, remaining interhospital variation in O:E ratios is more likely to reflect other factors such as discretionary variation in practice. We demonstrated that hospitals with similarly high antimicrobial DOT/1000 pd can have discordant outlier status when their AU is adjusted for case mix. Furthermore, stratum-specific data can then be used to identify specific conditions as targets for antimicrobial stewardship.
Our approach is similar to one that Polk et al applied to adult AU data; strata were formed from 35 clinical service lines defined by Medicare Severity-Diagnosis Related Groups [24]. Similar to our findings, discordance was observed between unadjusted DOT/1000 pd and indirectly standardized O:E ratios; however, variability in adult AU at the time was not clearly attenuated by indirect standardization.
Yu et al developed AU benchmarking models incorporating clinical diagnoses, unit type, presence of infection on admission, and history of antibiotic-resistant infection [7]. Goodman et al compared those models with one developed by consensus using comorbidity indices from adult claims data; both models predicted AU better than models with only facility predictors akin to NHSN SAARs [8]. These findings support the hypothesis that diagnoses are important contributors to AU and should be included in benchmarking models; expert commentary accompanying the Yu et al study supported inclusion of patient-level case mix adjustment to improve national AU metrics [37]. These regression-based approaches are advantageous in adjusting for multiple variables, whereas indirect standardization can adjust for a limited set of characteristics that define mutually exclusive strata. However, indirect standardization is computationally straightforward in comparison and therefore potentially more feasible for ASPs to implement. Additionally, the comorbidity indices in the Goodman et al models are primarily adult-oriented and may not adequately capture drivers of AU in children’s hospitals [38, 39].
At this time, we cannot directly compare children’s hospital O:E ratios derived from indirect standardization to SAARs calculated within the NHSN AU option. The methods are similar in producing an O:E ratio based on data from comparator hospitals. The NHSN approach adjusts for predominantly location and hospital-specific variables and does not incorporate diagnoses or procedures [31]. However, our study and others in adult, pediatric, and neonatal settings support inclusion of patient-level information such as diagnoses, procedures, and/or diagnostic groupers to explain AU variation [4–8]. Developers of the NHSN AU models have expressed interest in including patient-level data in subsequent models; the approach developed here could provide a viable option to do so [19].
Limitations of our approach include the definition of clinical strata using APR-DRGs, which may be susceptible to misclassification based on variation in documentation and coding [32, 40]. Because APR-DRG coding is proprietary, the criteria are not amenable to independent validation. Furthermore, a single APR-DRG assigned to each hospitalization is unlikely to completely capture all features that contribute to patient complexity or drive AU. The O:E ratios do not necessarily define optimal AU but can be considered a measure of “typical” AU compared with peers. Despite these limitations, the approach provides a greater degree of adjustment for clinical conditions than unstandardized DOT/1000 pd. Currently, APR-DRGs are the most detailed clinical classification system for pediatric hospitalizations [9]. The indirect standardization method would be adaptable to a different classification system if another emerges with improved specificity. Another limitation is that expected AU values are influenced more heavily by hospitals with larger case numbers because of use of a pooled mean DOT/case as the reference value. This does not necessarily influence the degree of adjustment for variation but may bias outlier detection. With application of this method over time, it would be important to periodically update expected values to reflect more current AU patterns in the reference population. Additionally, the method as currently applied does not incorporate severity of illness, a component of the APR-DRG system that may influence AU. Subsequent enhancement of the method could incorporate targeted substratification by severity of illness.
This indirect standardization approach could be readily used to calculate O:E ratios and identify outlier hospitals within other administrative datasets with pediatric hospitalizations. Because PHIS hospitals are predominantly freestanding children’s hospitals, complex conditions and procedures are likely overrepresented in the study population versus all US pediatric hospitalizations. However, common pediatric conditions such as asthma are also well represented in PHIS (Supplementary Table 1), enabling calculation of robust reference rates. Because each hospital’s expected AU is calculated based on its own mix of cases, we anticipate this approach will translate across different pediatric care settings, though generalizability should be evaluated in subsequent studies. With modification of clinical strata, the approach could also be adapted to adult AU adjustment. Further clinical validation is needed to understand the method’s utility, especially the extent to which it provides actionable data to support practice improvement [41].
In summary, we demonstrated an indirect standardization approach to children’s hospitals AU benchmarking that can account for differences in composition of diagnoses and procedures between hospitals. This results in greater apparent comparability between hospitals’ O:E measurements and provides more informative comparison than unadjusted DOT/1000 pd. The approach can be adapted for more specific comparisons including clinical conditions, patient populations, or antimicrobial agents. We propose evaluation of the method prospectively as a tool for ASPs to understand and improve antimicrobial use.
Supplementary Data
Supplementary materials are available at Clinical Infectious Diseases online. Consisting of data provided by the authors to benefit the reader, the posted materials are not copyedited and are the sole responsibility of the authors, so questions or comments should be addressed to the corresponding author.
Notes
Acknowledgments. The authors thank members of the Pediatric Health Information System Antimicrobial Stewardship Research Group for critical review of the study concept and manuscript: Thomas V. Brogan, MD, University of Washington School of Medicine, Seattle, WA, USA; Joshua D. Courter, PharmD, University of Cincinnati College of Medicine, Cincinnati, OH, USA; Jeffrey S. Gerber, MD, PhD, Perelman School of Medicine at the University of Pennsylvania, Philadelphia, PA, USA; Matthew P. Kronman, MD, MSCE, University of Washington School of Medicine, Seattle, WA, USA; Brian R. Lee, MPH, PhD, University of Missouri-Kansas City School of Medicine, Kansas City, MO, USA; Mari M. Nakamura, MD, MPH, Harvard Medical School, Boston, MA, USA; Jason G. Newland, MD, MEd, Washington University School of Medicine, St. Louis, MO, USA; Sameer J. Patel, MD, Northwestern University Feinberg School of Medicine, Chicago, IL, USA; Samir S. Shah, MD, MSCE, University of Cincinnati College of Medicine, Cincinnati, OH, USA; Michael J. Smith, MD, MSCE, Duke University School of Medicine, Durham, NC, USA; and Alicen B. Spaulding, PhD, MPH, Children’s Minnesota Research Institute, Minneapolis, MN, USA.
Financial support. C. W. T. is employed by the Children’s Hospital Association, which administers the Pediatric Health Information System database. The remaining authors received no specific funding for this work.
Potential conflicts of interest. The authors: No reported conflicts of interest. All authors have submitted the ICMJE Form for Disclosure of Potential Conflicts of Interest. Conflicts that the editors consider relevant to the content of the manuscript have been disclosed.
References
3M.

