


Abstract
Although multiple respiratory viruses circulate in humans, few studies have compared the incidence of different viruses across the life course. We estimated the incidence of outpatient illness due to 12 different viruses during November 2018 through April 2019 in a fully enumerated population.
We conducted active surveillance for ambulatory care visits for acute respiratory illness (ARI) among members of Kaiser Permanente Washington (KPWA). Enrolled patients provided respiratory swab specimens which were tested for 12 respiratory viruses using reverse transcription polymerase chain reaction (RT-PCR). We estimated the cumulative incidence of infection due to each virus overall and by age group.
The KPWA population under surveillance included 202 562 individuals, of whom 2767 (1.4%) were enrolled in the study. Influenza A(H3N2) was the most commonly detected virus, with an overall incidence of 21 medically attended illnesses per 1000 population; the next most common viruses were influenza A(H1N1) (18 per 1000), coronaviruses (13 per 1000), respiratory syncytial virus (RSV, 13 per 1000), and rhinovirus (9 per 1000). RSV was the most common cause of medically attended ARI among children aged 1–4 years; coronaviruses were the most common among adults aged ≥65 years.
Consistent with other studies focused on single viruses, we found that influenza and RSV were major causes of acute respiratory illness in persons of all ages. In comparison, coronaviruses and rhinovirus were also important pathogens. Prior to the emergence of severe acute respiratory syndrome coronavirus 2 (SARS-CoV-2), coronaviruses were the second-most common cause of medically attended ARI during the 2018/19 influenza season.
Many respiratory viruses circulate in humans, and viral respiratory tract infections occur globally across the life course [1–9]. Respiratory virus infections can be associated with a wide range of illness, including asymptomatic infection, mild respiratory disease (the “common cold”), severe illness, and even death [10–12]. Despite their similarities in infection and modes of transmission, there is considerable heterogeneity in the incidence of disease due to different respiratory viruses. This includes the overall burden of disease and the age groups that are most affected by different viruses [6, 13].
One limitation to our understanding of respiratory virus epidemiology is that published studies have tended to focus on a single virus or on a handful of viruses together. Few studies (eg, [14]) have directly compared the incidence of many viruses within the same population. Furthermore, many studies of respiratory viruses have focused on a subset of the population, such as young children or older adults (eg, [15, 16]) rather than evaluating incidence across the life course.
We conducted the present study to address these knowledge gaps. Using active surveillance for acute respiratory illness (ARI) in outpatient clinics, we estimated the burden of illness in ambulatory care settings for 12 respiratory virus species during the 2018/19 influenza season.
METHODS
Study Population
This study was conducted at the Washington State site of the United States Influenza Vaccine Effectiveness (US Flu VE) Network during the 2018/19 influenza season. Methods for the Network have been described previously [17]. In brief, active surveillance for ARI in ambulatory care settings was conducted at Kaiser Permanente Washington (KPWA). Eligible patients were aged at least 6 months of age and had a cough illness of <8 days’ duration. Eligible and consenting patients (or parent/guardian for minors) were interviewed for demographics, risk factors for ARI, and influenza vaccination history. Study staff collected combined nasal and oropharyngeal swabs (nasal only in children aged <2 years) for respiratory virus testing. Due to low enrollment in infants aged <1 year, the present analysis is restricted to subjects aged 1 year and older.
Laboratory Methods
We extracted total nucleic acids using the Magna Pure nucleic acids extraction kit (Roche). We screened extracted nucleic acids for the presence of respiratory pathogens by TaqMan reverse transcriptase polymerase chain reaction (RT-PCR) on the OpenArray platform (Thermo). Screened viruses included adenovirus (AdV); enterovirus (EntV); human bocavirus (hBoV); human coronavirus (229E, NL63, OC43, HKU1) (hCoV); human metapneumovirus (hMPV), human parainfluenza virus (hPIV 1–4); human parechovirus (hPCV), influenza A(H1N1), A(H3N2), B, and C; respiratory syncytial virus (RSV) A and B; and human rhinovirus (hRV).
Source Population
To estimate the population-based incidence of respiratory viruses, we followed the process previously developed for influenza incidence in this population [5, 18]. We identified the source cohort at risk for ARI and potentially eligible for US Flu VE Network enrollment based on membership in KPWA’s integrated group practice. The source cohort consisted of members aged at least 1 year of age as of 1 September 2018 whose primary care provider was at a medical center where study recruitment occurred. We used KPWA administrative healthcare databases to characterize all members of the source cohort, including those enrolled in the US Flu VE Network, by age, receipt of 2018/19 influenza vaccine, and number of medical encounters for ARI (defined by International Classification of Diseases, Version 10 [ICD-10] codes).
Statistical Analyses
We estimated the cumulative incidence of medically attended respiratory virus infections by extrapolating the number of virus-positive illnesses among US Flu VE Network enrollees to the source population, as previously described [5, 18]. We estimated sampling weights for each US Flu VE Network enrollee relative to the source population, based on joint stratification by age group, receipt of 2018/19 influenza vaccine, and number of ARI medical encounters (0, 1, ≥2) during 2018/19. Network enrollees with zero ARI encounters (ie, those who were not assigned an ARI ICD-10 code at their enrollment visit) were assigned a sampling weight of 1.0. Using the sampling weights, we estimated the total number of ambulatory care visits for each virus individually and for any detected virus in the source cohort. We calculated confidence limits by bootstrapping samples from the source population and the US Flu VE Network enrollees. To avoid double-counting events for persons co-infected with multiple viruses, we grouped all coinfections into a single category for incidence estimation and estimated the virus-specific incidence of disease using only persons with a single detected virus. We did not calculate incidence for viruses with less than 10 detections without coinfection.
We assumed that seasonal respiratory virus circulation occurred between November 2018 and April 2019. Our surveillance ran from 18 November 2018 through 20 April 2019. We upweighted our incidence estimates to account for weeks with missing surveillance. For this, we calculate the proportion of total respiratory virus infections detected by regional surveillance during periods of US Flu Network enrollment and multiplied our burden estimates by the inverse of this proportion.
RESULTS
The source cohort consisted of 202 562 individuals, of whom 46% received the 2018/19 influenza vaccine, and 14% had at least one ambulatory care visit for ARI (Table 1). We enrolled 2767 patients (1.4% of the source cohort) in the US Flu VE Network. Compared to the source cohort, Network enrollees were more likely to be aged <10 years and to have received the 2018/19 influenza vaccine.
Characteristics of the Source Population and of United States Influenza Vaccine Effectiveness Network Enrollees, 2018/19
| Characteristic | Source Population | US Flu VEa Network Enrollees | Percent of Source Population Enrolled |
|---|---|---|---|
| Total population | 202 562 | 2767 | 1.4% |
| Age group | |||
| 1–2 years | 1455 (0.7%) | 92 (3.3%) | 6.3% |
| 2–4 years | 4622 (2.3%) | 160 (5.8%) | 3.5% |
| 5–9 years | 7586 (3.7%) | 229 (8.3%) | 3.0% |
| 10–17 years | 12 321 (6.1%) | 213 (7.7%) | 1.7% |
| 18–30 years | 35 607 (17.6%) | 345 (12.5%) | 1.0% |
| 31–49 years | 57 446 (28.4%) | 641 (23.2%) | 1.1% |
| 50–64 years | 43 645 (21.5%) | 566 (20.5%) | 1.3% |
| 65+ years | 39 880 (19.7%) | 521 (18.8%) | 1.3% |
| Vaccinated | 92 535 (45.7%) | 1674 (60.5%) | 1.8% |
| ARI visits | |||
| 0 | 173 997 (85.9%) | 456 (16.5%) | 0.3% |
| 1 | 19 728 (9.7%) | 1413 (51.1%) | 7.2% |
| 2 or more | 8837 (4.4%) | 898 (32.5%) | 10.2% |
Abbreviation: ARI, acute respiratory illness.
aUS Influenza Vaccine Effectiveness.
We detected 2059 respiratory viruses among 1860 (67.2%) unique US Flu VE Network enrollees. Influenza A viruses were the most commonly detected, with 441 (15.9%) of enrollees having influenza A(H3N2) and 348 (12.6%) influenza A(H1N1) (Supplementary Table 1). The third most common virus detected overall was hCOV (297 enrollees, 10.7%). The least common viruses were hPCV (2 detected, .07%), influenza B (13 detected, .5%), and hBoV (21 detected, .8%). Detected viruses peaked on the week of 4 March 2019, corresponding to the peak of influenza A (H3N2) activity (Supplementary Figure 1).
Coinfections occurred in 179 (9.6%) of the 1860 persons with detected viruses. Coinfection was most common for hPCV (both detections had coinfection), hBoV (66.7%), AdV (50.9%), and influenza C (41.2%). Coinfection was least common for influenza A(H1N1) (8.6%), influenza A(H3N2) (10.2%), and RSV B (11.1%) (Supplementary Table 1). When considering infections with only a single virus isolated, hCoV was the thirdmost common virus in ambulatory care visits for ARI in 2018/19, behind only influenza A(H3N2) and A(H1N1).
The cumulative incidence of medically attended illness for any of the targeted viruses between November and April was 100 visits per 1000 population (95% confidence interval [CI], 97 to 103). In other words, 10% of the population aged 1 year and older sought medical care due to infection with one of these viruses. Incidence was highest among the youngest children (385 per 1000, 95% CI, 314 to 465 in children aged 1–2 years) and declined to a low of 81 per 1000 (95% CI, 69 to 92) among adults aged 31–49 years before increasing among older adults and seniors (Table 2). For individual viruses, incidence ranged from 21 per 1000 (95% CI, 19 to 23) for influenza A(H3N2) to .7 (95% CI, .3 to 1.1) for influenza B (Figure 1). We did not estimate incidence for hBoV or hPCV, as they had less than 10 detected infections without coinfection.
Overall and Age-Specific Incidence of Medically Attended Acute Respiratory Illness With Any Detected Virus, 2018/19
| Age Group | Estimated Incidence | Lower Confidence Limit | Upper Confidence Limit |
|---|---|---|---|
| 1 year | 385 | 312 | 457 |
| 2–4 years | 263 | 218 | 307 |
| 5–9 years | 164 | 130 | 198 |
| 10–17 years | 120 | 98 | 142 |
| 18–30 years | 84 | 69 | 98 |
| 31–49 years | 81 | 69 | 92 |
| 50–64 years | 89 | 76 | 101 |
| 65 years and older | 107 | 90 | 123 |
| All ages | 100 | 97 | 103 |
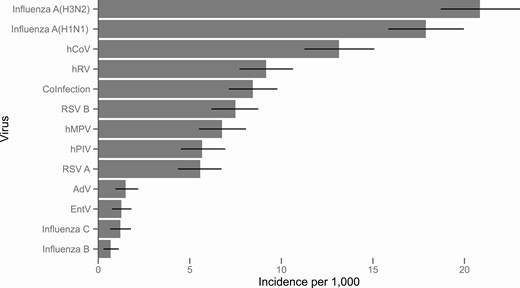
Overall incidence of medically attended illness per 1000 population due to 12 respiratory viruses, 2018/19. Coinfection includes all illnesses with more than one detected virus.
The age distribution of subjects with detected viruses varied between viruses (Supplementary Figure 2). Virus-specific incidence was heterogeneous across age groups (Figure 2). Among individual viruses, RSV A and RSV B were the most common causes of medically attended ARI among children aged 1–2 years (52 and 55 cases per 1000, respectively), followed by hRV (33 per 1000). Coinfections were most common in this age group, with an incidence of 120 cases per 1000.
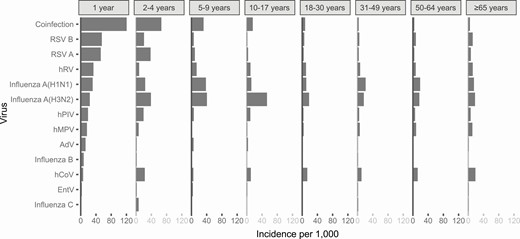
Age-specific incidence of medically attended illness due to 12 respiratory viruses per 1000 population, 2018/19.
Outside of early childhood, influenza A(H3N2) and influenza A(H1N1) tended to have the highest incidence, followed by hCoV. Among seniors, multiple pathogens contributed an approximately similar burden of disease of between 11 and 18 cases per 1000 population: hCoV, hMPV, influenza A(H1N1), influenza A(H3N2), RSV B, and hRV. And hCoV caused the highest incidence (18 cases per 1000 population) of medically attended ARI among seniors.
DISCUSSION
The 2018/19 influenza season in Washington State was dominated by influenza A viruses, with an early wave of A(H1N1) infections followed by a later wave of A(H3N2) viruses, and unusually low circulation of influenza B viruses [19]. In this context, we found that 10% of the population had a medically attended respiratory virus infection between November 2018 and April 2019. Care-seeking for respiratory viruses was as high as 38% among children aged 1–2 years.
Consistent with prior studies [6, 20–22], we found that RSV was the most common pathogen among young children, with a combined incidence RSV A and B of over 100 per 1000 in children aged 1–2 years and nearly 60 per 1000 in children aged 2–4 years. Also consistent with prior studies [23, 24], influenza A viruses were the most common pathogen causing ARI when considering all age groups together. In this study the combined incidence of influenza A viruses was 39 cases per 1000 persons. This is higher than previous studies in this population, which found incidence of influenza A viruses ranging from 8 to 26 cases per 1000 [5, 18] and may be attributed to the unusual 2018/19 season, which saw intensive circulation of both influenza A subtypes. In contrast, the incidence of influenza B (.7 per 1000) was substantially lower than seen in those prior studies (range, 2 to 17 per 1000), consistent with regional surveillance data [19].
Influenza C is being increasingly recognized as a contributor to the burden of respiratory illness in humans [25, 26]. During 2018/19, we found that .7% of ARI ambulatory care had influenza C as the only virus detected. The cumulative incidence of influenza C as the only detected virus was estimated as 1.2 cases per 1000 population, which was higher than influenza B and comparable to the burden due to AdV (1.5 per 1000) and EntV (1.3 per 1000) as solo pathogens.
Prior studies frequently found hCoV among persons with ARI, particularly those with mild illness [27–29]. This study provides one of the first population-based estimates of the incidence of medically attended disease due to hCoV. We found that, prior to the emergence of severe acute respiratory syndrome coronavirus 2 (SARS-CoV-2), human coronaviruses were important contributors to the burden of ARI in this population, second only to influenza A viruses, with an overall incidence of 13 cases per 1000 population during 2018/19. Also, hRV was a common cause of medically attended illness in persons of all ages. Among those aged 2 years or older, the incidence of hRV varied between 7 and 14 cases per 1000.
Several limitations of this study should be considered. First, our surveillance definition required all US Flu VE Network enrollees to have ARI with cough. Our study thus excluded ARI patients that presented for care without a cough and should be considered a lower bound for the total burden of disease in ambulatory care settings due to these viruses. Second, this study only covers a single influenza season, which was somewhat atypical in terms of circulating viruses. Both the absolute and the relative contribution of respiratory viruses to the burden of ARI may be different in other years. Third, due to the primary goals of the US Flu VE Network, enrollment was restricted to children aged ≥6 months, and given low enrollment of patients aged 6–11 months, this analysis excluded patients aged <1 year, among whom the burden of respiratory virus infection is high. Finally, this study was conducted among members of a prepaid health care/insurance provider, who may have different illness thresholds for seeking care than other populations. The absolute incidence of medically attended illness may be different in other populations. An additional caveat is that this study measured incidence among persons seeking ambulatory medical care; the relative prevalence of illness due to these viruses in the community or in inpatient settings may be different.
This study provides one of the first assessments of the contribution of a wide range of respiratory viruses to disease among children, adults, and seniors during periods of influenza circulation. Many viruses have been known to cause respiratory illness among young children; this study shows that viruses such as influenza, hCoV, and hRV also cause a substantial burden of disease among persons of all ages.
Supplementary Data
Supplementary materials are available at Clinical Infectious Diseases online. Consisting of data provided by the authors to benefit the reader, the posted materials are not copyedited and are the sole responsibility of the authors, so questions or comments should be addressed to the corresponding author.
Notes
Acknowledgments.
The Seattle Flu Study Investigators are:
Principal Investigators:
Helen Y Chu, MD, MPH,1,7 Michael Boeckh, MD, PhD,1,2,7 Janet A Englund, MD,1,3,7 Michael Famulare, PhD,4 Barry R Lutz, PhD,5,7 Deborah A Nickerson, PhD,6,7 Mark J Rieder, PhD,7 Lea M Starita, PhD,6,7 Matthew Thompson, MD, MPH, DPhil,9 Jay Shendure, MD, PhD,6,7,8 and Trevor Bedford, PhD.2,6,7
Co-Investigators:
Amanda Adler, MS,3 Elisabeth Brandstetter, MPH,1 Jeris Bosua, BA,10 Shari Cho, MS,7 Chris D Frazar, MS,1 Peter D Han, MS,7 Reena K Gulati, MD, MPH,11 James Hadfield, PhD,1 Shichu Huang, PhD,5 Michael L Jackson, PhD, MPH,12 Anahita Kiavand, MS,1 Louise E Kimball, PhD,2 Kirsten Lacombe, RN, MSN,3 Jennifer K Logue, BS,1 Victoria Lyon, MPH,1 Kira L Newman, MD, PhD,1 Thomas R Sibley, BA,2 Monica L Zigman Suchsland, MPH,1 Melissa Truong, BS,7 and Caitlin R Wolf, BS.1
Affiliations:
1Department of Medicine, University of Washington, Seattle, Washington, USA
2Vaccine and Infectious Disease Division, Fred Hutchinson Cancer Research Center, Seattle, Washington, USA
3Seattle Children’s Research Institute, Seattle, Washington, USA
4Institute for Disease Modeling, Seattle, Washington, USA
5Department of Bioengineering, University of Washington, Seattle, Washington, USA
6Department of Genome Sciences, University of Washington, Seattle, Washington, USA
7Brotman Baty Institute, Seattle, Washington, USA
8Howard Hughes Medical Institute, Chevy Chase, Maryland, USA
9Department of Family Medicine, University of Washington, Seattle, Washington, USA
10Blaze Clinical, University of Washington, Seattle, Washington, USA
11Centers for Disease Control and Prevention, Atlanta, Georgia, USA
12Kaiser Permanente Washington Health Research Institute, Seattle, Washington, USA
Funding. This project was supported by Gates Ventures through a gift to the University of Washington; and by the Centers for Disease Control and Prevention (grant number U01IP001037).
Potential conflicts of interest. H. C. reports consulting fees from Pfizer, Merck, and GlaxoSmithKline; grants from Ellume and Sanofi Pastuer; and nonfinancial support from Cephid, outside the submitted work. M. L. J. reports grants from Sanofi Pasteur, outside the submitted work. All other authors report no potential conflicts. All authors have submitted the ICMJE Form for Disclosure of Potential Conflicts of Interest. Conflicts that the editors consider relevant to the content of the manuscript have been disclosed.

