


Abstract
For pediatric pneumonia, the meteorological and air pollution indicators have been frequently investigated for their association with viral circulation but not for their impact on disease severity.
We performed a 10-year prospective, observational study in 1 hospital in Chongqing, China, to recruit children with pneumonia. Eight commonly seen respiratory viruses were tested. Autoregressive distributed lag (ADL) and random forest (RF) models were used to fit monthly detection rates of each virus at the population level and to predict the possibility of severe pneumonia at the individual level, respectively.
Between 2009 and 2018, 6611 pediatric pneumonia patients were included, and 4846 (73.3%) tested positive for at least 1 respiratory virus. The patient median age was 9 months (interquartile range, 4‒20). ADL models demonstrated a decent fitting of detection rates of R2 > 0.7 for respiratory syncytial virus, human rhinovirus, parainfluenza virus, and human metapneumovirus. Based on the RF models, the area under the curve for host-related factors alone was 0.88 (95% confidence interval [CI], .87‒.89) and 0.86 (95% CI, .85‒.88) for meteorological and air pollution indicators alone and 0.62 (95% CI, .60‒.63) for viral infections alone. The final model indicated that 9 weather and air pollution indicators were important determinants of severe pneumonia, with a relative contribution of 62.53%, which is significantly higher than respiratory viral infections (7.36%).
Meteorological and air pollution predictors contributed more to severe pneumonia in children than did respiratory viruses. These meteorological data could help predict times when children would be at increased risk for severe pneumonia and when interventions, such as reducing outdoor activities, may be warranted.
Pneumonia is the leading cause of child mortality from infectious diseases, with more than 120 000 million episodes occurring worldwide every year [1]. According to the Global Health Observatory, pediatric pneumonia accounts for 1 million deaths annually, especially in developing countries [2]. Accumulating evidence indicates that a portion of pneumonia patients, particularly children, may progress to a severe or even fatal outcome [3–5]. Respiratory viruses, as common causative pathogens in pediatric pneumonia, were more frequently detected than bacterial pathogens [6].Their role in resulting adverse outcomes has been thoroughly investigated, yet with large disparity regarding their association, possibly due to inconsistent sample size, sampling approaches, or detection methods and so on [7, 8]. Among previous available studies, weather and air pollution have been found to have an association with viral prevalence and circulation pattern. It is known that air pollution leads to asthma and other complications in children, but pneumonia specifically has not been thoroughly studied [9, 10]. Here, by performing an integrated analysis on a large dataset from a 10-year prospective study of pediatric pneumonia, we present a long-lasting viral spectrum for pediatric pneumonia and explore the determinants of severe pneumonia from the perspectives of virology, the environment, and the human host in an integral way.
METHODS
Hospital Surveillance and Patient Recruitment
The study was performed at the Children’s Hospital, Chongqing Medical University (CHCMU) in Chongqing, China. Chongqing has a humid subtropical climate with low sunshine and high fog. As documented for the last 5 years, the city had an average annual temperature of 18oC and an average of 82 days with a bad air quality index (AQI), indicating mild to severe air pollution. CHCMU is a tertiary care center in urban Chongqing, with 2480 beds and an annual outpatient capacity of about 2.91 million people. The hospital is the largest children’s hospital in southwestern China, serving patients from a wide geographic range across central and western China [11]. During 2009‒2018, active surveillance for hospitalized patients (aged <16 years) with pneumonia was performed following a standard operating protocol that included guidelines for patient enrollment, specimen collection, laboratory testing, and data recording during the study period [12]. Pneumonia was defined by the presence of patchy alveolar opacities on chest radiograph, in addition to the clinical presence of cough, dyspnea, or tachypnea (in infants, >50–60 breaths/min; in older children, >40 breaths/min). Severe pneumonia was defined as pneumonia plus hypoxemia (maintained oxygen saturation <92% in air) or increasing respiratory and pulse rates with clinical evidence of respiratory distress and exhaustion with or without raised partial pressure of carbon dioxide [13, 14].
Specimen and Demographic Data Collection and Laboratory Procedures
Within 24 hours after hospital admission, nasopharyngeal swabs or aspirates were collected and tested within 24 hours of collection. If not tested, samples were stored at −80°C until testing. Total nucleic acid was directly extracted from respiratory specimens using commercial kits (ie, QIAamp Mini Elute Virus Spin kit, QIAamp Viral RNA Mini kit, or RNeasy Mini kit; QIAGEN, Valencia, CA) following the manufacturer’s protocols. The tests for influenza virus, respiratory syncytial virus (RSV), parainfluenza virus (PIV), human metapneumovirus (HMPV), human rhinovirus (HRV), and human coronavirus (HCoV, including OC43, 229E, NL63, and HKU-1) were performed using reverse transcriptase polymerase chain reaction (RT-PCR) or real-time RT-PCR. The tests for human adenovirus (HAdV) and human bocavirus (HBoV) were performed using PCR or real-time PCR as previously described [13] (Supplementary Table 1). The patient’s weight for age was recalculated using the z score (weight-for-age z score): z =., where x is the patient’s weight, μ is the mean value of the data, and σ is the standard deviation of the data) [15]. Written informed consent was obtained from the patient’s legal guardian. The ethical review committees of CHCMU reviewed and approved the study.
Weather and Air Pollution Data
To select meteorological and air pollution variables that were appropriate for model construction, we reviewed literature that reported any association between meteorology and pneumonia or activity of respiratory viruses, from which 15 variables that showed probable association were used for the analysis [16–22]. The mean daily data on meteorological variables were derived from 6 surface stations in Chongqing City. The data on 6 ambient air pollution variables available from 2013 to 2018 were collected from the China Air Quality Online Monitoring and Analysis Platform [23]. Twenty-four weekly and monthly meteorological and air pollution predictors calculated from daily variables were used in the analyses: air temperature (mean, minimum, maximum, mean and maximum of daily difference), relative humidity (mean), sunshine hours (sum), wind speed (mean and maximum), atmospheric pressure (mean, minimum, and maximum), precipitation (sum), surface temperature (mean, minimum, and maximum), Particulate Matter 2.5 (PM 2.5) (particles 2.5 µm or smaller, mean concentration), PM10 (particles 10 µm or smaller, mean concentration), mean sulfur dioxide (SO2), mean carbon monoxide (CO), mean nitrogen dioxide (NO2), mean ozone (O3), mean AQI level, and days under air pollution (AQI >100) calculated based on the air pollution level (Supplementary Tables 2 and 3).
Statistical Analyses
The 2-tailed Mann-Whitney U test was used to compare continuous variables between 2 groups, the Kruskal-Wallis test was used for multiple-group comparisons, and the Pearson χ2 test or Fisher exact test was used to compare categorical variables. Statistical analyses were performed using SPSS software, version 19.0 (Chicago, IL), with a 2-sided P value < .05 as statistically significant.
To reduce the bias from collinearity among these weather and air pollution variables, we performed a variable selection based on their pairwise correlations using the R package “caret” as follows: (i) calculate the correlation matrix of all variables, (ii) determine the 2 variables (variables A and B) with the largest absolute pairwise correlation coefficient, (iii) determine the average correlation coefficients between A/B and the other variables, (iv) include the variable A or B with a smaller average correlation coefficient in the analysis and exclude the other, (v) repeat steps 2‒4 until no absolute correlation is above the threshold (in our study, 0.75) [24]. From this process, weekly and monthly AQI, days under air pollution, PM10, O3, maximum wind speed, temperature, sunshine hours, atmospheric pressure, and surface temperature are eliminated in the analyses due to their collinearity with other variables (correlation ≥0.75), and 24 variables including 6 host-related variables, 9 weather and air pollution indicators, and 9 viral-related variables were used in the final analyses (Supplementary Tables 3 and 4). The 9 aforementioned monthly meteorological and air pollution predictors were also used in a time series model, autoregressive distributed lag model (ADL), to fit monthly detection rates of each detected virus at the population level and estimate the effects of these predictors on viral infections using EViews 10.0 (IHS Global Inc, Irvine, CA). Lag times (1‒2 months) for monthly weather and air pollution predictors were used in the ADL models to explore any lagged effects [25]. The monthly detection rate of each virus was used as the dependent variable, and monthly weather and air pollution predictors were used as the independent variables. Akaike’s information criterion was used to identify the lags of weather and air pollution predictors and to measure the goodness-of-fit of the ADL models (Supplementary Tables 5‒12). The predictive validity of the models was evaluated using the sum squared residuals. The first-order autoregressive model was applied to estimate the contribution from weather and air pollution predictors.
The machine learning with random forest (RF) algorithm was applied using Python v3.5 (Python Software Foundation, Delaware) to identify the determinants of severe pneumonia and for the prediction on individual patients based on virus(es) identified, weekly weather and air pollution indicators at 1 week before each patient’s onset date, and host-related data. Machine learning approaches have superior ability to process complex nonlinear relationships between predictors and yield more stable predictions and to reduce the probability of overfitting the model compared with traditional approaches, which has been previously displayed [26–28]. In this study, 4 RF models were established and compared by including only viral infections, viral infections plus host-related factors, weather and air pollution indicators plus host-related factors, and all 24 involved variables in the models. The top 10 combinations of coinfection were also included in the analysis (Supplementary Table 13). All of the best multivariate models were selected by comparing the R2 and area under the curve (AUC) of the models.
RESULTS
Overall Patient Characteristics
From June 2009 to December 2018, 6611 hospitalized pediatric patients with pneumonia who met the inclusion criteria were enrolled, with the annual number of patients ranging from 538 to 861 (Figure 1A). The median age of the patients was 9 months (interquartile range, 4‒20), and 59.6% were aged <1 year. A total of 4316 (65.3%) were male, 9.27% were born premature, 993 (15%) had severe pneumonia, and 3 died. The median hospitalization duration of patients with severe pneumonia was 9 days, significantly longer than for those with nonsevere pneumonia (Table 1).
Epidemiological Characteristics of Pediatric Patients With Pneumonia in Chongqing, China
| Characteristic | Total (N = 6611) | Nonsevere Pneumonia (n = 5618) | Severe Pneumonia (n = 993) | P Valuea |
|---|---|---|---|---|
| Demographic characteristics | ||||
| Age, median (IQR), months | 9 (4–20) | 9 (4–35) | 6 (2–12) | <.001b |
| Premature birth#, n (%) | 613 (9.3) | 488 (8.7) | 125 (12.6) | .001c |
| Male, n (%) | 4316 (65.3) | 3628 (64.6) | 688(67.3) | .002c |
| Weight, median (IQR), kg | 9 (6.5–11) | 9 (7–12) | 7.5 (5–10) | <.001b |
| Delay*, median (IQR), days | 10 (5–20) | 10 (5–20) | 7 (4–15) | <.001b |
| Antibiotic usage, n (%) | 4519 (68.4) | 3877 (69.0) | 642 (64.7) | .007c |
| Laboratory features on admission, n (%) | ||||
| Leukopenia | 378 (5.7) | 324 (4.9) | 54 (5.4) | .546b |
| Thrombopenia | 61 (0.9) | 53 (0.9) | 8 (0.8) | .845b |
| Virus detection, n (%) | ||||
| Respiratory syncytial virus | 2244 (33.9) | 1794 (31.9) | 450 (45.3) | <.001c |
| Human rhinovirus | 1452 (22.0) | 1225 (21.8) | 227 (22.9) | .241c |
| Parainfluenza virus | 1228 (18.6) | 1077 (19.2) | 151 (15.3) | .001c |
| Influenza virus | 689 (10.4) | 596 (10.6) | 93 (9.4) | .13c |
| Human bocavirus | 658 (10.0) | 553 (9.8) | 105 (10.6) | .255c |
| Human adenovirus | 319 (4.8) | 240 (4.3) | 79 (8.0) | <.001c |
| Human metapneumovirus | 168 (2.5) | 141 (2.5) | 27 (2.7) | .382c |
| Human coronavirus | 130 (2.0) | 110 (2.0) | 20 (2.0) | .49 c |
| Viral coinfection | 1642 (24.8) | 1372 (24.4) | 270 (27.2) | .035c |
| Disease outcome | ||||
| Hospitalized days, median (IQR) | 6 (5–8) | 6 (5–7) | 8 (7–10) | <.001b |
| Death, n (%) | 3 (0.05) | 0 (0.0) | 3 (0.3) | .725c |
| Weather, median (IQR) | ||||
| Mean wind speed, m/s | 1.45 (1.25–1.65) | 1.45 (1.25–1.66) | 1.43 (1.22–1.64) | .516b |
| Mean temperature, ℃ | 16.81 (9.71–23.49) | 17.24 (10.09–23.80) | 13.90 (8.64–21.96) | .002b |
| Sunshine, hours | 2.29 (1.07–4.31) | 2.35 (1.12–4.43) | 2.08 (0.90–3.98) | <.00 b |
| Mean humidity, % | 0.78 (0.72–0.82) | 0.78 (0.72–0.82) | 0.78 (0.73–0.82) | .772b |
| Mean pressure, kPa | 96.99 (96.26–97.51) | 96.95 (96.24–97.49) | 97.14 (96.41–97.62) | .029b |
| Precipitation, mm | 49.71 (9.70–238) | 50.29 (10.44–222.50) | 44.57 (4.57–523.71) | .0001b |
| Mean surface temperature, ℃ | 18.27 (10.4–25.96) | 18.65 (10.66–26.18) | 15.12 (9.17–24.06) | <.001b |
| Air pollution, median (IQR)d | N = 3437 | n = 2918 | n = 519 | |
| Particles 2.5 μm or smaller, μg/m3 | 44.14 (33.64–65.71) | 43.85 (33.29–64.71) | 48.50 (35.17–76.00) | <.00 b |
| Particles 10 μm or smaller, μg/m3 | 71.14 (56.43–97.79) | 70.43 (55.86–96.43) | 76.57 (59.00–107.86) | <.00 b |
| Mean sulfur dioxide, mg/m3 | 12.71 (10.00–17.29) | 12.43 (9.71–17.00) | 13.71 (10.93–19.39) | <.001b |
| Mean carbon monoxide, mg/m3 | 1.01 (0.90–1.16) | 1.00 (0.90–1.16) | 1.04 (0.91–1.23) | <.00 b |
| Mean nitrogen dioxide, mg/m3 | 42.86 (36.43–49.71) | 42.71 (36.43–49.43) | 43.50 (36.32–51.86) | <.001b |
| Mean ozone, mg/m3 | 58.57 (27.21–95.00) | 61.14 (28.00–97.57) | 45.71 (23.14–86.00) | <.001b |
| Weather pollution according to air quality index, n (%) | .002 | |||
| Excellent | 191 | 178 (6.1) | 13 (2.5) | |
| Good | 2444 | 2079 (71.2) | 365 (70.3) | |
| Mild pollution | 782 | 643 (22.0) | 139 (26.8) | |
| Moderate pollution | 20 | 18 (0.6) | 2 (0.4) | |
| Heavy pollution | 0 | 0 (0) | 0 (0) | |
| Number of days with air pollution 1 week before the onset of the disease, n (%) | 1 (0, 3) | 1 (0, 3) | 1 (0, 3) | .826b |
#Premature birth: delivery between 28 and 37 weeks of pregnancy. *Delay: interval from disease onset to hospital admission (day).
Abbreviation: IQR, interquartile range.
a P value was compared between nonsevere pneumonia group and severe pneumonia group.
bBy Mann-Whitney U test.
cBy χ2 test or Fisher exact test.
dSince the observed range of air pollution data is from 2013 to 2018, the number of pneumonia patients during this period is 3437.
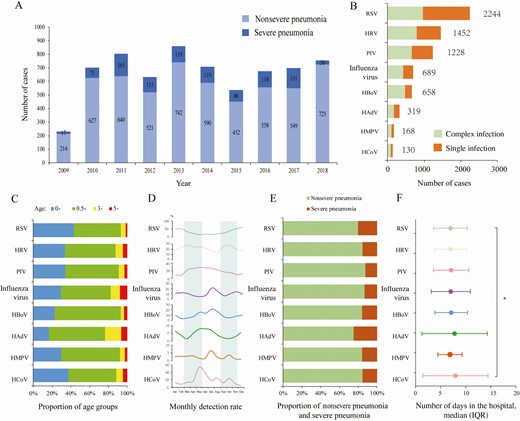
Etiological and epidemiological characteristics of pediatric patients with pneumonia. A, Annual number of pneumonia patients. B, The number of patients infected with various pathogens. Complex infection: infections with more than 1 virus. Single infection: only listed viral infections. C, Age distribution of patients with positive detection for each virus. D, Seasonal distribution of each virus. The shadow part separates the four seasons. E, Proportion of severe pneumonia in patients with positive detection for each virus. F, Days in the hospital for each viral infection. Complex infections were also included in panels C–F. Abbreviations: HAdV, human adenovirus; HBoV, human bocavirus; HCoV, human coronavirus; HMPV, human metapneumovirus; HRV, human rhinovirus; IQR, interquartile range; PIV, parainfluenza virus; RSV, respiratory syncytial virus.
Viral Detection and Seasonal Pattern
At least 1 virus was detected in 73.3% (4846/6611) of patients, comprising viral monodetection in 48.0% (3204/6611) and viral codetection in 24.8% (1642/6611). RSV had the highest detection rate (33.9%, 2244/6611) when accounting for both monoinfection and coinfection, followed by HRV, PIV, influenza virus, and HBoV with a detection rate ≥10%. HAdV, HMPV, and HCoV had detection rates <10% (Figure 1B). For each virus type, the majority of patients with positive detection were aged <3 years, ranging from 92.96% for RSV to 76.49% for HAdV (Figure 1C).
Viral infections displayed large disparity in terms of seasonal activity, in that RSV and HRV predominantly circulated from October to February, while PIV and HCoV peaked in May. In contrast, influenza virus, HBoV, and HAdV had dual peaks in July–August and December–January. HMPV infection occurred throughout the whole year (Figure 1D).
Based on the ADL models, the monthly detection rate of 4 viruses (PIV, HMPV, HRV, and RSV) could be adequately fitted by using the meteorological and air pollution data in combination with the detection rate from the patients admitted 1 or 2 months before the current surveillance month. The R2 of the fitting curve was 0.80, 0.80, 0.77, and 0.75 for PIV, HMPV, HRV, and RSV, respectively (Figure 2). Based on the model, the higher detection of PIV was significantly associated with high PM2.5 concentration (odds ratio [OR], 1.018; 95% confidence interval [CI], 1.001‒1.036) and lower wind speed (OR, 0.837; 95% CI, .711‒.985); this is consistent with the seasonal pattern of PIV, which shows high activity during spring and summer. The higher HMPV detection rate was associated with larger temperature differences (calculated as the difference between the highest temperature and the lowest temperature of each day; OR, 1.015; 95% CI, 1.005‒1.026), lower surface temperatures (OR, 0.990; 95% CI, .984‒.997), more precipitation (OR, 1.005; 95% CI, 1.001‒1.008), and worse air pollution, including PM2.5 (OR, 1.009; 95% CI, 1.004‒1.014) and SO2 (OR, 1.014; 95% CI, 1.000‒1.029). This wide scope of advantageous environment was also consistent with the less obvious seasonal pattern of HMPV across the years. Higher HRV detection was associated with severe air pollution, including SO2 (OR, 1.114; 95% CI, 1.059‒1.174) and CO (OR, 1.605; 95% CI, 1.237‒2.081), and increased wind speed (OR, 1.454; 95% CI, 1.138‒1.859). In a similar way, increased RSV detection was related to low temperature (OR, 0.966; 95% CI, .947‒.984) and higher wind speed (OR, 1.456; 95% CI, 1.060‒2.003), consistent with their high activity observed during winter and early spring (Supplementary Table 14). For the other 4 viruses, HCoV, influenza virus, HBoV, and HAdV, only a moderate prediction capacity of monthly detection rate was obtained by applying the ADL models, with R2 ranging from 0.53 to 0.64.
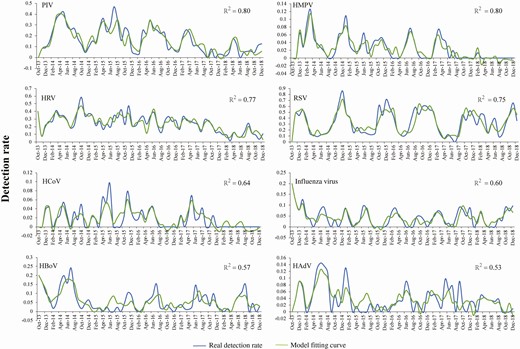
Actual and fitted curves of monthly detection rates of 8 viral pathogens in pediatric pneumonia patients by performing autoregressive distributed lag models. Abbreviations: HAdV, human adenovirus; HBoV, human bocavirus; HCoV, human coronavirus; HMPV, human metapneumovirus; HRV, human rhinovirus; IQR, interquartile range; PIV, parainfluenza virus; RSV, respiratory syncytial virus.
Factors that Influence Severe Pneumonia Development
Based on a full consideration of 24 variables (6 host-related factors, 9 weather and air pollution indicators, 8 viral detection results and 1 viral coinfection listed in Table 2), the severe pneumonia-associated factors were explored. For the 3 host-related factors (younger age, male sex, and premature birth), higher detection rates of RSV and HAdV were significantly associated with a higher incidence of severe pneumonia (Figure 1E). In addition, HCoV and HAdV infections were associated with longer hospital stay (P = .006; Figure 1F).
Contributions of Variables in the Random Forest Model for Predicting Severe Pneumonia by Using All Variables
| Variable | Contribution (%) | 95% Confidence Interval |
|---|---|---|
| Demographic factor | 30.10 | 27.45–32.87 |
| Age | 10.58 | 9.69–11.38 |
| Sex | 1.38 | 1.26–1.52 |
| Weight for age z score | 7.59 | 7.07–8.40 |
| Delay from disease onset to hospital admission | 8.36 | 7.46–9.10 |
| Antibiotic drug usage | 1.37 | 1.24–1.56 |
| Premature birtha | 0.82 | .73–.91 |
| Weather and air pollution | 62.53 | 58.83–66.81 |
| Sulfur dioxide concentration | 9.70 | 8.95–10.4 |
| Carbon monoxide concentration | 6.56 | 6.22–6.93 |
| Nitrogen dioxide concentration | 6.21 | 5.98–6.50 |
| Concentration of particles 2.5 μm or smaller | 6.47 | 6.15–6.87 |
| Mean wind speed | 6.45 | 6.14–6.92 |
| Temperature difference | 7.11 | 6.70–7.69 |
| Humidity | 6.13 | 5.78–6.53 |
| Precipitation | 6.55 | 5.97–7.13 |
| Minimum surface temperature | 7.35 | 6.94–7.84 |
| Viral infection | 7.36 | 6.00–9.01 |
| Respiratory syncytial virus | 2.01 | 1.50–2.54 |
| Human rhinovirus | 1.04 | .95–1.15 |
| Parainfluenza virus | 0.99 | .87–1.12 |
| Influenza virus | 0.55 | .37–.79 |
| Human bocavirus | 0.63 | .54–.76 |
| Human adenovirus | 0.48 | .41–.56 |
| Human metapneumovirus | 0.47 | .35–.66 |
| Human coronavirus | 0.25 | .18–.35 |
| Viral coinfection | 0.94 | .83–1.08 |
aPremature birth, delivery between 28 and 37 weeks of pregnancy.
Overall viral coinfection was significantly associated with more severe pneumonia (P = .035; Table 1), with RSV–HRV, HAdV–PIV, and HAdV–HBoV coinfection each contributing to the development of severe pneumonia with varying effect (P < .001; Supplementary Table 15). Eleven of 15 weather and air pollution indicators that were evaluated 1 week before disease onset significantly differed between severe and nonsevere pneumonia (Table 1).
Prediction Model of Severe Pneumonia Development
The models that included only viral infections, weather and air pollution indicators, or host-related factors achieved the lowest prediction capacity for severe pneumonia, with the AUC value on testing data reaching 0.62 (95% CI, .60‒.63), 0.86 (95% CI, .85‒.88), and 0.88 (95% CI, .87‒.89), which increased to 0.89 (95% CI, .88‒.90) for the model that included viral infections plus host factors and to a higher AUC value (0.91; 95% CI, .89‒.92) for the model that included host factors plus meteorological and air pollution indicators, respectively. The final model that considered all 24 factors attained the highest prediction efficiency with AUC value, reaching 0.94 (95% CI, .94‒.95; Figure 3A). The weather and air pollution indicators that were evaluated 1 week before disease onset had the highest contributions of 62.53% to severity of pneumonia, which was derived from high SO2 concentration, lower surface temperature, wider temperature difference, high CO concentration, more precipitation, high PM2.5 concentration, higher wind speed, high NO2 concentration, and higher relative humidity, with their relative contributions estimated to range from 9.70% to 6.13% in descending order. The host-related factors contributed 30.10% to the model, which were mainly from age <15 months (mean contribution, 10.58%), shorter duration from disease onset to admission (mean contribution, 8.36%), and weight-for-age z score (mean contribution, 7.59%). The contribution from the host-related factors, weather, and air pollution greatly exceeded the contribution from respiratory viral infections (7.36%). Although infection with RSV, HRV, and PIV was included in the final model, this only contributed minor effects to the development of severe pneumonia (2.01% and 0.99%, respectively; Table 2, Figure 3B, and Supplementary Figure 1).
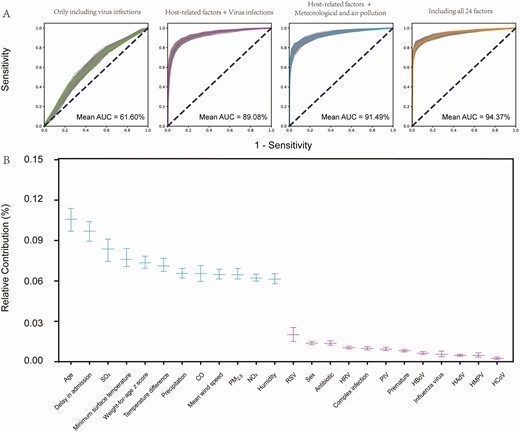
The efficiency estimation of variables in random forest models. A, AUC for each model that included only virus infections, host-related factors plus virus infections, host-related factors plus meteorological and air pollution factors, and all 24 factors. B, The efficiency estimation of variables in the model with all 24 factors included for analysis. Each midline represents the mean value; the upper and lower segments represent the 95% confidence interval. Abbreviations: AUC, area under the curve; CO, carbon monoxide; HAdV, human adenovirus; HBoV, human bocavirus; HCoV, human coronavirus; HMPV, human metapneumovirus; HRV, human rhinovirus; IQR, interquartile range; NO2, nitrogen dioxide; PIV, parainfluenza virus; PM2.5, particles 2.5 μm or smaller; RSV, respiratory syncytial virus; SO2, sulfur dioxide.
DISCUSSION
By using an integrated database that constituted 10-year active surveillance of the viral pathogens in pediatric pneumonia, we found that meteorological factors, especially air pollution, affect viral activity, but that the significant contributors differed, which also corresponded with the seasonal pattern of the viruses. In our study, the top 2 viruses with high detection rates were RSV and HRV, which is consistent with a survey from Madrid [29]. The monthly detection rate of 4 commonly seen respiratory viruses, PIV, HMPV, HRV, and RSV, can be adequately predicted by weather indicators (particularly temperature, precipitation, and wind speed) and predictors of air pollution (particularly PM2.5, SO2, and CO concentration) before 1‒2 months. The lag time of predictive meteorological factors differed for various viruses, which reflects their differential sensitivity to the predictors and is also consistent with previous findings [30–32]. In contrast, our model did not have a good fitting effect for influenza. This might be due to the double peaks of influenza, which is common in subtropical areas, making it difficult to formulate model-based prediction. Moreover, among all the detected viruses, influenza is the only one with a known vaccine, posing additional difficulty in predicting its circulation. Another novel finding is that development of severe pneumonia could be predicted with an RF algorithm based on low temperature, more precipitation, wide temperature difference, high wind speed, high relative humidity, and serious pollution conditions (PM2.5, SO2, CO, and NO2) in combination with poor host physical condition. To our knowledge, ours is the first study to provide evidence that supports weather and air pollution as factors that play a role in determining the outcome of pediatric pneumonia. Numerous studies have explored the contribution of etiological agents to the development of infection, but with large heterogeneity and inconsistency. In a general way, RSV was considered a major worldwide cause of morbidity and mortality in children aged <5 years [33]. In our study, although severe pneumonia was associated with RSV detection and other viral codetections, its occurrence cannot be predicted based only on the detection of the viral pathogens. However, when the viral causes were used in combination with host-related factors, a much better prediction of severe pneumonia was attained using the established models.
Meteorological and air pollution factors are likely to modulate the incidence and severity of pneumonia from a direct influence on respiratory virus survival to indirect effects on human susceptibility, with the latter having a greater effect on disease outcome. The direct influence has been extensively investigated in previous studies. According to Murdoch and Jennings, there was a significant correlation between the rate of invasive pneumococcal disease and decreasing daily temperature, sunshine hours, and wind speed and increasing air pollution levels and humidity [34]. In another study, ambient air pollution was demonstrated to increase the risk of respiratory tract infection [35]. A significant relation between ambient environmental factors, including average temperature, air pollutants with respiratory admissions [36, 37], and deaths [38–40], has been revealed from a wide range of geographic areas, including in China [41]. Research in Italy showed that the RSV epidemic trend was related to the mean minimum temperature and the mean PM10 concentration [42, 43]. In the current study, by performing a prospective study on a large sample size, we found that the ambient air pollution (especially PM2.5, SO2, CO, and NO2) was related not only to the viral circulation level but also to severe pneumonia, with a contribution of 62.53% to the model determining the disease outcome among pediatric pneumonia. The current research had the advantage of applying machine learning methods to explore the effect of each variable independently, further improving the validity of the established models.
The indirect effect on host susceptibility was suggested to be imposed by multifactorial regulatory effects on the respiratory system from ambient air pollution or relative “wintertime immune suppression” [44]. For example, the exposure to air pollution PM may increase the risk of Mycobacterium tuberculosis infection and the development of tuberculosis. The underlying mechanism was demonstrated to be the induction of senescence and downregulation of the antimicrobial peptides human β-defensin-2 and human β-defensin-3 expression in respiratory PM-exposed epithelial cells, which can lead to enhanced M. tuberculosis growth [45]. The altered physiological reactions of the host to certain climatic conditions; the possibility of bronchoconstriction, airway congestion, and secretion; and decreased innate immune mechanisms such as mucociliary clearance all acted during this process [46]. All of these factors functioned in a complex way to affect clinical diseases, not just pneumonia. A survey in the United States showed that the all-cause mortality rate was closely related to temperature and increased by 0.49% for every 1oC reduction [47].
Based on the current findings and previous evidence, we propose a causal relationship between the severity of pneumonia and weather and air pollution factors from the following points: the known biological sensitivity of the viruses to weather and air pollution factors, previous evidence that supports meteorology and host immune response, and evidence of a respiratory viral pattern in association with meteorological indicators. Moreover, based on a large sample size and modeling, we were able to separate the climatic effects from those that originated from the host, virology, or natural environments, suggesting that weather might act directly on the clinical phenotype and can be a potential substitute for the respiratory agents in determining disease outcome.
Our study had several limitations. The patients were not systematically tested for bacterial infection, and some of the host factors, such as the underlying conditions, were lacking, thus the results might be biased in reflecting all respiratory infections. The study was performed in a single medical center, and findings warrant further replication by independent studies. The death rate is low, partially due to the underreporting of fatal cases. Because of Chinese local culture and economic conditions, patients who are dying are often discharged and return home, hence, those who subsequently died were not counted in the number of deaths in the hospital but were, instead, reported as quitting treatment and discharged home. The detailed mechanism that underlies the association between climate factors and severe pneumonia incidence might vary for different respiratory pathogens, and this needs to be further quantified.
The clinical implications of our findings, if true, are of great importance in that personal preventive behaviors, such as staying inside or purify the indoor air, would be most effective on days with unfavorable climate, thus offering better preventive interventions for severe pneumonia. The use of weather and air pollution factors in determining clinical outcome needs further investigation through prospective studies, especially among adult patients and in other geographic regions with different climates.
Supplementary Data
Supplementary materials are available at Clinical Infectious Diseases online. Consisting of data provided by the authors to benefit the reader, the posted materials are not copyedited and are the sole responsibility of the authors, so questions or comments should be addressed to the corresponding author.
Notes
Author contributions. W. L., L. Q. F., and E. M. L. conceived, designed, and supervised the study. L. R., X. A. Z., and Q. B. L. conducted the field work and viral testing. Z. B. W., Q. B. L., L. R., X. A. Z., L. H., D. M., K. D., H. Y. Y., Z. X. L., and L. Q. F. collected, cleaned, and analyzed the data. Z. B. W., Q. B. L., L. R., H. L., L. Q. F., P. H. Z., E. M. L., and W. L. wrote, commented on, and revised the drafts of the manuscript. All authors read and approved the final manuscript.
Acknowledgments. The authors thank all of the patients, their families, and collaborating clinicians for their participation.
Disclaimer. The funders had no role in study design, data collection and analysis, decision to publish, or preparation of the manuscript.
Financial support. This work was supported by China Mega-Project for Infectious Diseases grants (2018ZX10713002, 2018ZX10101003, and 2017ZX10103004), the Natural Science Foundation of China (81825019), and Fundamental Research Funds for the Central Universities & Peking University Medicine Seed Fund for Interdisciplinary Research (BMU2018MX009).
Potential conflicts of interest. The authors: No reported conflicts of interest. All authors have submitted the ICMJE Form for Disclosure of Potential Conflicts of Interest.
References
World Health
World Health
Author notes
Z. B. W., L. R., and Q. B. L. contributed equally to this work.

