


Abstract
Novel coronavirus disease 2019 (COVID-19) is frequently compared with influenza. The Hospitalized Adult Influenza Vaccine Effectiveness Network (HAIVEN) conducts studies on the etiology and characteristics of U.S. hospitalized adults with influenza. It began enrolling patients with COVID-19 hospitalizations in March 2020. Patients with influenza were compared with those with COVID-19 in the first months of the U.S. epidemic.
Adults aged ≥ 18 years admitted to hospitals in 4 sites with acute respiratory illness were tested by real-time reverse transcription polymerase chain reaction for influenza and severe acute respiratory syndrome coronavirus 2 (SARS-CoV-2), the virus causing COVID-19. Demographic and illness characteristics were collected for influenza illnesses during 3 seasons 2016–2019. Similar data were collected on COVID-19 cases admitted before June 19, 2020.
Age groups hospitalized with COVID-19 (n = 914) were similar to those admitted with influenza (n = 1937); 80% of patients with influenza and 75% of patients with COVID-19 were aged ≥50 years. Deaths from COVID-19 that occurred in younger patients were less often related to underlying conditions. White non-Hispanic persons were overrepresented in influenza (64%) compared with COVID-19 hospitalizations (37%). Greater severity and complications occurred with COVID-19 including more ICU admissions (AOR = 15.3 [95% CI: 11.6, 20.3]), ventilator use (AOR = 15.6 [95% CI: 10.7, 22.8]), 7 additional days of hospital stay in those discharged alive, and death during hospitalization (AOR = 19.8 [95% CI: 12.0, 32.7]).
While COVID-19 can cause a respiratory illness like influenza, it is associated with significantly greater severity of illness, longer hospital stays, and higher in-hospital deaths.
As severe acute respiratory syndrome coronavirus 2 (SARS CoV-2) emerged [1–4], many described coronavirus disease 2019 (COVID-19) as an influenza-like illness [5, 6]. In part, this approach reflected an attempt to provide context to the novel disease, by comparing the novel disease with the well-known characteristics of seasonal influenza. However, this comparison can create confusion since, while it is evident that influenza causes significant mortality and morbidity on a regular basis, the general public often perceive influenza as a trivial condition, akin to the common cold [7]. To mitigate this confusion, it is important to examine the clinical characteristics of severe influenza that causes hospitalization and compare these illnesses with characteristics of hospitalizations caused by SARS-CoV-2. Additionally, these data can help with clinical management and planning for potential co-circulation of both viruses in the approaching winter season.
The Hospitalized Adult Influenza Vaccine Effectiveness Network (HAIVEN) began in the fall of 2015 to evaluate yearly influenza vaccine effectiveness at preventing hospitalization, taking into account the demographic and clinical characteristics of those hospitalized [8, 9]. Results from 2015–2020 have identified variation in protection, with the vaccine least likely to protect against A(H3N2) viruses, which are associated with higher rates of hospitalizations and mortality in older adults when compared with A(H1N1) and B lineage viruses [10–12]. This variation in vaccine protection was particularly evident in 2017–2018, an influenza season when vaccine effectiveness was low and hospitalization rates approximated those experienced during the 2009 pandemic [13]. The 2019–2020 season was characterized by an initial wave of influenza B/Victoria circulation, followed by a second wave of influenza A(H1N1) with very few cases of influenza A(H3N2) [14], and data collection continued for HAIVEN through the emergence of SARS-CoV-2.
The geographic distribution of HAIVEN sites in 4 states (Texas, Tennessee, Pennsylvania, and Michigan) allowed for identifying locations with early surges in COVID-19 case numbers and locations with lower activity. We report the characteristics of these initial cases of COVID-19 compared with the characteristics of influenza cases identified during 2016–2019, 3 influenza seasons with predominate circulation of A(H3N2), the subtype with typically lower vaccine effectiveness, and typically causing more hospitalizations than other subtypes.
METHODS
HAIVEN consists of 4 sites located in Texas (2 hospitals), Tennessee (3 hospitals), Pennsylvania (2 to 5 hospitals; The University of Pittsburgh hospitals varied by season; 2 hospitals in 2016–2017, 3 hospitals in 2017–2018, and 5 hospitals in 2018–2019), and Michigan (2 hospitals). The HAIVEN methods have been described elsewhere [9]. Briefly, patients are selected for participation based on a standardized case definition including patients ≥18 years, with a qualifying acute respiratory syndrome (new or worsening cough or sputum production with onset within previous 10 days), onset of illness prior to hospitalization, and clinical and/or respiratory specimen collection for laboratory analysis within 10 days of illness onset and within 72 hours of hospital admission. Influenza hospitalizations included in this analysis are patients enrolled in the 2016–2017, 2017–2018, and 2018–2019 seasons.
Patients enrolled during influenza seasons completed an enrollment interview including demographics and health history. Throat and nasal or mid-turbinate nasopharyngeal swab specimens were collected and combined for laboratory confirmation of influenza by real-time reverse transcription polymerase chain reaction (RT-PCR) using standard Centers for Disease Control and Prevention (CDC) assays or multiplex PCR-based assays or other molecular-based influenza testing, such as respiratory viral panels [15]. The COVID-19 case definition was the same as the case definition for influenza except patients had confirmed RT-PCR testing for SARS-CoV-2 RNA from respiratory specimens. Data collection for COVID-19 followed similar ascertainment procedures and data guidelines as influenza surveillance, with adaptations to minimize in-person contact (Supplementary Table 1). Due to increased infection control practices, patients with COVID-19 were enrolled using 1 of 3 methods: direct patient enrollment with consent, enrollment by telephone or electronic device, or waiver of consent with chart reviews. Some patients with COVID-19 were placed into intensive care unit (ICU) rooms for isolation purposes but may not have needed ICU care early in the outbreak in the Texas hospitals. Data collection for this analysis included COVID-19 cases abstracted from the beginning of circulation at each site from hospital admission dates of March 2020 through June 19, 2020.
Statistical Analyses
Patient characteristics and clinical outcomes were compared for patients hospitalized with influenza with patients hospitalized with COVID-19. Multivariable logistic regression models were used to calculate adjusted odds ratios (AOR) and 95% confidence intervals (CI) to compare frequency of (ICU) admission, mechanical ventilation, and death for patients with influenza compared with patients with COVID-19, controlling for comorbid conditions (renal disease and cardiopulmonary disease; Cardiopulmonary disease includes chronic obstructive pulmonary disease (COPD)/emphysema, heart failure/congestive heart failure (CHF), and other chronic lung disease.), categorical age in years (18–49, 50–64, 65–74, and 75+ years), race/ethnicity (White non-Hispanic, Black non-Hispanic, other race non-Hispanic, and Hispanic any race), study site (Vanderbilt University, University of Michigan, University of Pittsburgh, and Baylor Scott & White), and gender. A multivariable linear regression model was used to evaluate differences in length of stay, including the same covariates. Length of hospital stay analyses were restricted to those who survived until discharge. A sensitivity analysis was performed to compare patients hospitalized with COVID-19 to patients with influenza A(H1N1), A(H3N2), and influenza B, which accounted for most influenza hospitalizations during the study years. Adjusted outcome models were also evaluated by race and gender categories, and interaction terms were used to determine the significance of modification by these factors. Analyses were conducted using SAS version 9.4 (Cary, North Carolina, USA). The study was approved by institutional review boards at the CDC and at all participating sites.
RESULTS
COVID-19 Hospitalizations
A total of 914 patients hospitalized with COVID-19 meeting the study case definition were included in the study across 4 study sites and 10 hospitals, with admission dates from March 8, 2020 to June 19, 2020 (Figure 1). Hospitalized patients with COVID-19 were 54% (n = 490) male, 46% (n = 421) Black, non-Hispanic; 35% (n = 322) were 50–64 years of age and 82% (n = 753) had an underlying condition (Table 1). Cough was an enrollment criterion, and thus was consistent among the included patients. Other common symptoms were fever/feverish (77%; n = 700), shortness of breath (80%; n = 734), and fatigue (48%; n = 441) (Figure 2). The majority of patients in this analysis enrolled with COVID-19 were from the Michigan site (58%), reflecting the early COVID-19 surge occurring in this state compared with other sites in Texas, Tennessee, and Pennsylvania.
Characteristics of Patients Hospitalized With Influenza and COVID-19, HAIVEN, 2016–2020
| No. (%) | ||
|---|---|---|
| Characteristics | All Influenza subtypesa n = 1937 (68) | COVID-19 n = 914 (32) |
| Site Location | ||
| Texas | 469 (24) | 82 (9) |
| Michigan | 520 (27) | 527 (58) |
| Pennsylvania | 555 (29) | 152 (17) |
| Tennessee | 393 (20) | 153 (17) |
| Season | ||
| 2016–2017 | 486 (25) | --- |
| 2017–2018 | 928 (48) | --- |
| 2018–2019 | 523 (27) | --- |
| Femaleb | 1081 (56) | 423 (46) |
| Race/Ethnicityc | ||
| White, non-Hispanic | 1249 (64) | 335 (37) |
| Black, non-Hispanic | 540 (28) | 421 (46) |
| Other race, non-Hispanic | 56 (3) | 28 (3) |
| Hispanic, any race | 86 (4) | 78 (9) |
| Age group (years) d | ||
| 18–49 | 379 (20) | 232 (25) |
| 50–64 | 592 (31) | 322 (35) |
| 65–74 | 466 (24) | 191 (21) |
| 75+ | 500 (26) | 168 (18) |
| Influenza Vaccinatione | 1197 (62) | --- |
| Underlying Conditionsf | ||
| Any | 1829 (94) | 753 (82) |
| Asthma | 514 (27) | 136 (15) |
| Hypertension | --- | 598 (65) |
| COPD/emphysema | 694 (36) | 101 (11) |
| Other chronic lung disease | 744 (38) | 56 (6) |
| Diabetes mellitus | 713 (37) | 342 (37) |
| Heart failure/CHF | 571 (29) | 131 (14) |
| Renal disease | 807 (42) | 150 (16) |
| Liver disease | 233 (12) | 28 (3) |
| Immunosuppressive condition or therapy | 548 (28) | 101 (11) |
| Neurologic/neurodevelopmental disorder | 698 (36) | 120 (13) |
| Morbid obesity (≥40 kg/m2) | 294 (15) | 146 (16) |
HAIVEN, Hospital Adult Influenza Vaccine Effectiveness Network; COPD, Chronic Obstructive Pulmonary Disease; CHF, Congestive Heart Failure.
a Influenza subtypes include Influenza A(H1N1) (19%, n = 362), A(H3N2) (60%, n = 1160), and B (21%, n = 416).
b 1 COVID patient (0.1%) missing sex. Compared with patients hospitalized with influenza, patients hospitalized with COVID-19 were less likely to be females (AOR = 0.7, 95% CI: 0.6, 0.8; P < .01, controlling for site).
c 6 Influenza patients (0.3%) have unspecified race/ ethnicity; 52 COVID+ patients (6%) have unspecified race/ethnicity. Race/ethnicity other than White, non-Hispanic was more frequently reported in the patients with COVID-19 and was significant (AOR = 2.2, 95% CI: 1.9, 2.7; P < .01, controlling for site).
d 1 COVID-19 patient (0.1%) missing age. The proportion of patients in the youngest age group (18–49 years) were slightly higher for COVID-19 compared to influenza (AOR = 1.2, 95% CI: 1.0, 1.5; p = 0.04, controlling for site).
e80 Influenza patients (4%) were missing influenza vaccination status.
f For influenza, these data are derived from ICD10 codes associated with inpatient and outpatient medical encounters in the year prior to enrollment admission. For COVID-19, data were abstracted from medical records on these specific underlying conditions. Information on the following underlying conditions were missing from COVID-19 patients: 12 (1%) asthma, 5 (1%) hypertension, 12 (1%) COPD/ emphysema, 9 (1%) other chronic lung disease, 6 (1%) diabetes, 9 (1%) heart failure/CHF, 9 (1%) renal disease, 14 (2%) liver disease, 8 (1%) immunosuppressive condition or therapy, 10 (1%) neurologic/neurodevelopmental disorder, and 130 (14%) morbid obesity. Patients hospitalized with COVID-19 were less likely to have a pre-existing high-risk condition compared to with patients hospitalized with influenza (AOR = 0.3, 95% CI: 0.2, 0.3; P < .01, controlling for site) (Table 1).
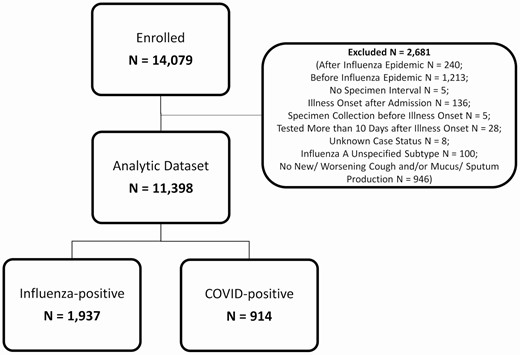
Patients hospitalized with influenzaa or COVID-19b, HAIVEN, 2016–2020. HAIVEN: Hospital Adult Influenza Vaccine Effectiveness Network. aThe case definition for influenza included patients ≥18 years, with a qualifying acute respiratory syndrome (new or worsening cough or sputum production with onset within previous 10 days), onset of illness prior to hospitalization, and clinical and/or respiratory specimen collection for laboratory analysis within 10 days of illness onset and within 72 hours of hospital admission. bThe case definition for COVID-19 included patients ≥18 years, confirmed RT-PCR testing for SARS-CoV-2 RNA from respiratory specimens, onset of illness prior to hospitalization, and reporting symptoms of cough or change in amount or appearance of sputum/phlegm/mucus.
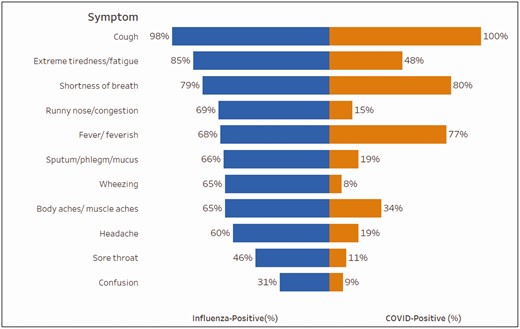
Symptoms of patients hospitalized with influenzaa (n = 1937) compared with patients hospitalized with COVID-19b (n = 914), HAIVEN, 2016–2020. HAIVEN: Hospital Adult Influenza Vaccine Effectiveness Network. a.Information on the following symptoms were missing from influenza patients: 1 (0.1%) extreme tiredness/ fatigue, 3 (0.2%) shortness of breath, 1 (0.1%) runny nose/ congestion, 2 (0.1%) fever/feverish, 2 (0.1%) sputum/phlegm/mucus, 1 (0.1%) wheezing, 4 (0.2%) body aches, 3 (0.2%) headache, 3 (0.2%) sore throat, and 1 (0.1%) confusion. bInformation on the following symptoms were missing from COVID-19 patients: 73 (8%) extreme tiredness/ fatigue, 7 (1%) shortness of breath, 94 (10%) runny nose/congestion, 8 (1%) fever/feverish, 88 (10%) sputum/phlegm/mucus, 114 (12%) wheezing, 61 (7%) body aches, 79 (9%) headache, 98 (11%) sore throat, and 93 (10%) confusion.
Influenza Hospitalizations
Over the 2016–2017, 2017–2018, and 2018–2019 seasons, 14 079 patients were enrolled and 11 398 patients met our inclusion criteria across all 4 study sites (3290 patients in 2016–2017; 4108 patients in 2017–2018; and 3975 patients in 2018–2019) (Figure 1). Among these patients, 1937 had laboratory-confirmed influenza A(H3N2), B, or A(H1N1); 60% (n = 1160) of influenza infections were A(H3N2), 21% (n = 416) were influenza B, and 19% (n = 362) were A(H1N1) (Supplementary Table 2). Hospitalized patients with influenza were 56% (n = 1081) female, 64% (n = 1249) White, non-Hispanic, 31% (n = 592) were 50–64 years of age, 62% (n = 1197) were vaccinated, and 94% (n = 1829) had an underlying condition (Table 1). Other than A(H1N1) patients being younger, on average, the characteristics of patients with the different types and subtypes were similar, and they have been combined in remaining analyses.
Comparisons between COVID-19 and Influenza
Overall, patients with COVID-19 were similar in age to those with influenza (COVID-19: mean 60 years, median 61 years vs influenza: mean 63 years, median 64 years). Compared with patients with influenza, the proportion of patients in the youngest age group (18–49 years) were slightly higher for COVID-19 compared to influenza (AOR = 1.2, 95% CI: 1.0, 1.5; P = 0.04, controlling for site), and race/ethnicity other than White, non-Hispanic was more frequently reported in patients with COVID-19 (AOR = 2.2, 95% CI: 1.9, 2.7; P < .01). Compared with patients hospitalized with influenza, patients hospitalized with COVID-19 were less likely to be females (AOR = 0.7, 95% CI: 0.6, 0.8; P < .01). Patients hospitalized with COVID-19 were less likely to have a pre-existing high-risk condition compared with patients hospitalized with influenza (AOR = 0.3, 95% CI: 0.2, 0.3; P < .01) (Table 1).
Comparative Clinical Epidemiology of COVID-19 and Influenza
Patients hospitalized with COVID-19 had substantially worse outcomes than patients hospitalized with influenza. Patients hospitalized with COVID-19 were more frequently admitted to the ICU (AOR = 15.3, 95% CI: 11.6, 20.3, P < .01) and placed on mechanical ventilation (AOR = 15.6, 95% CI: 10.7, 22.8, P < .01) (Table 2). Length of stay was longer in patients discharged alive (increase of 7.7 days, 95% CI: 6.9, 8.4, P < .01) (Figure 3). Unadjusted length of stay means and medians for those discharge alive were for COVID: 10.9 days and 7 days and for influenza: 4.3 days and 3 days, respectively. COVID-19 patients more frequently died during hospitalization (13.7%, 123/898) compared to influenza (1.4%, 27/1919) (AOR = 19.8, 95% CI: 12.0, 32.7, P < .01); the higher inpatient death rate was most prominent with increasing age (Figure 4). Findings were similar when restricting the comparison between COVID-19 and each influenza subtype (influenza A(H3N2), A(H1N1), and influenza B) (Supplementary Table 3).
Hospital-Related Outcomes for Patients with COVID-19 Compared to Patients With Influenza by Race/Ethnicity and Gender, HAIVEN, 2016–2020
| Adjusted Odds Ratios (95% CI)a | |||||
|---|---|---|---|---|---|
| Race-stratified | Gender-stratified | ||||
| Outcomes | Overall | Black, non-Hispanic | White, non-Hispanic | Male | Female |
| ICU admissionb | 15.3 (11.6, 20.3) | 13.6 (8.6, 21.6) | 15.8 (10.7, 23.5) | 16.1 (10.7, 24.0) | 15.4 (10.3, 23.1) |
| Mechanical ventilation | 15.6 (10.7, 22.8) | 28.0 (12.8, 61.3) | 12.7 (7.7, 21.1) | 17.3 (10.3, 29.2) | 14.9 (8.5, 26.0) |
| Death during hospitalization | 19.8 (12.0, 32.7) | 58.6 (13.3, 258.8) | 16.6 (9.1, 30.4) | 26.3 (11.8, 58.7) | 16.5 (8.3, 32.6) |
HAIVEN, Hospital Adult Influenza Vaccine Effectiveness Network; ICU, Intensive Care Unit.
a Overall model adjusted for age, sex, site, race/ethnicity, and comorbid conditions (renal disease and cardiopulmonary disease). Race-stratified model adjusted for all covariates included in the overall model, excluding race/ethnicity. Gender-stratified model adjusted for all covariates included in the overall model, excluding gender.
b Some enrollment hospitals in Texas had COVID-19 admission units in the ICU during mid-March to mid-April 2020.
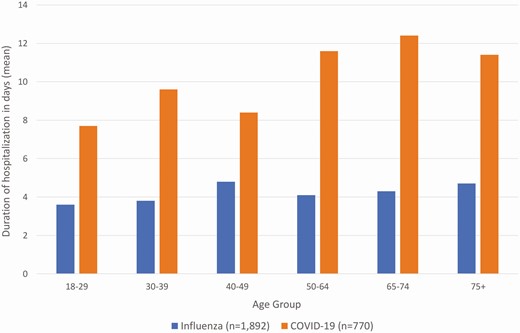
Duration of hospitalization for patients hospitalized with influenza compared with patients hospitalized with COVID-19 in days (mean) by agea, HAIVEN, 2016-2020. HAIVEN: Hospital Adult Influenza Vaccine Effectiveness Network. aThis analysis was restricted to patients discharged alive. Length of stay was longer for COVID-19 patients compared to influenza patients with an increase of 7.7 days (95% CI: 6.9, 8.4, P < .01).
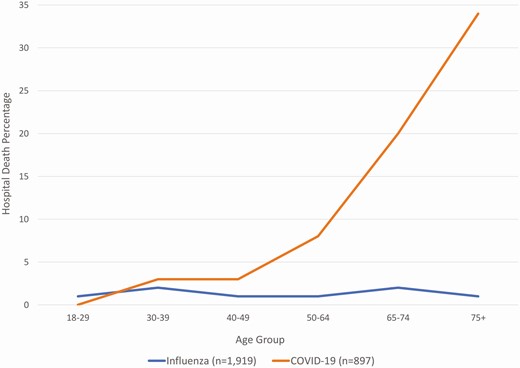
Percentage of inpatient hospital deaths in patients hospitalized with influenzaa compared with patients hospitalized with COVID-19b by age, HAIVEN, 2016-2020. HAIVEN: Hospital Adult Influenza Vaccine Effectiveness Network. a18 (0.9%) Influenza patients missing discharge status. b17 (1.9%) COVID-19 patients missing age or discharge status.
COVID-19 Versus Influenza and the Influence of Race/Ethnicity and Gender
Risk of mechanical ventilation among COVID-19 patients vs influenza patients was much higher for non-Hispanic, Black or African American patients (AOR = 28.0, 95% CI: 12.8, 61.3; P < .01) compared with non-Hispanic, White patients (AOR = 12.7, 95% CI: 7.7, 21.1; P < .01; P = 0.04 for interaction term) (Table 2). Similarly, the risk of in-hospital death was markedly higher for non-Hispanic, Black or African American patients compared with non-Hispanic, White patients (AOR = 58.6, 95% CI: 13.3, 258.8; P < .01 versus AOR = 16.6, 95% CI: 9.1, 30.4; P < .01; P = 0.08 for interaction term) (Table 2). When evaluated by gender, the association between COVID-19 and in-hospital death was higher for those identifying as male vs female (AOR = 26.3, 95% CI: 11.8, 58.7, P < .01 versus AOR = 16.5, 95% CI: 8.3, 32.6, P < .01; P = 0.02 for interaction term) (Table 2).
DISCUSSION
Our analyses found that hospitalized COVID-19 patients had fewer underlying conditions, increased need for ICU care and mechanical ventilation, and much higher rates of death than hospitalized influenza patients. Seasonal influenza infection does have severe manifestations; however, COVID-19 is more severe, and comparisons should be made cautiously.
Also, since the impact of influenza is known to differ depending on the type or subtype involved, it is necessary to include A(H3N2), the subtype with the greatest impact on increased outpatient visits and estimated mortality because it disproportionately affects older adults [13, 21]. Influenza A(H3N2) was not involved in the 2019–2020 U.S. outbreak, but it was the subtype which in 2017–18 caused the greatest impact in terms of outpatient visits and estimated mortality since the 2009 influenza pandemic [13]. It is also the subtype least affected by vaccination, making it more comparable with the current situation with COVID-19 [10, 11]. Even when compared with Influenza A(H3N2) hospitalizations, severity of COVID-19 and commensurate complexities of patient management, resource utilization, and economic impact were far worse, as shown by AOR for death of 19.8.
HAIVEN was established to annually evaluate the effectiveness of influenza vaccines in preventing hospitalizations among adults [9]. Standard methods have been used over the years to assess underlying conditions and disease characteristics. The 3 seasons in question, 2016–2019, were chosen to capture the major activity of A(H3N2), but type B and A(H1N1) were also present. While it is known that A(H3N2) is the subtype most likely to result in hospitalization, in this study little difference was found between the influenza types and subtypes in demographics and many disease characteristics in adults of all ages who were hospitalized. For example, influenza type B in the community is often associated with outbreaks that relatively spare older patients; however, this was not seen in this study population. Influenza hospitalized patients had a median age of 64 years and less than 20% were less than age 50 years, an age distribution almost identical to the situation with A(H3N2). This similarity across influenza subtypes is likely related to the similar frequency of underlying conditions and racial/ethnic distribution in this HAIVEN population during the 2016–2019 influenza seasons. All influenza cases were combined in comparisons with COVID-19 cases, but A(H3N2) admissions had higher AORs in comparison with COVID-19 for ICU admission, need for mechanical ventilation, and in-hospital death than A(H1N1) and B viruses.
Several differences between COVID-19 and influenza were observed in this population. These differences may be due to pre-existing influenza immunity, influenza vaccination, and the use of influenza antiviral treatment, in addition to other characteristics of SARS-CoV-2 infection. One of these differences was the higher frequency of death as an outcome of hospitalization in patients with COVID-19 [22–24]. For COVID-19 age is the driving characteristic for death, with underlying illnesses having less of an effect; however, even after adjusting for age, COVID-19 patients were more likely to have died during hospitalization than influenza patients [17]. This age distribution was not very different from that seen with all influenza hospitalizations, with 25% of patients hospitalized aged <50 years, and an additional 35% aged 50–65 years. Although most younger patients with COVID-19 survived, their hospitalization had a major impact on hospital capacity with lengths of stay much longer than what was seen among patients with influenza and increased admission to the ICU (Table 2, Figure 3). It is possible these younger patients had a protracted recovery, further confirming the impact of the disease on this younger age group [25]. A smaller cohort of patients with influenza and COVID-19 in China had slightly different patient characteristics than this study but did find similarly higher numbers of patients with COVID-19 with ICU admissions, mechanical ventilation rates, and prolonged hospitalizations [26]. Although adults with COVID-19 had higher rates compared with patients with influenza, children with COVID-19 or with influenza in the United States have had similar ICU admission rates and use of mechanical ventilation [27].
The recognized role of race/ethnicity in COVID-19 hospitalization and outcome severity was clearly demonstrated. In our study, non-Hispanic, Black or African American persons represented 28% of influenza hospitalizations but accounted for 46% of COVID-19 hospitalizations (Table 1). The role of race/ethnicity in COVID-19 severity has been identified in other studies [28–30]. Our study included only patients hospitalized before June 19, where the Michigan site contributed more than half the cases, and thus, only a small proportion (9%) were Hispanic or Latino persons, making it difficult to estimate severity outcomes in this population. Compared with non-Hispanic, White patients, non-Hispanic, Black or African American COVID-19 patients had a higher need for mechanical ventilation and higher rates of death during hospitalization compared to influenza patients. Undiagnosed and untreated comorbid conditions may contribute to these disparities. This highlights the need for including racially diverse subjects in COVID-19 epidemiology, pathogenesis, vaccine, and treatment trials.
This study is strengthened by the use of an established network with a common case definition across influenza and COVID-19. The network is limited by some differences in enrollment and data collection between the influenza and COVID-19 seasons due to infection control concerns for COVID-19. For expediency, chart reviews were performed for COVID-19 cases vs full data extraction of billing codes from electronic health records used for influenza cases. Also, due to the public health crisis, data collection was allowed with and without written consent. This increased the enrollment of residents of nursing homes and those close to death than previously enrolled during influenza seasons, likely increasing the mortality seen due to COVID-19. Mortality was likely under-estimated in this study because it only focused on in-hospital deaths and deaths attributed to COVID-19 and influenza can occur after discharge. However, unless postdischarge mortality was different for COVID-19 and influenza, the relative in-hospital rates should not be affected. Furthermore, a large percentage of the COVID-19 study population was from the Michigan sites (58%) due to the timing of the data included in this analysis. Thus, the COVID-19 population presented in this study may not be as representative of the COVID-19 population at these other sites. Additionally, our study did not capture the effects of COVID-19 medications, including any time-varying differences in outcomes that could be attributed to treatments. Remdesivir was approved May 1, 2020 and dexamethasone was approved June 16, 2020. It is possible the outcome differences between the 2 conditions could narrow with appropriate therapies.
This study found that hospitalized COVID-19 patients had greater severity and complications than hospitalized influenza patients in prior influenza seasons. Thus, caution should be used when dismissing the severity of COVID-19 as a “flu-like” illness, especially as we approach the winter season when it will be critical to differentiate between these diseases for clinical management, including the use of available influenza and SARS-CoV-2 antivirals.
Nonstandard Abbreviations: AOR, adjusted odds ratio; CDC, Centers for Disease Control and Prevention; CI, confidence intervals; COVID-19, coronavirus disease-2019; HAIVEN, Hospitalized Adult Influenza Vaccine Effectiveness Network; ICU, intensive care unit; RT-PCR, reverse transcription polymerase chain reaction; SARS-CoV-2, severe acute respiratory syndrome coronavirus 2.
Notes
HAIVEN Study Investigators
Emily Smith, Kelsey Bounds, Nicole Calhoun, Michael Smith, Andrew Hawrylak, Michael Ladogana, Joseph Fernandez, Marc Elieson, James Morrison, John Midturi, Tresa McNeal, Alejandro Arroliga, Mary Patricia Nowalk, GK Balasubramani, Heather Eng, Klancie Dauer, Dayna Wyatt, Yuwei Zhu, Zhouwen Liu, Stephanie Longmire, Kellie Graves, Emily Sedillo, Alina Simion, Karen Speer, Bethany Alicie, Briana Krantz, Donna Carillo, Laura Adams, Amelia Drennan, Jan Orga, Lynn Peterson, Natasha Halasa, Rendi McHenry, Claudia Guevara Pulido, Lois E. Lamerato, Anurag Malani, Adam Lauring, Ryan E. Malosh
Acknowledgments.
We acknowledge the contributions from Sean G. Saul, Kailey Hughes, and Alicia Bagiatis at the University of Pittsburgh, Pennsylvania; EJ McSpadden, Hannah Segaloff, Caroline Cheng, Rachel Truscon, Emileigh Johnson, Armanda Kimberly, Anne Kaniclides, Emily Nichols, Elizabeth Alleman, Sarah Bauer, Michelle Groesbeck, Kim Beney, Joelle Baxter, Amy Burghardt, Jenna Russell, Carole Ramm, Lisa Mayer, Caleb Ward, Chinwendu Uzosike, Asmaa Ibrahim, Robert Deblander, Ramsay Bielak, Kendra Goforth, Sanaa Khechen, Hope Wheeler, Hanna Wilhelm, Danielle Kassa, Kayla Morse, Nicole Hermes, Emily Wade, Stephanie Otto, Haikel Haile, and Alexis Hurley at the University of Michigan, Michigan.
Disclaimer. The findings and conclusions in this report are those of the authors and do not necessarily represent the official position of the Centers for Disease Control and Prevention.
Financial support. This work was supported by the Centers for Disease Control and Prevention [cooperative agreement IP15-002], including U01IP000979 at the Tennessee site, U01IP000974 at the Michigan site, U01IP000972 at the Texas site, and U01IP000969 at the Pennsylvania site. This work was also supported in part at the Pennsylvania site by the National Institutes of Health (NIH) Clinical and Translational Science Award (CTSA) program [grant UL1 TR001857]. At Vanderbilt University Medical Center, the project was also supported by the NIH CTSA award [UL1 TR002243].
Potential conflicts of interest: H. K. T. has no potential conflicts of interest. E. T. M. reports grants from CDC, during the conduct of the study; personal fees from Pfizer, grants from Merck, outside the submitted work. M. G. reports grants from CDC during the conduct of the study; 2 grants from CDC and grants from CDC-Abt Associates, outside the submitted work. D. B. M. reports personal fees from Seqirus, grants and personal fees from Pfizer, personal fees from Sanofi Pasteur, personal fees from GlaxoSmithKline, during the conduct of the study. F. P. S. reports grants from CDC during the conduct of the study and received research grant from Ansun and Novartis. K. M. reports grants from CDC, during the conduct of the study; grants from CDC, outside the submitted work. R. K. Z. reports grants from CDC, during the conduct of the study; grants from Sanofi Pasteur, outside the submitted work. J. G. P. reports grants from CDC during the conduct of the study. J. M. F. reports nonfinancial support from Institute for Influenza Epidemiology (funded in part by Sanofi Pasteur), outside the submitted work. A. S. M. reports personal consultant fees from Sanofi, Roche, and from Seqirus, outside the submitted work.
All authors have submitted the ICMJE Form for Disclosure of Potential Conflicts of Interest.
References
Author notes
H. Keipp Talbot and Emily T. Martin contributed equally to this article as first authors.

