


Abstract
Typhoid fever in the United States is acquired primarily through international travel by unvaccinated travelers. There is currently no typhoid vaccine licensed in the United States for use in children <2 years.
We reviewed Salmonella enterica serotype Typhi infections reported to the Centers for Disease Control and Prevention (CDC) and antimicrobial-resistance data on Typhi isolates in CDC’s National Antimicrobial Resistance Monitoring System from 1999 through 2015.
5131 cases of typhoid fever were diagnosed and 5004 Typhi isolates tested for antimicrobial susceptibility. Among 1992 pediatric typhoid fever patients, 1616 (81%) had traveled internationally within 30 days of illness onset, 1544 (81%) of 1906 were hospitalized (median duration, 6 days; range, 0–50), and none died. Forty percent (799) were <6 years old; 12% were <2 years old. Based on age and travel destination, 1435 (83%) of 1722 pediatric patients were vaccine-eligible; only 68 (5%) of 1361 were known to be vaccinated. Of 2003 isolates tested for antimicrobial susceptibility, 1216 (61%) were fluoroquinolone-nonsusceptible, of which 272 (22%) were also resistant to ampicillin, chloramphenicol, and trimethoprim-sulfamethoxazole (multidrug-resistant [MDR]). All were susceptible to ceftriaxone and azithromycin. MDR and fluoroquinolone-nonsusceptible isolates were more common in children than adults (16% vs 9%, P < .001, and 61% vs 54%, P < .001, respectively). Fluoroquinolone nonsusceptibility was more common among travel-associated than domestically acquired cases (70% vs 17%, P < .001).
Approximately 95% of currently vaccine-eligible pediatric travelers were unvaccinated, and antimicrobial-resistant infections were common. New public health strategies are needed to improve coverage with currently licensed vaccines. Introduction of an effective pretravel typhoid vaccine for children <2 years could reduce disease burden and prevent drug-resistant infections.
Typhoid fever is caused by Salmonella enterica serotype Typhi (Typhi) and transmitted via the fecal–oral route. An estimated 10.9 million cases occur globally each year, causing approximately 117 000 deaths, primarily among populations with limited access to safe water and sanitation [1]. Symptoms range from low-grade fevers to severe disease or death. Children are especially susceptible to infection, particularly in endemic settings [2, 3]. Despite the significant illness burden, with prompt appropriate antimicrobial therapy, mortality rates have declined from 10–20% to below 1% [1, 4]. Typhoid fever is often treated empirically, and effective antimicrobial treatment is complicated by increasing antimicrobial resistance (AMR) to commonly prescribed antimicrobials such as fluoroquinolones [5–7]. Approximately 300 culture-confirmed cases of typhoid fever are reported to the Centers for Disease Control and Prevention (CDC) each year, although an estimated 5750 cases occur [8, 9]. Most cases occur in persons who had not received typhoid vaccination and who traveled internationally within 30 days of illness onset [8, 10]. The CDC recommends typhoid vaccination for travelers to 167 countries or territories with recognized exposure risks [11]. Two typhoid vaccines are available in the United States, a parenteral Vi capsular polysaccharide vaccine (ViCPS) and an oral live attenuated vaccine (Ty21a). Both are 50–80% effective. ViCPS is not licensed for use in children younger than 2 years old and requires a booster after 2 years, while the Ty21a vaccine is not licensed for children younger than 6 years old and requires a booster after 5 years. These age limitations, and the relatively short duration of protection, leave many child travelers at risk of acquiring typhoid abroad. Newer typhoid conjugate vaccines (TCVs), which combine the ViCPS with a protein carrier, have demonstrated higher efficacy (82.0–91.5%) and induce a robust immune response in young children [12–15].
Three tetanus toxoid conjugate typhoid vaccines, Typbar TCV, Peda Typh, and Zyvac TCV, are licensed in India [16]. In October 2017, the World Health Organization (WHO) Strategic Advisory Group of Experts on Immunization updated recommendations to introduce TCV as a single dose for infants and children aged 6 months or older in endemic countries [17]; Typbar TCV received WHO prequalification in December 2017; and Gavi, the Vaccine Alliance, approved funding support for the introduction of TCV. The incorporation of typhoid vaccines into routine immunization in typhoid-endemic areas is an important step toward global typhoid control that will ultimately reduce the typhoid fever risk for US travelers. To explore the implications of updated vaccination strategies targeting younger at-risk children in the United States, we present the epidemiologic, clinical, and AMR characteristics of pediatric typhoid fever infections diagnosed in the United States.
METHODS
Through National Typhoid and Paratyphoid Fever Surveillance (NTPFS), CDC receives standard surveillance case reports from state and local health officials on culture-confirmed typhoid cases, defined as an acute illness compatible with typhoid fever for which Typhi has been isolated from a normally sterile site or stool/urine. Patient demographic, clinical, laboratory, and epidemiologic data are collected, including information on typhoid vaccination status and travel history [18]. Since 1999, CDC has asked public health laboratories to forward all Typhi isolates they receive from clinical laboratories to the National Antimicrobial Resistance Monitoring System (NARMS) for antimicrobial susceptibility testing [19]. All 50 states and 3 metropolitan health departments have participated since 2003. The CDC NARMS laboratory uses broth microdilution (Sensititre; Trek Diagnostics, Cleveland, Ohio) to determine the minimum inhibitory concentration (MIC) for 14 antimicrobial agents. We limited our analysis to 7 clinically relevant antimicrobial agents. We used interpretive criteria from the Clinical and Laboratory Standards Institute and categorized resistance patterns as follows: (1) fluoroquinolone-nonsusceptible (FQ-NS), defined as having resistance or intermediate susceptibility to ciprofloxacin or resistance to nalidixic acid; (2) multidrug-resistant (MDR), defined as resistant to ampicillin, chloramphenicol, and trimethoprim-sulfamethoxazole; and (3) fully susceptible, meaning susceptible to all clinically relevant antimicrobials including ceftriaxone and azithromycin [20]. Routine azithromycin testing began in 2011. Data from NARMS and NTPFS were linked by specimen identification numbers, age, sex, and collection date for all study years.
We report descriptive statistics for typhoid fever cases from 1999 to 2015 for demographic and clinical characteristics and describe AMR patterns. When date of birth and date of symptom onset were identical or less than 30 days apart, patient age was set to 1 month, consistent with prior reports [21]. We defined travel-associated cases as those reporting international travel or living outside the United States within 30 days of illness onset. We used the United Nations criteria to group countries visited by travelers into regions [22]. Data used in the country-specific analysis were limited to travelers who reported travel to a single country before illness onset; we included individuals reporting 1 region, even if multiple countries within this region were visited, in the regional analysis. Characteristics of pediatric cases were compared with those of adults (≥18 years old), stratified by age group reflective of current vaccination recommendations [23], as follows: younger than 6 months (not eligible); 6–23 months (potentially eligible for TCV); 2–6 years old (ViCPS eligible, potentially eligible for TCV); and 6–17 years old (Ty21a eligible, ViCPS eligible, and potentially eligible for TCV). Data were also stratified by travel history. We defined vaccine eligibility as persons age-eligible for currently licensed US vaccines (≥2 years old) who had travelled to a country where CDC recommended typhoid vaccine as of 2013.
We used Fisher’s exact tests to test for associations between categorical variables comparing pediatric cases versus adults (Table 1) and travel-associated cases versus domestically acquired cases (Table 2). The Kruskal-Wallis test was used when comparing 3 or more groups and where the normality assumptions were violated. We assessed trends over time using the Cochran-Armitage test and negative binomial regression. Two-tailed P values are reported. Statistical analyses were performed using R version 3.5.3 (R Foundation for Statistical Computing) [24].
Demographics and Clinical Characteristics of Typhoid Fever Cases Reported to the National Typhoid and Paratyphoid Fever Surveillance, by Age Group—United States, 1999–2015
| Characteristics | <6 Months | 6–23 Months | 23 Months–5 Years | 6–17 Years | <18 Years | ≥18 Years | Total | (<18 Years vs ≥18 Years), P Value |
|---|---|---|---|---|---|---|---|---|
| Total reported cases | 14 | 210 | 575 | 1193 | 1992 | 2981 | 5131 | … |
| Median (range) age, years | 0.21 (0.02–0.499) | 1.38 (0.51–1.99) | 3.9 (2–5.99) | 10.78 (6–17.99) | 7.32(0.02,17.997) | 31.14 (18–103.06) | 23.26 (0.02, 103.06) | … |
| Female | 9/14 (64.3) | 95/208 (45.7) | 265/569 (46.6) | 557/1183 (47.1) | 926/1974 (46.9) | 1404/2954 (47.5) | 2403/5085 (47.3) | (46.9%, 47.5%), .6836 |
| US citizen | 9/10 (90.0) | 132/144 (91.7) | 307/360 (85.3) | 544/734 (74.1) | 992/1248 (79.5) | 925/1733 (53.4) | 1985/3100 (64.0) | (79.5%, 53.4%), <.001 |
| Vaccine-eligible | 0/14 (0.0) | 0/205 (0.0) | 440/555 (79.3) | 995/1167 (85.3) | 1435/1722 (83.3) | 2303/2873 (80.2) | 3738/4814 (77.6) | (83.3%, 80.2%), .0078a |
| Received vaccinationb | 0/10 (0.0) | 4/143 (2.8) | 24/408 (5.9) | 40/810 (4.9) | 68/1361 (5.0) | 92/1921 (4.8) | 164/3402 (4.8) | (5.0%, 4.8%), .8053a |
| Oral Ty21a | 0/10 (0.0) | 0/139 (0.0) | 0/387 (0.0) | 5/779 (0.6) | 5/779 (0.6) | 22/1863 (1.2) | 28/3285 (0.9) | (0.6%, 1.2%), .2886c |
| ViCPS | 0/10 (0.0) | 0/139 (0.0) | 6/390 (1.5) | 11/784 (1.4) | 17/1174 (1.4) | 16/1852 (0.9) | 34/3282 (1.0) | (1.4%, 0.9%), .1513a |
| Killed typhoid | 0/10 (0.0) | 0/139 (0.0) | 4/390 (1.0) | 1/773 (0.1) | 5/1163 (0.4) | 5/1843 (0.3) | 10/3261 (0.3) | (0.4%, 0.3%), .5231a |
| Travel-associated | 7/14 (50.0) | 138/205 (67.3) | 453/555 (81.6) | 1018/1167 (87.2) | 1616/1941 (83.3) | 2379/2873 (82.8) | 4119/4964 (83.0) | (83.3%, 82.8%), .6959 |
| Visiting friends or relatives | 3/13 (23.1) | 101/175 (57.7) | 328/462 (71.0) | 696/940 (74.0) | 1128/1590 (70.9) | 1387/2201 (63.0) | 2596/3909 (66.4) | (70.9%, 63.0%), <.001 |
| Tourism | 1/12 (8.3) | 3/144 (2.1) | 15/382 (3.9) | 71/747 (9.5) | 90/1285 (7.0) | 211/1844 (11.4) | 310/3220 (9.6) | (7%, 11.4%), <.001 |
| Immigration | 1/13 (7.7) | 8/152 (5.3) | 39/397 (9.8) | 88/763 (11.5) | 136/1325 (10.3) | 195/1885 (10.3) | 343/3303 (10.4) | (10.3%, 10.3%), .9531 |
| Business | 0/13 (0.0) | 2/148 (1.4) | 1/384 (0.3) | 4/746 (0.5) | 7/1291 (0.5) | 163/1857 (8.8) | 176/3241 (5.4) | (0.5%, 8.8%), <.001 |
| Traced to chronic carrier | 3/12 (25.0) | 30/154 (19.5) | 35/441 (7.9) | 40/925 (4.3) | 108/1532 (7.0) | 48/2220 (2.2) | 160/3880 (4.1) | (7%, 2.2%), <.001 |
| Traced to part of an outbreak | 1/14 (7.1) | 24/185 (13.0) | 44/497 (8.9) | 88/1019 (8.6) | 157/1715 (9.2) | 131/2475 (5.3) | 294/4315 (6.8) | (9.2%, 5.3%), <.001 |
| Site of isolation | ||||||||
| Blood only | 7/12 (58.3) | 152/206 (73.8) | 406/557 (72.9) | 849/1155 (73.5) | 1414/1930 (73.3) | 2254/2883 (78.2) | 3770/4957 (76.1) | (73.8%, 78.8%), <.001 |
| Stool only | 0/12 (0.0) | 28/206 (13.6) | 88/557 (15.8) | 158/1155 (13.7) | 274/1930 (14.2) | 316/2883 (11.0) | 622/4957 (12.5) | (14.2%, 11%), <.001 |
| Blood and stool only | 3/12 (25.0) | 20/206 (9.7) | 55/557 (9.9) | 126/1155 (10.9) | 204/1930 (10.6) | 177/2883 (6.1) | 386/4957 (7.8) | (10.6%, 6.1%), <.001 |
| Other sites | 2/12 (16.7) | 6/206 (2.9) | 8/557 (1.4) | 22/1155 (1.9) | 38/1930 (2.0) | 136/2883 (4.7) | 179/4957 (3.6) | (2%, 4.7%), <.001 |
| Hospitalized | 14/14 (100.0) | 171/204 (83.8) | 436/545 (80.0) | 923/1143 (80.8) | 1544/1906 (81.0) | 2091/2830 (73.9) | 3745/4883 (76.7) | (81%, 73.9%), <.001 |
| Median (range) duration of hospitalization, days | 5 (2–15) | 5 (0–18) | 6 (0–37) | 6 (0–50) | 6 (0–50) | 5 (0–97) | 5 (0–97) | (6%, 5%), <.001 |
| Died | 0/11 (0.0) | 0/193 (0.0) | 0/525 (0.0) | 0/1080 (0.0) | 0/1809 (0.0) | 11/2699 (0.4) | 11/4642 (0.2) | (0%, 0.4%), .0043 |
Data are presented as n/N (%) unless otherwise indicated; N = 5131.
Abbreviation: ViCPS, Vi capsular polysaccharide vaccine.
aComparison between 2–18 years vs ≥18 years.
b1729 of 5131 (34%) typhoid cases were missing vaccination data.
cComparison between 6–17 years vs ≥18 years.
Characteristics of Pediatric Typhoid Fever Cases Reported to National Typhoid and Paratyphoid Surveillance, by Travel Status—United States, 1999–2015
| Characteristics | Travel History | Domestically Acquired | P Value |
|---|---|---|---|
| Cases, n (%) | 1616 (83) | 325 (17) | |
| Age, median (range), years | 7.89 (0.02–17.99) | 5.07 (0.08–17.99) | <.001 |
| <6 months | 7/1616 (0.4) | 7/325 (2.2) | .004 |
| 6–23 months | 138/1616 (8.5) | 67/325 (20.6) | <.001 |
| 2–5 years | 453/1616 (28.0) | 102/325 (31.4) | .226 |
| 6–18 years | 1018/1616 (63.0) | 149/325 (45.8) | <.001 |
| Female | 759/1602 (47.4) | 142/322 (44.1) | .298 |
| US citizen | 758/989 (76.6) | 214/238 (89.9) | <.001 |
| Vaccine-eligible | 1435/1616 (88.8) | 0/325 (0) | |
| Received vaccinationa | 57/998 (5.7) | 0/243 (0) | |
| Oral Ty21a | 4/951 (0.4) | … | |
| ViCPS | 17/961 (1.8) | … | |
| Killed typhoidb | 5/950 (0.5) | … | |
| Traced to chronic carrier | 21/1264 (1.7) | 85/249 (34.1) | <.001 |
| Traced to part of an outbreak | 87/1399 (6.2) | 66/287 (23.0) | <.001 |
| Hospitalized | 1276/1569 (81.3) | 247/307 (80.5) | .750 |
| Median (range) duration of hospitalization, days | 6 (0–50) | 6 (1–18) | .2257c |
| Died | 0/1478(0) | 0/301(0) | |
| NARMS AMR patterns for 1295 (62%) NTPFS records, 1999–2015d | |||
| Cases, n (%) | 1066 (82) | 204 (16) | |
| MDRe | 178/1066 (16.7) | 11/204 (5.4) | <.001 |
| FQ-NSf | 748/1066 (70.2) | 35/204 (17.2) | <.001 |
| Susceptible to all relevant antibioticsg | 271/1066 (25.4) | 166/204 (81.4) | <.001 |
| Both MDR and FQ-NS | 147/1066 (13.8) | 8/204 (3.9) | <.001 |
Data are presented as n/N (%) unless otherwise indicated; N = 1941.
Abbreviations: AMR, antimicrobial resistance; FQ-NS, fluoroquinolone-nonsusceptible; MDR, multidrug-resistant; NARMS, National Antimicrobial Resistance Monitoring System; NTPFS, National Typhoid and Paratyphoid Fever Surveillance; ViCPS, Vi capsular polysaccharide vaccine.
aWithin 5 years of illness onset.
bKilled typhoid vaccine discontinued in 2000.
cWilcoxon rank-sum test with continuity correction.
d25 records have unknown travel status.
eResistant to ampicillin, chloramphenicol, trimethoprim-sulfamethoxazole.
fResistant to nalidixic acid or had decreased susceptibility to ciprofloxacin.
gClinically relevant antibiotics include nalidixic acid, ampicillin, chloramphenicol, trimethoprim-sulfamethoxazole, ceftriaxone, and ciprofloxacin; azithromycin was added systematically in 2011 and included here if tested.
RESULTS
All Typhoid Cases Reported to the National Typhoid and Paratyphoid Fever Surveillance
During 1999–2015, 5390 typhoid fever cases were reported to NTPFS; 4 duplicate reports were removed, and 255 cases did not meet the case definition, leaving 5131 (95.2%) included cases. Of these, 1992 (38.8%) occurred in persons younger than 18 years old, including 210 in those aged 6–23 months old (Table 1). On average, the number of reported typhoid cases increased by 3.4% (95% confidence interval [CI], 1.3–5.6%) per year (P < .001), with the annual number of pediatric cases showing a similar increase (P = .003) (Figure 1). The overall proportion of cases younger than 18 years was stable over time (P = .609, Cochran-Armitage test). Pediatric typhoid cases were reported from Washington, DC, and every state except for Montana, Wyoming, Vermont, and West Virginia. California reported the most pediatric cases (n = 363), followed by New York (n = 340) and New Jersey (n = 175). Pediatric cases were more likely to be US citizens (79.5% vs 53.4%, P < .001) than adults (Table 1).
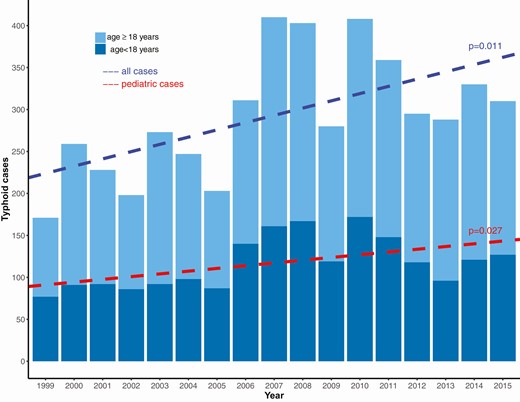
Cases of typhoid fever reported to the National Typhoid and Paratyphoid Fever Surveillance by year and age group—United States, 1999–2015.
Pediatric cases were more frequently associated with a chronic carrier (7.0% vs 2.2%, P < .001) or an outbreak (9.2% vs 5.3%, P < .001) compared with adult cases. Children were more likely to have culture confirmation in both blood and stool specimens than adults (10.6% vs 6.1%, P < .001), but less likely to have Typhi isolated from other sites, including urine, gallbladder, and wounds/abscesses (2.0% vs 4.7%, P < .001). Pediatric patients were more likely to be hospitalized (81.0% vs 73.9%, P < .001); the median hospital stay in children was 6 days (range, <1–50 days) versus 5 days (range, <1–97 days) in adults (P < .001). Eleven (0.4%) of 2699 adult patients and no pediatric patients died (P = .004) (Table 1).
Travel-associated Cases
Among the 1941 (97.4%) of 1992 pediatric patients with available travel history data, 1616 (83.3%) of 1941 reported international travel or living outside the United States within 30 days of illness onset. By age group and known travel history, travel-associated cases represented 50.0% (7/14) of those younger than 6 months old, 67.3% (138/205) of 6- to 23-month-olds, 81.6% (453/555) of 2- to 5-year-olds, and 87.2% (1018/1167) of 6- to 17-year-olds (Table 1). The median of annual estimates of the proportion of all travel-associated cases who were 18 years old or younger was 40.1% (range, 31.4–46.6%; P = .31; no observed trend over time). Within pediatric travel-associated cases, the age-group–specific proportions remained stable over time. Among travel-associated typhoid cases, pediatric cases reported visiting friends and relatives (VFR) as their travel purpose more frequently than adults (70.9% vs 63.0%, P < .001) (Table 1).
Most, 1435 (88.8%) of 1616, pediatric travel-associated cases were vaccine-eligible (Table 2). Among those who were vaccine-eligible, vaccination was low, 57 (5.7%) of 998, and did not differ across pediatric age groups (P = .58) from prevalence among adults (5.2%, P = .58) or by reported purpose of travel.
Travel to Asia represented 84.5% (1365/1616) of all pediatric single-continent travel destinations (Table 3). Among pediatric cases who traveled to or from Asia, South Asia was the most commonly reported subregion (overall, 93.2%; <6 months, 100%; 6–23 months, 97.5%; 2–5 years, 93.0%; 6–17 years, 92.0%). For pediatric cases who reported travel to a single country, India (785 [48.6%] of 1616), Pakistan (239 [14.8%] of 1616), and Bangladesh (227 [14.0%] of 1616)—each in South Asia—were the most common destinations (Table 3).
Destinations of Patients With Travel-associated Typhoid Fever Who Reported Travel to a Single Country, Region, or Continent: National Typhoid and Paratyphoid Fever Surveillance—United States, 1999–2015
| Typhoid Cases | ||||||
|---|---|---|---|---|---|---|
| <6 Months | 6 Months–1 Year | 2–5 Years | 6–17 Years | <18 Years | ≥18 Years | |
| All typhoid cases | 14 | 210 | 575 | 1193 | 1992 | 2981 |
| Domestically acquired cases | 7 | 67 | 102 | 149 | 325 | 493 |
| Travel associated cases | 7 | 138 | 453 | 1018 | 1616 | 2379 |
| Single Travel Destination | ||||||
| Single country travel | 6 | 131 | 425 | 958 | 1520 | 2122 |
| Asia | 5 (71.4) | 122 (88.4) | 401 (88.5) | 837 (82.2) | 1365 (84.5) | 1843 (77.5) |
| South Asiaa | 5 (71.4) | 119 (86.2) | 373 (82.3) | 770 (75.6) | 1272 (78.7) | 1557 (65.4) |
| India | 3 (42.9) | 71 (51.4) | 231 (51.0) | 480 (47.2) | 785 (48.6) | 1239 (52.1) |
| Bangladesh | 1 (14.3) | 29 (21.0) | 69 (15.2) | 128 (12.6) | 227 (14.1) | 190 (8.0) |
| Pakistan | 1 (14.3) | 16 (11.6) | 71 (15.7) | 151 (14.8) | 239 (14.8) | 109 4.6) |
| Nepal | 0 (0) | 3 (2.2) | 1 (<1) | 9 (<1) | 13 (<1) | 17 (<1) |
| South East Asiab | 0 (0) | 3 (2.2) | 11 (2.4) | 33 (3.2) | 47 (2.9) | 147 (6.2) |
| Philippines | 0 (0) | 0 (0) | 7 (1.5) | 16 (1.6) | 23 (1.4) | 75 (3.2) |
| Indonesia | 0 (0) | 2 (1.4) | 1 (<1) | 8 (<1) | 11 (<1) | 35 (1.5) |
| East Asia | 0 (0) | 0 (0) | 0 (0) | 1 (<1) | 1 (<1) | 5(<1) |
| Central Asia | 0 (0) | 0 (0) | 0 (0) | 0 (0) | 0 (0) | 1 (<1) |
| Western Asia | 0 (0) | 0 (0) | 2 (<1) | 8 (<1) | 10 (<1) | 15(<1) |
| Africa | 0 (0) | 4 (2.9) | 20 (4.4) | 32 (3.1) | 56 (3.5) | 80 (3.4) |
| North Africa | 0 (0) | 1 (<1) | 0 (0) | 4 (<1) | 5 (<1) | 3 (<1) |
| Southern Africa | 0 (0) | 0 (0) | 0 (0) | 0 (0) | 0 (0) | 0 (0) |
| Central Africa | 0 (0) | 0 (0) | 3 (<1) | 2 (<1) | 5 (<1) | 5 (<1) |
| West Africa | 0 (0) | 2 (1.4) | 10 (2.2) | 18 (1.8) | 30 (1.9) | 56 (2.4) |
| Nigeria | 0 (0) | 1 (<1) | 5 (1.1) | 9 (<1) | 15 (<1) | 29 (1.2) |
| Eastern Africa | 0 (0) | 0 (0) | 7 (1.5) | 8 (<1) | 15 (<1) | 14 (<1) |
| Americas | 1 (14.3) | 4 (2.9) | 16 (3.5) | 114 (11.2) | 135 (8.4) | 316 (13.3) |
| Central America | 1 (14.3) | 2 (1.4) | 10 (2.2) | 74 (7.3) | 87 (5.4) | 212 (8.9) |
| Guatemala | 0 (0) | 1 (<1) | 1 (<1) | 23 (2.3) | 25 (1.5) | 30 (1.3) |
| El Salvador | 0 (0) | 0 (0) | 2 (<1) | 6 (<1) | 8 (<1) | 47 (2.0) |
| Mexico | 1 (14.3) | 1 (<1) | 7 (1.5) | 39 (3.8) | 48 (3.0) | 114 (4.8) |
| Caribbean | 0 (0) | 2 (1.4) | 3 (<1) | 30 (2.9) | 35 (2.2) | 63 (2.6) |
| Haiti | 0 (0) | 2 (1.4) | 3 (<1) | 23 (2.3) | 28 (1.7) | 38 (1.6) |
| South America | 0 (0) | 0 (0) | 2 (<1) | 9 (<1) | 11 (<1) | 37 (1.6) |
| North America | 0 (0) | 0 (0) | 1 (<1) | 0 (0) | 1 (<1) | 1 (<1) |
| Oceania | 0 (0) | 2 (<1) | 3 (0) | 7 (<1) | 12 (<1) | 16 (<1) |
| Europe | 0 (0) | 0 (0) | 1 (<1) | 2 (<1) | 3(<1) | 9 (<1) |
| East Europe | 0 (0) | 0 (0) | 1 (<1) | 0 (0) | 1 (<1) | 3 (<1) |
| West Europe | 0 (0) | 0 (0) | 0 (0) | 2 (<1) | 2 (<1) | 5 (<1) |
Data are presented as n (% of travel-associated cases) unless otherwise indicated; N = 5131. Cumulative percentages do not add up to 100% since travel destination is listed for only those that reported only 1 country, 1 region, or 1 continental travel within the 30 days before illness onset. Countries listed are those with more than 30 total cases in the study period.
aSouth Asia includes Afghanistan, Bangladesh, Bhutan, India, Iran, Maldives, Nepal, Pakistan, Sri Lanka.
bSouth East Asia includes Philippines, Indonesia, Burma, Vietnam, Laos, Cambodia, Thailand, Singapore, Malaysia, Bali.
Domestically Acquired Cases
Only 325 (16.7%) of 1941 pediatric typhoid cases occurred in children without recent international travel. Frequency and duration of hospitalization were similar for travel-associated and domestically acquired cases (Table 2).
Antimicrobial Resistance
During 1999–2015, 5243 Typhi isolates were tested by NARMS. Patient age was available for 5004 (95%) isolates (Table 4); 2003 were pediatric cases. Among all isolates the proportion of FQ-NS (60.7% vs 53.9%, P < .001), MDR (15.9% vs 9.1%, P < .001), and both MDR and FQ-NS patterns (13.6% vs 7.9%, P < .001) was higher in pediatric cases than in adults. Isolates from children were less likely to be fully susceptible to relevant antimicrobials compared with those from adults (36.1% vs 43.7%, P < .001) (Table 4). Pediatric patients who had MDR isolates were more likely to be hospitalized than those with fully susceptible isolates (88.5% vs 82.5%, P = .042). No isolates from pediatric cases were resistant to azithromycin or ceftriaxone; among adults, 1 isolate from 2011 had intermediate ceftriaxone susceptibility and another from 2016 had azithromycin nonsusceptibility. While a higher proportion of pediatric cases travelled to South Asia compared with adults (66.4% vs 54.5%), differences between antimicrobial susceptibility patterns persisted after stratifying the analysis by travel destination (data not shown).
Antimicrobial Resistance Patterns in Salmonella enterica Serotype Typhi Isolates Tested by the National Antimicrobial Resistance Monitoring System, by Age Group—United States, 1999–2015
| Typhoid Fever Cases | |||||||
|---|---|---|---|---|---|---|---|
| Antimicrobial Resistance Patterns | <6 Months | 6 Months–1 Year | 2–5 Years | 6–17 Years | Total <18 Years | ≥18 Years | (<18 Years, ≥18 Years), P Valuea |
| Total number of isolates (n = 5004) | 12 | 212 | 564 | 1215 | 2003 | 3001 | |
| MDRb | 2/12 (16.7) | 36/212 (17.0) | 83/564 (14.7) | 199/1215 (16.4) | 320/2003 (16.0) | 272/3001 (9.1) | (16.0%, 9.1%), <.001 |
| FQ-NSc | 7/12 (58.3) | 119/212 (56.1) | 343/564 (60.8) | 747/1215 (61.5) | 1216/2003 (60.7) | 1619/3001 (53.9) | (60.7%, 53.9%), <.001 |
| Susceptible to all relevant antibioticsd | 5/12(41.7) | 91/212 (42.9) | 198/564(35.1) | 429/1215 (35.3) | 723/2003 (36.1) | 1312/3001(43.7) | (36.1%, 43.7%), <.001 |
| Both MDR and FQ-NS | 2/12 (16.7) | 34/212 (16.0) | 65/564 (11.5) | 171/1215 (14.1) | 272/2003 (13.6) | 236/3001 (7.9) | (13.6%, 7.9%), <.001 |
Data are presented as n/N (%) unless otherwise indicated.
Abbreviations: FQ-NS, fluoroquinolone-nonsusceptible; MDR, multidrug-resistant.
aBased on Fisher’s exact test.
bResistant to ampicillin, chloramphenicol, and trimethoprim-sulfamethoxazole.
cResistant or intermediate susceptibility to ciprofloxacin or resistance to nalidixic acid.
dClinically relevant antibiotics include nalidixic acid, ampicillin, chloramphenicol, trimethoprim-sulfamethoxazole, ceftriaxone, and ciprofloxacin. Azithromycin was added in 2011 and included here if tested.
The NARMS data were available for 3169 (61.6%) of 5131 typhoid cases reported to NTPFS. Of 2003 isolates from pediatric cases, 1270 (63.4%) were from patients with known travel status. Isolates from pediatric patients with known travel to Asia only were more likely to be FQ-NS than isolates from patients who traveled to other continents (727 [79.3%] of 917 vs 5 [4.8%] of 125). Fluoroquinolone-nonsusceptibility was common among those reporting travel to South Asia, including India (465 [89.3%] of 521), Bangladesh (139 [82.7%] of 168), and Pakistan (98 [62.0%] of 158). The proportion of MDR isolates was higher among travelers to Africa than among travelers to Asia (35.0% vs 17.2%); however, the total number of MDR isolates associated with African travel was small (n = 14) compared with Asia (n = 158). Travel to South Asia accounted for the largest proportion of travel-associated drug resistance (149 [83.7%] of 178 MDR isolates, 709 [94.7%] of 748 FQ-NS isolates, and 136 [92.5%] of 147 isolates that were both MDR and FQ-NS) (Supplementary Table 1). Among travelers to South Asia, MDR isolates were more commonly recovered from travelers to Pakistan than from those traveling to India or Bangladesh (42.4% vs 6.3% vs 28.6%) (Supplementary Table 1).
DISCUSSION
In the United States, typhoid has been nonendemic for many decades, and with most cases now associated with travel to typhoid-endemic countries, the steep decline in US typhoid incidence from 1918 through 1970 has leveled off [6–8, 10, 25]. During 1999–2015, nearly 40% of all reported culture-confirmed typhoid cases in the United States occurred among children. The number of typhoid infections in vaccine-eligible children (≥2 years old) showed an increase of 4.4% (95% CI, 1.2–6.6%) per year, on average, while in children younger than 2 years old no trend was found over this 17-year period. The overall increase in pediatric cases may reflect increases in population (from 71.9 million to 73.6 million from 1999 to 2015) [26], numbers of pediatric travelers due to ease of international travel, or numbers of immigrants and their families with connections to typhoid-endemic countries [27].
Although most (83.3%) children were eligible for vaccination, only 1 in 20 reportedly received a typhoid vaccine. These low pretravel vaccination proportions are similar to those from retrospective tertiary hospital reviews from Canada and Australia [28, 29]. Urgent efforts to promote vaccine coverage among eligible children with currently available vaccines are critical, while future introduction of safe and effective TCVs could expand vaccine coverage among younger age groups in the United States and provide longer duration of protection. Most, 1544 (81%) of 1906, of the children with typhoid were hospitalized, and children aged 6–23 months old, currently ineligible for vaccination, were more likely to be hospitalized than older children. Hospitalizations represent financial strains on families from direct medical costs and missed work time: a 5-day inpatient typhoid evaluation may cost more than $7000 [30]. A lower number of children in the 6- to 23-month age group, 138 (67.3%) of 205, were travel-associated cases compared with 1471 (85.4%) of 1722 older children; however, even in this age group, where current prevention recommendations are limited to water and food precautions, they accounted for over half of all cases. Introduction of TCV to those aged 6–23 months old could be a valuable added prevention strategy for this vulnerable age group, expanding the number of pediatric travelers eligible for pretravel vaccination by at least 2% (from 83% to 85%). Compared with currently licensed typhoid vaccines in the United States, TCVs are expected to confer longer lasting protection to pediatric and adult travelers, with the added benefit of requiring less frequent boosters [31]. Depending on the duration of protection of a TCV licensed for children younger than 2 years old, higher rates of protective immunity might also potentially accrue to older pediatric travelers, as those most at risk may make multiple visits to family or friends in high-risk countries.
Although we were unable to assess if families of the pediatric travelers in this study sought pretravel advice, barriers to seeking travel health advice and vaccinations include language, costs associated with travel appointments, and lack of awareness of travel risks or the availability of travel-specific services [32]. While it may be difficult to ensure all at-risk child travelers have a travel clinic appointment, routine well-child visits could provide another opportunity for pretravel consultation, particularly for VFR travelers. Providing families with pretravel consultation during these scheduled appointments could increase vaccine coverage among pediatric travelers.
Most children with typhoid acquired during travel were visiting friends and relatives abroad. VFR travelers are at increased risk of travel-associated illness [8, 10, 33, 34] because they stay abroad for longer periods of time [35], are less likely to seek pretravel medical counseling, and may be less adherent to food and water precautions while visiting family compared with tourists. Proposed strategies to increase health risk awareness among VFR travelers have included prevention messaging using social media and targeting small businesses serving immigrant communities. These strategies, along with pretravel consultation during routine pediatric medical appointments, would be particularly helpful to reach travelers to typhoid-endemic areas such as South Asia. For example, more than one-quarter of all pediatric Typhi isolates submitted to NARMS came from 3 metropolitan areas—New York City, the San Francisco Bay Area, and Los Angeles—which have large immigrant communities that may include many potential at-risk travelers. Most pediatric typhoid cases are US citizens (992 [79.5%] of 1248) and are likely to receive routine preventative care from the US health system.
Typhoid vaccination among pediatric travelers is increasingly important in an era of increasing AMR. Two-thirds (1215) of 2003 isolates from pediatric cases were FQ-NS and 320 (16%) of 2003 were MDR. Pediatric patients with MDR isolates were more likely to be hospitalized, and FQ-NS infections have previously been associated with a greater risk of treatment failure and hospitalization costs [4]. Most (95%) FQ-NS infections were associated with travel to regions where quinolone resistance has been increasing, specifically South Asia [36]. FQ-NS and MDR strains limit the oral agents available for outpatient treatment, leaving azithromycin as the predominant agent.
In 2016, the first outbreak of extensively drug-resistant (XDR) typhoid infections—resistant to ceftriaxone, fluoroquinolones, and traditional first-line antimicrobials—was recognized in Pakistan. The outbreak is ongoing, and XDR cases among travelers to and from Pakistan have been reported in the United Kingdom [36], Canada [37], Australia [38], Denmark [39], Ireland [40] Taiwan [41], and the United States [42]. All 5 US cases initially reported were in unvaccinated children aged 4–12 years old [42]. A more recent update on 30 XDR cases associated with travel to Pakistan and diagnosed in the United States from 1 January 2018 through 31 August 2019 noted that 1 (3%) was younger than 2 years old, 6 (20%) were aged 2 to 5 years old, and 13 (43%) were aged 6 to 17 years old [43]. Antimicrobial-resistance patterns indicate that drug-resistant typhoid is common in children—both MDR and FQ-NS isolates were more frequent in children compared with adults. Eighty percent of children with typhoid who reported travel to a single destination travelled to Bangladesh, India, or Pakistan compared with 70% of adults, suggesting that the number of pediatric XDR cases is likely to increase over time.
Our data have several important limitations. Cases that are not reported and isolates that are not submitted to state or local health departments are not captured in NTPFS and NARMS, respectively. Epidemiologic data from NTPFS, including hospitalization days and travel history, are largely self-reported to local public health officials and may be subject to recall bias due to delays in data collection. We were only able to link patient isolates to their epidemiologic data for two-thirds of the cases; this may have resulted in biases, rendering the data nonrepresentative of all Typhi cases and limiting our capacity to compare regional travel data with AMR patterns. Typhoid surveillance only collects data on cases of typhoid fever and does not capture the total number of vaccinated and unvaccinated travelers to high-risk countries who did not acquire typhoid, so we cannot reliably measure the uptake and impact of pretravel vaccination. We defined vaccine eligibility based on age eligibility for currently licensed US vaccines and travel destination, which may overestimate the number of eligible cases since foreigners who became symptomatic during their visit to the United States would be considered eligible, even if they could not have received routine pretravel care in the United States. Although we included all surveillance data currently available, reporting has not been finalized for more recent years (2016–2019) and is not included in this analysis. Last, we analyzed the data using the independence assumption, but observations may be correlated (eg, family members), which may result in biased results.
In the United States, cases of typhoid fever are rare, and primarily acquired through travel to typhoid-endemic regions such as South Asia. In an era of increasing AMR and ease of international travel, typhoid vaccination with currently licensed vaccines remains a critical component of disease control. Pediatric travelers remain undervaccinated and vulnerable to infection. In addition to the 2 currently available vaccines, a licensed TCV in the United States for children younger than 2 years old would provide an additional tool for ensuring typhoid protection for young travelers and their families.
Supplementary Data
Supplementary materials are available at Clinical Infectious Diseases online. Consisting of data provided by the authors to benefit the reader, the posted materials are not copyedited and are the sole responsibility of the authors, so questions or comments should be addressed to the corresponding author.
Notes
Acknowledgments. This article is dedicated to Sara Luna, PhD, who provided her expertise to the coauthors and guided the data manipulation and analysis plan.
Disclaimer. The findings and conclusions in this report are those of the author(s) and do not necessarily represent the official position of the Centers for Disease Control and Prevention.
Potential conflicts of interest. The authors: No reported conflicts of interest. All authors have submitted the ICMJE Form for Disclosure of Potential Conflicts of Interest.
References
Strategic Advisory Group of Experts on Immunization. Summary of the October 2017 meeting of the Strategic Advisory Group of Experts on Immunization. Available at: https://www.who.int/immunization/policy/sage/SAGE_oct_2017_meeting_summary.pdf?ua=1.%202017.%20Accessed%20October%2024,%202017. Accessed
Pew Research Center.
Epi Insight.

