


Abstract
Escherichia coli is one of the most common causes of healthcare-associated infections (HAIs); multidrug resistance reduces available options for antibiotic treatment. We examined factors associated with the spread of multidrug-resistant E. coli phenotypes responsible for device- and procedure-related HAIs from acute care hospitals, long-term acute care hospitals, and inpatient rehabilitation facilities, using isolate and antimicrobial susceptibility data reported to the National Healthcare Safety Network during 2013–2017.
We used multivariable logistic regression to examine associations between co-resistant phenotypes, patient and healthcare facility characteristics, and time. We also examined the geographic distribution of co-resistant phenotypes each year by state and by hospital referral region to identify hot spots.
A total of 96 672 E. coli isolates were included. Patient median age was 62 years, and 60% were female; more than half (54%) were reported from catheter-associated urinary tract infections. From 2013 to 2017, 35% of the isolates were nonsusceptible to fluoroquinolones (FQs), 17% to extended-spectrum cephalosporins (ESCs), and 13% to both ESCs and FQs. The proportion of isolates co-resistant to ESCs and FQs was higher in 2017 (14%) than in 2013 (11%) (P < .0001); overall prevalence and increases were heterogeneously distributed across healthcare referral regions. Co-resistance to FQs and ESCs was independently associated with male sex, central line–associated bloodstream infections, long-term acute care hospitals, and the 2016–2017 (vs 2013–2014) reporting period.
Multidrug resistance among E. coli causing device- and procedure-related HAIs has increased in the United States. FQ and ESC co-resistant strains appear to be spreading heterogeneously across hospital referral regions.
Emergence of resistance to a wide range of antibiotics among Enterobacteriaceae, the most common family of human bacterial pathogens, poses a large burden on individual patients and on healthcare systems. According to data reported to the National Healthcare Safety Network (NHSN), Escherichia coli was the most common microorganism responsible for healthcare-associated infections (HAIs) in United States (US) hospitals [1]. Escherichia coli is also a leading cause of bloodstream infections in England and in Europe [2–4].
Escherichia coli is becoming increasingly resistant to multiple antibiotics [5–11]. Here we describe the role of common antibiotic-resistant E. coli phenotypes, selected based upon their important impact on limiting clinical treatment options for serious infections, as well as their association with emerging and epidemic strains, in the epidemiology of device- and procedure-related HAIs in the US.
METHODS
Data Source and Antibiotic Resistance Definitions
We analyzed data of E. coli isolates from HAIs reported by 4457 healthcare facilities (mean, 2996 healthcare facilities per year) to the device- and procedure-associated modules of NHSN from 2013 to 2017. These isolates were from central line–associated bloodstream infections (CLABSIs), catheter-associated urinary tract infections (CAUTIs), surgical site infections (SSIs), and mechanical ventilator–associated events (ventilator-associated events and ventilator-associated pneumonia). The data came from acute care hospitals, long-term acute care hospitals (LTACHs), and inpatient rehabilitation facilities. Antibiotic susceptibility results for each E. coli isolate were reported using the category interpretations of susceptible, intermediate, resistant, and not tested. Isolates with missing susceptibility results, or duplicate events from the same patient and infection type within 14 days, were not included.
Isolates were classified based on their resistance to extended-spectrum cephalosporins (ESCs), fluoroquinolones (FQs), carbapenems, and aminoglycosides (AGs). Table 1 provides definitions for resistance to each drug class and co-resistance to multiple drug classes. In brief, ESC resistance of an isolate was defined as being reported intermediate or resistant to at least 1 of ceftazidime, cefepime, cefotaxime, or ceftriaxone. FQ resistance of an isolate was defined as being reported intermediate or resistant to at least 1 of ciprofloxacin, levofloxacin, or moxifloxacin. Carbapenem resistance of an isolate was defined as being resistant to at least 1 of imipenem, meropenem, doripenem, or ertapenem. AG resistance of an isolate was defined as being intermediate or resistant to at least 1 of gentamicin, amikacin, or tobramycin. The proportion of isolates tested for antibiotic susceptibility varied by antibiotic class. As isolates that were reported as “not tested” for susceptibility to particular ESCs or carbapenems could have either been not tested for formulary reasons or had their susceptibility results suppressed from clinical reporting for antimicrobial stewardship reasons (ie, cascade reporting) [12, 13], we inferred susceptibility based on the isolates’ reported susceptibilities to penicillins and first/second-generation cephalosporins. Specifically, if an isolate was reported as “not tested” for susceptibility to cefotaxime, ceftriaxone, cefepime, and ceftazidime but was reported as susceptible to at least 2 of the antimicrobials ampicillin, aztreonam, and/or cefazolin, we inferred susceptibility to ESCs as susceptible. If an isolate was reported as “not tested” for susceptibility to doripenem, ertapenem, meropenem, and imipenem, but was reported as susceptible to at least 2 of the antimicrobials ampicillin, ampicillin/sulbactam, amoxicillin/clavulanate, piperacillin/tazobactam, cefazolin, cefoxitin, and/or cefotetan, we inferred susceptibility to carbapenems as susceptible. Isolates that had no antibiotic susceptibility information (actual or inferred, as above), were excluded from the denominator when estimating percentage of resistance for each antibiotic class.
Phenotypic Definitions of Escherichia coli Antibiotic Resistance Among Isolates Associated With Healthcare-associated Infections in the United States—National Healthcare Safety Network, 2013–2017
| Definitions | Agents Included | Defining Criteria |
|---|---|---|
| Aminoglycoside resistant | Amikacin, gentamicin, tobramycin | Intermediate or resistant to ≥1 aminoglycoside |
| Carbapenem resistant | Imipenem, meropenem, doripenem, ertapenem | Resistant to ≥1 carbapenem |
| Extended-spectrum cephalosporin resistant | Ceftazidime, cefepime, ceftriaxone, cefotaxime | Intermediate or resistant to ≥1 extended-spectrum cephalosporin |
| Fluoroquinolone resistant | Ciprofloxacin, levofloxacin, moxifloxacin | Intermediate or resistant to ≥1 fluoroquinolone |
| Concurrent resistance phenotypes | ||
| Extended-spectrum cephalosporin/fluoroquinolone resistant | Intermediate or resistant to ≥1 agent in extended-spectrum cephalosporin AND intermediate or resistant to ≥1 agent in fluoroquinolone classes | |
| Extended-spectrum cephalosporin/fluoroquinolone/aminoglycoside resistant | Intermediate or resistant to ≥1 agent in extended-spectrum cephalosporin AND intermediate or resistant to ≥1 agent in fluoroquinolone AND intermediate or resistant to ≥1 agent in aminoglycoside classes |
Statistical Analysis
The distribution of isolates was studied by patient and healthcare facility characteristics. The prevalence of ESC, FQ, AG, and carbapenem resistance and concurrent resistance to FQs and ESCs as well as FQs, ESCs, and AGs was calculated overall and by study year. The proportions of co-resistant isolates or isolates resistant to >1 antibiotic class were compared across patient demographic variables and healthcare facility types using a χ 2 test; P values <.05 were considered statistically significant. We used univariate and multivariate logistic regression models to examine associations between patient-level and facility-level characteristics (ie, sex, age group, HAI type, healthcare facility type, medical school affiliation, location within hospital, event year) and particular resistance and co-resistance phenotypes. Comparisons of resistance proportions between different years were made using χ 2 test. In the multivariate analysis, to assess changes over time, we compared 2 equal-length time periods: the first 2 years (2013–2014) with the 2 last years studied (2016–2017). All statistical analyses were performed using SAS software version 9.4 (SAS Institute, Cary, North Carolina).
Spatial Analysis
We used a geographic information system (GIS) to depict the geographic distribution of E. coli–resistant phenotypes in the US. As healthcare facilities are not distributed evenly by county or state, our spatial analysis also used hospital referral regions (HRRs), which represent regional healthcare markets that generally require the services of a major referral center. Each HRR has at least 1 city where both major cardiovascular surgical procedures and neurosurgical procedures are performed, as defined in the online Dartmouth Atlas of Health Care (https://www.dartmouthatlas.org/downloads/atlases/96Atlas.pdf). There are 306 such HRRs in the US. The distribution of E. coli antibiotic-resistant phenotypes was mapped by state and by HRR, using ArcGIS version 10.7.1 software (Esri, Redlands, California); the maps are choropleth maps, where darker shades indicate a higher percentage of resistant phenotypes. The percentage of resistance values for the HRR maps are classified into quintiles based on data from 2013 to 2017. We did not display data for any HRR for which there were <5 healthcare facilities and <20 E. coli isolates with susceptibility results in a year. Such HRRs represented 50.7%–57.7% of all HRRs for each given year, but 17.7% of all HRRs for the aggregate time 2013–2017.
RESULTS
Distribution of E. coli Isolates
A total of 104 198 E. coli isolates were reported in the NHSN device- and procedure-associated modules from 2013 to 2017. Of these, 14 095 (14%) did not have susceptibility information for any of the ESCs; we were able to infer susceptibility for 6569 of these isolates using the rules outlined in the Methods. The remaining 7526 isolates for which there was not enough information to infer susceptibility were not included.
There were 96 672 E. coli isolates reported to NHSN from 2013–2017 that were included in this analysis (Table 2). The majority of the isolates were found in women (60%) and in patients >55 years of age (66%); the patients’ median age was 62 years (interquartile range, 49–73 years). CAUTIs were the most common HAI (54%) associated with E. coli, followed by SSIs (35%). The preponderance of CAUTI as the source of E. coli was even more pronounced among women (61%), compared to men (46%). Conversely, CLABSI isolates represented 15% of all E. coli isolates among men vs 7% among women, and SSI isolates represented 37% of E. coli among men vs 31% among women. Most of the E. coli HAI data were reported from general acute care hospitals (89%), with most isolates reported from adult wards (47%), followed by adult intensive care units (42%).
Patient and Healthcare Facility Characteristics of Healthcare-associated Escherichia coli—National Healthcare Safety Network, 2013–2017 (N = 96 672)
| Characteristic | No. (%) of Isolates |
|---|---|
| Sex | |
| Female | 57 989 (60) |
| Male | 38 683 (40) |
| Event type | |
| CLABSI | 9867 (10) |
| SSI | 33 434 (35) |
| CAUTI | 52 485 (54) |
| MVAE | 886 (1) |
| Event year | |
| 2013 | 17 406 (18) |
| 2014 | 18 521 (20) |
| 2015 | 20 799 (21) |
| 2016 | 20 389 (21) |
| 2017 | 19 557 (20) |
| Healthcare facility type | |
| GACH | 85 669 (89) |
| IRF | 2492 (2) |
| LTACH | 4562 (5) |
| Othera | 3949 (4) |
| Location typeb | |
| Adult ICU | 28 817 (42) |
| Adult ward | 32 489 (47) |
| Adult oncology unit | 5267 (8) |
| Pediatric ICU | 1679 (2) |
| Pediatric ward | 617 (1) |
| Age group, y | |
| 0–17 | 3592 (4) |
| 18–54 | 29 079 (30) |
| 55–64 | 20 362 (21) |
| 65–74 | 21 418 (22) |
| ≥75 | 22 221 (23) |
| Healthcare facility teaching statusb | |
| Teaching facilityc | 67 176 (78) |
| Nonteaching facility | 18 493 (22) |
Abbreviations: CAUTI, catheter-associated urinary tract infection; CLABSI, central line–associated bloodstream infection; GACH, general acute care hospital; ICU, intensive care unit; IRF, inpatient rehabilitation facility; LTACH, long-term acute care hospital; MVAE, mechanical ventilator–associated event; SSI, surgical site infection.
aIncludes critical access hospitals, children’s hospitals, military hospitals, oncology hospitals, women’s hospitals, women’s/children’s hospitals, orthopedic hospitals, psychiatric hospitals, surgical hospitals, and Veterans Administration medical centers.
bLTACHs and IRFs not included.
cIncludes undergraduate, graduate, and major teaching hospitals.
Prevalence of Resistance to Antibiotic Classes and Changes Over Time
Overall, from 2013 to 2017, ESC, FQ, and AG resistance among E. coli was 17%, 35%, and 25%, respectively. Resistance to FQs was higher in 2017 (35%) compared with 2013 (34%) (P < .0001), whereas resistance to ESCs was also higher in 2017 (19%), compared with 2013 (14%) (P < .0001). The proportion of FQ and ESC co-resistance was 13% over the study period. There was an increase in the proportion of isolates resistant to both ESCs and FQs in 2017 (14%), compared with 2013 (11%) (P < .0001; Figure 1). Concurrent resistance to ESCs, FQs, and AGs was 4% over the study period; this proportion was higher in 2017 (5%), compared with 2013 (4%) (P < .0001). Only 1% of the isolates were resistant to at least 1 carbapenem over the years studied.

Percentages of concurrent resistance to fluoroquinolones and to extended-spectrum cephalosporins among Escherichia coli isolates in United States hospitals by year, National Healthcare Safety Network, 2013–2017. Abbreviations: ESC_R, extended-spectrum cephalosporin resistant; ESC_S, extended-spectrum cephalosporin susceptible; FQ_R, fluoroquinolone resistant; FQ_S, fluoroquinolone susceptible.
Geographic Distribution of FQ and ESC Co-resistant E. coli Phenotypes and Distribution by HRR
When examining the ESC/FQ co-resistance rates by state, the highest prevalence (>13%) was seen in the Northeast (New York, New Jersey, Connecticut, and Massachusetts), as well as California, Nevada, Texas, Kentucky, Oklahoma, and Florida (Figure 2). When examining the data by HRR, the highest percentages are still seen in HRRs in some of the same states.

Escherichia coli isolates co-resistant to extended-spectrum cephalosporins and fluoroquinolones, National Healthcare Safety Network, 2013–2017.
Examining the mapped data by HRR overall and by individual year (2013 vs 2017; Figure 3), we can see that the number of HRRs in the higher quintiles increased in the more recent year from 2013 to 2017. The highest percentage of ESC/FQ co-resistant phenotypes was 33%, reported in Mesa, Arizona (in 2015) and Miami, Florida (in 2016). Ten HRRs were in the highest quintile for 5 consecutive years within the study period: Los Angeles, California, San Bernardino, California; San Diego, California; Fort Lauderdale, Florida; Miami, Florida; Dearborn, Michigan; New Brunswick, New Jersey; Bronx, New York; Manhattan, New York; and Houston, Texas; 3 other HRRs were in the highest quintile for 4 years of the study period: Modesto, California; East Long Island, New York; and El Paso, Texas.
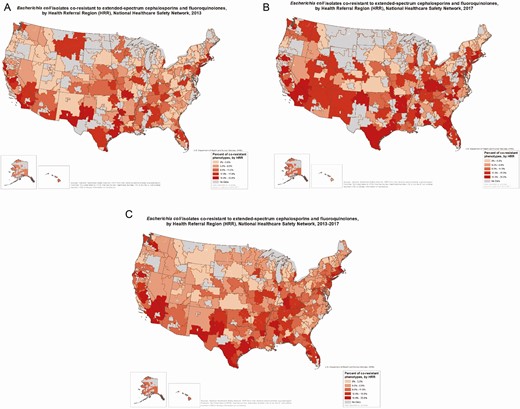
Escherichia coli isolates co-resistant to extended-spectrum cephalosporins and fluoroquinolones, by health referral region (HRR), National Healthcare Safety Network, in 2013–2017 (A), 2013 (B), and 2017 (C). “No data” refers to HRRs that had too few healthcare facilities (<5) or too few E. coli isolates reported (<20) to display information on resistance. Sources: National Healthcare Safety Network, United States Department of Health and Human Services; HRRs from http://archive.dartmouthatlas.org/data/region/.
HRRs with at least 20% co-resistant isolates in at least 2 consecutive years included Miami, Florida; Newark, New Jersey; Orange County, California; McAllen, Texas; San Diego, California; New York County, the Bronx, and East Long Island, New York; Tacoma, Washington; Dearborn, Michigan; and Modesto, California. Only Miami, Florida, had at least 20% co-resistant isolates in 5 consecutive years. Orange County, California, had at least 20% co-resistant isolates in 4 consecutive years.
Factors Associated With E. coli Resistance and With Co-resistance to >1 Antibiotic Class
We examined predictors of co-resistance phenotypes among E. coli using univariate and multivariate logistic regression (Tables 3 and 4, respectively). Factors significantly associated with concurrent ESC/FQ resistance among E. coli isolates were male sex (odds ratio [OR], 1.2 [95% confidence interval {CI}, 1.1–1.3]), CLABSI infection type (OR, 1.7 [95% CI, 1.6–1.9]), LTACH facility type (OR, 2.2 [95% CI, 2.0–2.4]), and more recent years (2016–2017), compared with earlier years (2013–2014) (OR, 1.3 [95% CI, 1.3–1.4]). Factors associated with concurrent resistance to ESCs/FQs/AGs were CLABSI (OR, 1.9 [95% CI, 1.7–2.1]) and LTACH (OR, 2.0 [95% CI, 1.7–2.3]). The same factors were also associated with resistance to carbapenems.
Distribution of Healthcare Facility and Patient Characteristics for Escherichia coli Isolates by Presence of Co-resistance to Fluoroquinolones and Extended-spectrum Cephalosporins—National Healthcare Safety Network, 2013–2017 (N = 96 672)
| Characteristics | Not Co-resistant to ESCs/FQs, No. (%) | Co-resistant to ESCs/FQs, No. (%) | P Value |
|---|---|---|---|
| Sex | <.0001 | ||
| Female | 51 320 (89) | 6669 (11) | |
| Male | 33 266 (86) | 5417 (14) | |
| Event type | <.0001 | ||
| CLABSI | 7874 (80) | 1993 (20) | |
| SSI | 30 201 (90) | 3233 (10) | |
| CAUTI | 45 766 (87) | 6719 (13) | |
| VAP | 745 (84) | 141 (16) | |
| Facility type | <.0001 | ||
| GACH | 75 513 (88) | 10 156 (12) | |
| LTACH | 3386 (74) | 1176 (26) | |
| IRF | 2257 (91) | 235 (9) | |
| Othera | 3430 (87) | 519 (13) | |
| Location typeb | <.0001 | ||
| Adult ICU | 25 674 (89) | 3143 (11) | |
| Adult ward | 28 288 (87) | 4201 (13) | |
| Adult oncology | 4200 (80) | 1067 (20) | |
| Pediataric ICU | 1568 (93) | 111 (7) | |
| Pediatric ward | 569 (92) | 48 (8) | |
| Event year | <.0001 | ||
| 2013 | 15 570 (89) | 1836 (11) | |
| 2014 | 16 526 (89) | 1995 (11) | |
| 2015 | 18 068 (87) | 2731 (13) | |
| 2016 | 17 594 (86) | 2795 (14) | |
| 2017 | 16 828 (86) | 2729 (14) | |
| Age group, y | <.0001 | ||
| 0–17 | 3294 (92) | 298 (8) | |
| 18–54 | 25 776 (89) | 3303 (11) | |
| 55–64 | 17 718 (87) | 2644 (13) | |
| 65–74 | 18 525 (86) | 2893 (14) | |
| ≥75 | 19 273 (87) | 2948 (13) | |
| Periodc | <.0001 | ||
| Early (2013–2014) | 32 096 (89) | 3831 (11) | |
| Late (2016–2017) | 34 422 (86) | 5524 (14) |
Abbreviations: CAUTI, catheter-associated urinary tract infection; CLABSI, central line–associated bloodstream infection; GACH, general acute care hospital; ICU, intensive care unit; IRF, inpatient rehabilitation facility; LTACH, long-term acute care hospital; SSI, surgical site infection; VAP, ventilator-associated pneumonia.
aIncludes critical access hospitals, children’s hospitals, military hospitals, oncology hospitals, women’s hospitals, women’s/children’s hospitals, orthopedic hospitals, psychiatric hospitals, surgical hospitals, and Veterans Administration medical centers.
bLTACHs and IRFs not included.
cDoes not include 2015.
Odds Ratios and 95% Confidence Intervals From Multivariate Logistic Regression Models Examining Associations Between Patient and Healthcare Facility Characteristics and Select Resistance Phenotypes of Escherichia coli Associated With Device- and Procedure-related Infections—National Healthcare Safety Network, 2013–2017
| Characteristic | ESC + FQ Resistance | ESC + FQ + AG Resistance |
|---|---|---|
| Facility type (ref: GACH) | ||
| IRF | 0.7 (.6–.9) | 0.7 (.6–1.0) |
| LTACH | 2.2 (2.0–2.4) | 2.0 (1.7–2.3) |
| Othera | 1.1 (1.0–1.2) | 1.1 (.9–1.3) |
| Sex (ref: female) | ||
| Male | 1.2 (1.2–1.3) | 1.2 (1.1–1.3) |
| HAI type (ref: CAUTI) | ||
| CLABSI | 1.7 (1.6–1.9) | 1.9 (1.7–2.1) |
| SSI | 0.8 (.7–.8) | 0.8 (.7–.9) |
| MVAE | 1.2 (1.0–1.5) | 1.5 (1.1–2.0) |
| Age group, y (ref: 0–17) | ||
| 18–54 | 1.9 (1.7–2.3) | 1.5 (1.2–1.9) |
| 55–64 | 2.2 (1.9–2.5) | 1.6 (1.2–2.0) |
| 65–74 | 2.2 (1.9–2.6) | 1.7 (1.4–2.2) |
| ≥75 | 2.3 (2.0–2.7) | 1.6 (1.3–2.0) |
| Time period (ref: 2013–2014) | ||
| 2016–2017 | 1.3 (1.3–1.4) | 1.2 (1.1–1.3) |
| Teaching status (ref: teaching) | ||
| Nonteachingb | 1.0 (1.0–1.1) | 1.0 (.9–1.1) |
Data are presented as odds ratio (95% confidence interval).
Abbreviations: AG, aminoglycoside; CAUTI, catheter-associated urinary tract infection; CLABSI, central line–associated bloodstream infection; ESC, extended-spectrum cephalosprin; FQ, fluoroquinolone; GACH, general acute care hospital; HAI, healthcare-associated infection; IRF, inpatient rehabilitation facility; LTACH, long-term acute care hospital; MVAE, mechanical ventilator–associated event; ref, reference group; SSI, surgical site infection.
aIncludes critical access hospitals, children’s hospitals, military hospitals, oncology hospitals, women’s hospitals, women’s/children’s hospitals, orthopedic hospitals, psychiatric hospitals, surgical hospitals, and Veterans Administration medical centers.
bApplies only to acute care hospitals.
DISCUSSION
Relative to the level in 2013 (11%), the prevalence of concurrent resistance to FQs and ESCs among E. coli isolates from device- and procedure-related HAIs increased by almost 27% to 14% in 2017. These findings concur with the increase in infections due to extended-spectrum β-lactamase–producing Enterobacteriaceae among hospitalized patients noted in the Centers for Disease Control and Prevention’s recently published Antibiotic Resistance Threat Report [14]. Of interest, in this study, relative to 2013 levels, the prevalence of ESC resistance alone increased 36% in 2017, whereas FQ resistance alone increased by only 3%, suggesting potential differences in the transmission of specific phenotypes, in the magnitude of specific ecologic pressures (ie, antibiotic use, as a result of antibiotic stewardship programs), or both. There was also an increase in other resistant phenotypes, such as co-resistance to ESCs/FQs/AGs. Our spatial analysis demonstrated marked heterogeneity in the prevalence and rate of increase in FQ and ESC co-resistance, again suggesting differences in transmission rates between hospital referral networks, differences in antibiotic use between networks, or both.
An important factor behind the increase in ESC and FQ co-resistance may be the clonal spread of E. coli sequence type (ST) 131, which has expanded in the US over the last decade [5, 15]. This multilocus sequence type is typically FQ resistant and also frequently (and increasingly) ESC resistant [5]. Reasons for the successful dissemination of ST131 subclones remain unclear but may include increased transmissibility, greater ability to colonize and/or persist in the intestine or urinary tract, enhanced virulence, or more extensive antimicrobial resistance compared to other E. coli strains. Of concern, ST131 strains are progressively gaining new resistance, including, most recently, those that express KPC-2 carbapenemase and NDM-1 metallo-β-lactamase [10], as well as acquiring resistance to AG [16]. A study from Canada showed that FQ-resistant E. coli isolates from urinary tract infections were frequently resistant to ampicillin and trimethoprim-sulfamethoxazole [17]; resistance to FQ was associated with multidrug resistance.
The FQ and ESC co-resistant phenotype was associated with CLABSI, male sex, and LTACH. This contrasts with the general distribution of E. coli pathogens among device- and procedure-related HAIs, which were most frequently reported from CAUTIs in acute care hospitals and among female patients. Other studies have also shown that ESC resistance in E. coli appears to be higher in blood, compared with urine isolates [18]. Recent studies have found that increases in E. coli bacteremia occurring after transrectal prostate biopsy were attributable to increases in FQ-resistant strains, commonly ST131 strains [19, 20]; such bacteremia was also more likely to require intensive care [20]. The high rate of bacteremia during periods of neutropenia in hematopoietic stem cell transplant recipients who received levofloxacin prophylaxis and were colonized with levofloxacin and ESC co-resistant Enterobacteriaceae also argues for increased risk of invasive bloodstream infections from such multiresistant strains [11]. Although the infection data presented here are from inpatient invasive device- or procedure-related infections, and reports of ESC/FQ co-resistant E. coli bacteremia prostate biopsies are predominantly in outpatients, these same underlying factors may be at play in our finding of a higher likelihood of E. coli resistance in CLABSI, as compared with CAUTI isolates among men.
Since resistance trends drive empiric antibiotic selection (for treatment or prophylaxis indications), our findings have important implications for clinical practice. Currently, FQs are frequently selected for empiric treatment of urinary tract infections in both outpatient and hospital settings [21]. The Infectious Diseases Society of America discourages use of antibiotics for empiric use if local resistance rates are greater than 10%–20% [22]. The proportion of FQ-resistant and ESC-resistant E. coli pathogens identified from HAIs in our study raises concerns about empiric use of such antibiotics to manage device- and procedure-related infections.
Displaying the spread of antibiotic resistance by HRR, compared to by state, allowed a finer scale visualization of how the distribution of co-resistant E. coli phenotypes changed over time. Between 2013 and 2017, there were increases in the number of HRRs in the higher ranges of ESC/FQ co-resistance in more recent years. In 2013, there were 8 HRRs with at least 20% of their isolates being co-resistant to ESC and FQ; in 2017 there were 34 such HRRs with at least 20% co-resistant isolates. Prevalence of co-resistance and increases noted over time were heterogeneously distributed across HRRs, with low-prevalence areas adjacent to high-prevalence areas, suggesting disparate introduction of such resistance into healthcare networks, dissemination via healthcare networks, or variation in other factors associated with resistance, such as different antibiotic use practices, or differences in the characteristics of the populations the networks serve (eg, particular HRRs may have more patients with international travel to and from particular geographic areas with high prevalence of antibiotic resistance).
Our study had several strengths. NHSN is the most widely used system of surveillance for HAIs in the US, and as such, is the most comprehensive source of national data on HAIs, as well as their associated pathogens and resistance patterns. A study limitation is the fact that we relied on resistance interpretation as entered into NHSN, rather than the actual minimal inhibitory concentration values, and we inferred susceptibilities for some isolates due to nontesting or suppression of susceptibility results. HAIs reporting mandates from the Centers for Medicare and Medicaid Services and state and local health departments vary by facility type and infection type, and have changed across the years included in this study. As such, the results used for this analysis may not be representative of all healthcare facilities and all HAIs for every year [23]. In addition, patient-level clinical information collected in NHSN is limited.
In conclusion, our analysis of E. coli co-resistance to 2 antibiotic classes (ESC and FQ) likely to be used as first-line agents against E. coli infections can provide a paradigm of an epidemiologic tool that could be useful for tracking spread of co-resistance and identifying areas of higher burden by geography or by patient referral patterns. Such tracking could also provide a way to better understand the epidemiology and movement of particular genetic lineages of microbial strains. Further characterization of co-resistance phenotypes with strain type, infection rates, and clinical outcomes may inform targeted prevention strategies for particular healthcare facilities/networks. Moreover, it can also encourage infection prevention specialists, as well as clinicians and others involved in antibiotic stewardship efforts, to help direct and monitor use of agents that are used as first-line agents for empiric treatment or prophylaxis.
Notes
Acknowledgments. The authors thank Dr Raymund Dantes for his helpful comments and review of the manuscript.
Disclaimer. The opinions presented in this article are those of the authors and do not necessarily reflect the official position of the Centers for Disease Control and Prevention.
Potential conflicts of interest. The authors: No reported conflicts of interest. All authors have submitted the ICMJE Form for Disclosure of Potential Conflicts of Interest.

