


Abstract
Noninfluenza respiratory viruses are responsible for a substantial burden of disease in the United States. Household transmission is thought to contribute significantly to subsequent transmission through the broader community. In the context of the coronavirus disease 2019 (COVID-19) pandemic, contactless surveillance methods are of particular importance.
From November 2019 to April 2020, 303 households in the Seattle area were remotely monitored in a prospective longitudinal study for symptoms of respiratory viral illness. Enrolled participants reported weekly symptoms and submitted respiratory samples by mail in the event of an acute respiratory illness (ARI). Specimens were tested for 14 viruses, including severe acute respiratory syndrome coronavirus 2 (SARS-CoV-2), using reverse-transcription polymerase chain reaction. Participants completed all study procedures at home without physical contact with research staff.
In total, 1171 unique participants in 303 households were monitored for ARI. Of participating households, 128 (42%) included a child aged <5 years and 202 (67%) included a child aged 5–12 years. Of the 678 swabs collected during the surveillance period, 237 (35%) tested positive for 1 or more noninfluenza respiratory viruses. Rhinovirus, common human coronaviruses, and respiratory syncytial virus were the most common. Four cases of SARS-CoV-2 were detected in 3 households.
This study highlights the circulation of respiratory viruses within households during the winter months during the emergence of the SARS-CoV-2 pandemic. Contactless methods of recruitment, enrollment, and sample collection were utilized throughout this study and demonstrate the feasibility of home-based, remote monitoring for respiratory infections.
Respiratory viruses cause notable rates of morbidity and mortality in the United States, especially among young children, the elderly, or immunocompromised persons [1]. Respiratory syncytial virus (RSV), parainfluenza viruses (PIVs), human metapneumovirus (hMPV), human rhinovirus (hRV), human coronaviruses (hCoVs), and adenovirus (AdV) often co-circulate with influenza viruses in the winter months and can cause acute respiratory illness (ARI) and lower respiratory tract infections (LRTIs) [1–3]. Globally, LRTIs are estimated to cause 2.3 million deaths annually [3]. In the United States, an estimated 500 million noninfluenza viral respiratory infections occur annually [1]. However, most ARI surveillance is based on reports of outpatient visits, emergency department visits, or hospitalizations, which may underestimate disease incidence [4–6].
Prospective household cohort studies are useful to study incidence of illness in the community across a range of age groups and identify chains of transmission between household contacts [7, 8]. Households are an important setting for the spread of respiratory viruses between individuals and may play a role in community transmission [7–11]. Household study platforms can be expanded to study severe acute respiratory syndrome coronavirus 2 (SARS-CoV-2) spread, based on preliminary data showing viral transmission among household contacts [12, 13]. Contactless surveillance methods are of particular interest in context of the coronavirus disease 2019 (COVID-19) pandemic.
Using online contactless recruitment, enrollment, and surveillance, we conducted a longitudinal prospective cohort study of ARI in households of 3 or more individuals with at least 1 child from November 2019 to April 2020. The aims are to describe household-level risk factors for respiratory viral infections, estimate the incidence of primary and secondary infections for noninfluenza viral pathogens in households, and examine the association between upper respiratory virus levels in primary cases and incidence of secondary infections in household contacts.
MATERIALS AND METHODS
Study Design
A prospective longitudinal cohort study of children and their households was implemented in the Seattle metropolitan area from November 2019 to April 2020 as a part of the Seattle Flu Study [14]. Households were recruited at the beginning of the school year and remotely monitored weekly from 14 November 2019 until 1 April 2020, for symptoms of respiratory illness. Recruitment took place at elementary and middle schools beginning in September, and households continued to participate after the school district’s closure on 11 March 2020. Participating schools advertised the study to families through social media, newsletters, posters on campus, and after-school events. Eligible households consisted of 3 or more individuals sleeping in the home for ≥4 days per week, with at least 1 adult English speaker and 1 child (aged 3 months through 17 years). Individuals in enrolled households were permitted to opt out of participation if the remaining household members met eligibility criteria. Interested households completed an online screening questionnaire before informed consent took place over the phone between at least 1 adult household member and a research team member. Other adults and children in the household were then prompted to review and complete their documentation of consent through a web-based platform. Children aged 7–17 years provided electronic assent alongside a parent or guardian’s consent.
This study was approved by the University of Washington Institutional Review Board. Upon completion of the informed consent process, households answered demographic questions in an online questionnaire before receiving midturbinate nasal swabs (Copan Diagnostics, Murietta, California), collection tubes with universal transport medium (BD, Franklin Lakes, New Jersey), instructions, and return shipping materials in the mail. One adult was designated as the household reporter and was contacted weekly by text message and/or email to complete a symptom log each week on behalf of all household participants. Additions to households during the study were identified through monthly questionnaires and were invited to enroll and participate in the study. The study procedures did not require any physical contact between participants and researchers.
The study population included a subset of households enrolled in an interventional study focused on home-based diagnosis and treatment of influenza; detailed methods for the intervention study are registered with ClinicalTrials.gov (identifier NCT04141930). This analysis includes observational data on the noninfluenza respiratory viruses detected in all households. Data on influenza viruses in households will be reported separately.
Data Collection
After consent and enrollment, each participant was asked to collect a midturbinate nasal swab in the event of an ARI reported in the weekly symptom log as early as possible and within 72 hours of illness onset. Samples collected beyond 72 hours after illness onset were excluded from analysis. For children aged <13 years, a parent or guardian was advised to assist with swab collection and shipping. Home-collected nasal swabs were mailed at ambient temperature to the Northwest Genomics Center at the University of Washington via United States Postal Service following standard International Air Transport Association shipping procedures, with a median shipping time of 2 days. If a participant experienced ARI, defined as either acute cough or ≥2 concurrent symptoms (see Supplementary Appendix A for a complete list of qualifying symptoms) with symptom onset within 72 hours, or 48 hours in the interventional subset, the household reporter was prompted to fill out a clinical illness questionnaire. One week following specimen collection, participants were sent a follow-up questionnaire to collect information about illness progression and its effects on healthcare-seeking behavior, school/work attendance, and travel. If a participant experienced multiple illness episodes during the study period, these procedures were repeated. Reminders to complete questionnaires and collect swabs when prompted were delivered by automated messages and by personalized emails and phone calls from the study team. Study data were collected remotely via online questionnaires and entered and managed using Project REDCap (Research Electronic Data Capture) [15].
Laboratory Testing
Samples were mailed in universal transport medium at ambient temperature and aliquoted and stored at 4°C prior to testing. Upon receipt, samples were tested within approximately 7 days. Total nucleic acid was extracted using the Magnapure 96 platform (Roche) and tested for the presence of 24 respiratory pathogens (see Supplementary Appendix B for a list of tested pathogens) by TaqMan reverse-transcription polymerase chain reaction (RT-PCR) on OpenArray [16]. Assay methods and definitions of positive results are described in Supplementary Appendix D.
Data Analysis
To assess household-level risk factors for respiratory viral infection, demographic characteristics of participating households were compared using χ 2 tests or 2-sided t tests assuming independent variances between those with and those without at least 1 positive test result for a respiratory viral infection. P values of <.05 were considered statistically significant. We restricted this analysis to households submitting at least 1 weekly symptom log prior to 1 April 2020. Participants were required to experience at least 7 days without symptoms before being eligible to record another illness episode and submit another specimen.
A primary case was defined as an ARI episode with a respiratory virus detected preceded by 14 days without the same virus identified in the household. Cases that occurred in 1 household with the same day of symptom onset were defined as co-primary. Pathogens analyzed included RSV subtypes A and B, PIV types 1–4, hMPV, hRV, hCoVs (HKU1, NL63, 229E, and OC43), AdV, human bocavirus, and SARS-CoV-2. SARS-CoV-2 testing was added 25 February 2020, including testing of samples collected after 1 January 2020. The person-time at risk was defined as the total number of surveillance weeks multiplied by the number of people in the household. Surveillance was defined as the period between each household’s first symptom log and either 1 April or date of their final symptom log. A secondary case was defined as identification of a virus preceded by an illness in a household member with the same virus within 14 days. Person-time at risk for each secondary case was defined as the 14 days following illness onset for the primary case. Incidence rates were calculated with Poisson models, with an offset of log days at risk. Confidence intervals were based on a robust variance adjusted for clustering by household.
Upper respiratory viral levels were evaluated using evaluated using cycle relative threshold (Crt) values from RT-PCR testing. Viral levels were compared between primary cases with and without an associated secondary case. Data analyses were performed using R version 4.0.0 (R Foundation for Statistical Computing) in RStudio Version 1.2.5042 (RStudio, Inc).
RESULTS
Between 1 November 2019 and 1 April 2020, 351 households were enrolled with a median household size of 4 individuals (range, 3–7); 303 completed at least 1 weekly symptom log in this time frame and were included in this analysis. The average weekly symptom log completion rate was 87%. Among participating households, 128 (42%) included a child aged <5 years, 202 (67%) included a child aged 5–12 years, and 64 (21%) included children in both age groups; 194 (64%) contained 1 or more children in elementary school, and 155 (51%) contained 1 or more children who attended childcare. Only 15 (5%) households included individuals aged ≥65 years (Table 1).
Demographic Characteristics of Households Enrolled in the Seattle Area Between November 2019 and April 2020 With and Without Laboratory-Confirmed Cases of Noninfluenza Respiratory Viral Infection
| Total | Households With No Eligible Respiratory Viral Infection | At Least 1 Confirmed Respiratory Viral Infectiona | ||
|---|---|---|---|---|
| Characteristic | (N = 303) | (n = 118) | (n = 185) | P Valueb |
| Households with: | ||||
| Children <5 y | 128 (42) | 31 (26) | 97 (52) | <.001 |
| Children 5–12 y | 202 (67) | 76 (64) | 126 (68) | .716 |
| Children 13–17 y | 64 (21) | 39 (33) | 25 (14) | <.001 |
| Individuals 18–49 y | 280 (92) | 101 (86) | 179 (97) | .002 |
| Individuals 50–64 y | 62 (20) | 39 (33) | 23 (12) | <.001 |
| Individuals ≥65 y | 15 (5) | 4 (3) | 11 (6) | .466 |
| Household size, median (IQR) | 4 (3–4) | 4 (3–4) | 4 (3–4) | .461 |
| All eligible members vaccinated for seasonal influenzac | 192 (63) | 74 (63) | 118 (64) | .947 |
| Household income | .85 | |||
| <$50 000 | 6 (2) | 3 (3) | 3 (2) | |
| $50 000–$100 000 | 44 (15) | 15 (13) | 29 (16) | |
| $100 001–$150 000 | 51 (17) | 20 (17) | 31 (17) | |
| >$150 000 | 174 (57) | 70 (59) | 104 (56) | |
| ≥1 tobacco smoker or e-cigarette user in the home | 8 (3) | 3 (3) | 5 (3) | 1.00 |
| ≥1 individual with history of comorbid condition(s) | ||||
| Asthma | 89 (29) | 36 (31) | 53 (29) | .828 |
| Chronic bronchitis or COPD | 6 (2) | 2 (2) | 4 (2) | .903 |
| Cancer | 20 (7) | 9 (8) | 11 (6) | .736 |
| Diabetes | 7 (2) | 4 (3) | 3 (2) | 1.00 |
| Heart disease | 6 (2) | 2 (2) | 4 (2) | 1.00 |
Data are presented as No. (%) unless otherwise indicated.
Abbreviations: COPD, chronic obstructive pulmonary disease; IQR, interquartile range.
aConfirmed viral infection includes the viruses examined in this analysis: respiratory syncytial virus, parainfluenza virus types 1–4, human metapneumovirus, human rhinovirus, human coronavirus, adenovirus, human bocavirus, and severe acute respiratory syndrome coronavirus 2. Influenza cases are included in the “no eligible infection” column.
bP values generated by χ 2 tests or independent 2-sided t tests.
cIncludes those aged 6 months and older.
This cohort included 1171 unique individuals, and over the study period, 213 households (70%) submitted at least 1 nasal swab during the surveillance period (Figure 1). In total, 678 samples were collected from 477 unique individuals. Laboratory-confirmed noninfluenza virus infection was detected in 185 of 303 (61%) of included households, and in 185 of 213 (87%) of households collecting at least 1 sample. A higher proportion of households with noninfluenza viral infection (52%) included at least 1 child aged <5 years compared to only 25% of households without laboratory-confirmed respiratory virus infection (P < .001). Households without confirmed respiratory virus infection more frequently included a child aged 13–17 years (P < .001) or an individual aged 50–64 years (P < .001). A median of 2 swabs were collected per household.
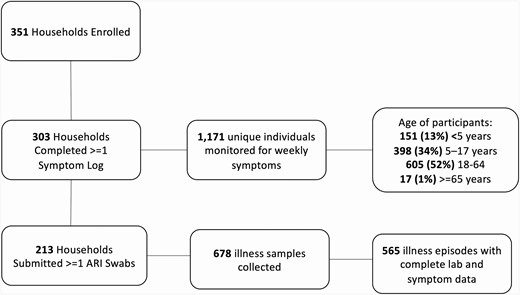
Number of households and individuals completing the various steps of study procedures. Abbreviation: ARI, acute respiratory illness.
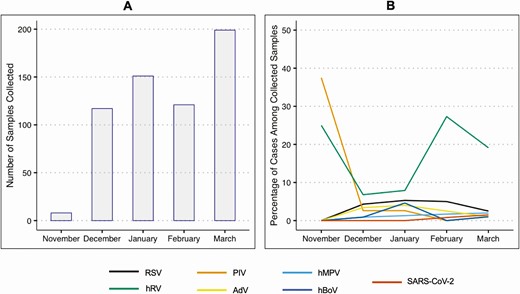
Influenza virus was detected in 67 of 678 (10%) samples; these samples were excluded from this analysis, including those with detected coinfections. Of the 611 swabs received during the surveillance period from 434 unique individuals who did not test positive for influenza virus, 237 (39%) tested positive for 1 or more respiratory viruses (Table 2). The most common viruses detected were hRV (86 cases), hCoV (65 cases), and RSV (19 cases). Coinfection with 2 viruses was detected in 30 samples (Supplementary Appendix C), most frequently in children aged <5 years. SARS-CoV-2 was detected in 4 cases in 3 households. Seeking medical care for symptoms was reported in either the illness questionnaire or at 1-week follow-up in 72 (12%) of all illness episodes with complete survey data. Most samples were collected in the months of February and March, possibly due to the increased awareness of respiratory symptoms during the start of the COVID-19 pandemic. The monthly frequency of virus detection differed by organism (Figure 2).
Cases of Acute Respiratory Illnesses in Seattle Households by Age, Positive Polymerase Chain Reaction Test Result, and Illness Characteristics Between November 2019 and April 2020
| All Samplesa | No Virus Detected | Cases (%) by Positive PCR Test Result | |||||||||
|---|---|---|---|---|---|---|---|---|---|---|---|
| Characteristic | (N = 611) | (n = 374) | RSV (n = 19) | PIV 1–4 (n = 12) | hMPV (n = 7) | hRV (n = 86) | hCoV (n = 65) | AdV (n = 10) | hBoV (n = 4) | SARS-CoV-2 (n = 4) | Coinfection (n = 30) |
| Age group | |||||||||||
| <5 y | 85 (14) | 23 (6) | 4 (21) | 3 (25) | 2 (29) | 20 (23) | 9 (14) | 4 (40) | 1 (25) | 0 (0) | 19 (63) |
| 5–17 y | 175 (29) | 104 (28) | 6 (32) | 2 (17) | 2 (29) | 32 (37) | 19 (29) | 2 (20) | 1 (25) | 0 (0) | 7 (22) |
| 18–64 y | 346 (57) | 244 (65) | 9 (47) | 7 (58) | 3 (43) | 33 (38) | 36 (55) | 4 (40) | 2 (50) | 4 (100) | 4 (16) |
| ≥65 y | 5 (1) | 3 (1) | 0 (0) | 0 (0) | 0 (0) | 1 (1) | 1 (2) | 0 (0) | 0 (0) | 0 (0) | 0 (0) |
| Sought medical careb | 72 (12) | 44 (12) | 6 (32) | 0 (0) | 3 (43) | 7 (8) | 7 (11) | 2 (20) | 0 (0) | NA | 3 (10) |
| Absent from work or schoolb (n = 421) | 155 (25) | 92 (25) | 8 (42) | 3 (25) | 4 (57) | 20 (23) | 15 (23) | 1 (10) | 1 (25) | NA | 11 (37) |
Data are presented as No. (%). Instances where the same virus with the same symptom onset date was detected in a household are listed as 2 co-primary infections.
Abbreviations: AdV, adenovirus; hBoV, human bocavirus; hCoV, human coronavirus (HKU1, NL63, 229E, and OC43); hMPV, human metapneumovirus; hRV, human rhinovirus; NA, not applicable; PCR, polymerase chain reaction; PIV 1–4, parainfluenza virus types 1–4; RSV, respiratory syncytial virus (types A and B); SARS-CoV-2, severe acute respiratory syndrome coronavirus 2.
aIncludes all samples received during the surveillance period, minus the samples that tested positive for influenza.
bSeeking medical care and absenteeism were missing for 106 (17%) illness episodes. Both of these variables were missing for all cases of SARS-CoV-2 infection.
A, Number of illness samples collected from participants between November 2019 and March 2020. B, Percentage of positive samples detected of different viruses out of the number of samples collected each month. Line color coded by virus type. Cases of coinfection are included twice, once per virus detected. Abbreviations: AdV, adenovirus; hBoV, human bocavirus; hMPV, human metapneumovirus; hRV, human rhinovirus; PIV 1–4, parainfluenza virus types 1–4; RSV, respiratory syncytial virus (types A and B); SARS-CoV-2, severe acute respiratory syndrome coronavirus 2.
The highest primary incidence rates in this cohort were found with hRV (21.7 primary cases per 100 person-years) and hCoV (19.3 primary cases per 100 person-years; Table 3). SARS-CoV-2 had a primary incidence rate of 1.4 (95% confidence interval, .8–2.4) cases per 100 person-years. Secondary cases were detected among hMPV infections (2 of 6) and SARS-CoV-2 infections (1 of 3) where 33% index cases were associated with a secondary case, and in RSV infections where 28% of index cases were associated with a secondary case (Table 3). Of 197 primary cases, 53 (27%) were among children aged <5 years, 63 (32%) among those aged 5–17 years, 77 (39%) among those aged 18–64 years, and 2 (1%) among those aged ≥65 years.
Estimated Incidence Rates of Primary and Secondary Cases of 8 Different Viruses Detected Among Seattle Households Between November 2019 and April 2020
| Cases | RSV | PIV 1–4 | hMPV | hRV | hCoV | AdV | hBoV | SARS-CoV-2 |
|---|---|---|---|---|---|---|---|---|
| Primary cases | 18 | 10 | 6 | 73 | 64 | 13 | 10 | 3 |
| Primary incidence rate per 100 PY (95% CI) | 5.4 (3.4–8.6) | 3.0 (1.6–5.6) | 1.8 (.8–4.0) | 21.7 (17.3–27.4) | 19.3 (15.1–24.7) | 4.2 (2.5–7.1) | 3.0 (1.6–5.6) | 1.4 (.8–2.4) |
| Secondary casesa (% of primary) | 5 (28) | 0 (0) | 2 (33) | 19 (26) | 8 (12) | 2 (15) | 0 (0) | 1 (33) |
| Epidemiologic secondary incidence per 100 PY (95% CI) | 79.5 (62.2–102) | 0 | 45.8 (35.8–58.4) | 302 (237–386) | 127 (99.6–163) | 31.8 (24.9–40.6) | 0 | 18.7 (15.1–22.9) |
Instances where the same pathogen with the same symptom onset date were detected in a household are listed in 2 co-primary infections. Coinfections are listed in 2 columns: 1 per virus type.
Abbreviations: AdV, adenovirus; CI, confidence interval; hBoV, human bocavirus; hCoV, human coronavirus (HKU1, NL63, 229E, and OC43); hMPV, human metapneumovirus; hRV, human rhinovirus; PIV 1–4, parainfluenza virus types 1–4; PY, person-years; RSV, respiratory syncytial virus (types A and B); SARS-CoV-2, severe acute respiratory syndrome coronavirus 2.
aSecondary case defined as another instance of the same virus type in the household in the 14 days following a primary infection.
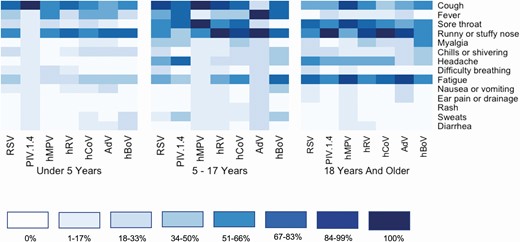
Symptom data were reported for 209 samples of noninfluenza laboratory-confirmed respiratory viral infections. Heat maps of the symptoms reported on the day of sample collection are shown stratified by age group in Figure 3. Cough and runny nose were reported frequently across viruses and age groups, whereas fever was reported less frequently among those aged ≥18 years.
Symptom profiles of respiratory viral illnesses stratified by age group. Includes 209 samples of noninfluenza respiratory viral infection where symptoms were recorded. Darker colors indicate a higher percentage of infected individuals of the specific virus type reporting the symptom. Thirty cases of coinfection are excluded from this figure. Abbreviations: AdV, adenovirus; hBoV, human bocavirus; hCoV, human coronavirus; hMPV, human metapneumovirus; hRV, human rhinovirus; PIV 1–4, parainfluenza virus types 1–4; RSV, respiratory syncytial virus (types A and B).
Crt values between index cases with and without an associated secondary household case did not differ significantly (P > .05, Supplementary Appendix E). Crt values between index and secondary cases are reported in Supplementary Appendix F. RSV secondary cases reported the shortest period of time between primary and secondary cases (2.6 days), and AdV cases experienced the longest time (12.1 days). One secondary case of SARS-CoV-2 was recorded. Further information about the ages of individuals with primary infections and the age groups of transmission events can be found in Supplementary Appendices G and H.
DISCUSSION
This study describes results from a contactless research approach that did not involve in-person interactions between study staff and household members to detect circulating noninfluenza respiratory viruses within households during the winter of the emergence of SARS-CoV-2. The presence of young children was a household-level risk factor for viral infection, as expected. Of the 303 households included, 185 (61%) had at least 1 case of respiratory viral infection between 14 November 2019 and 1 April 2020, most of which were from hRV, hCoV, and RSV [12, 17]. Four cases of SARS-CoV-2 were detected among 3 participating households, all in adults, with 1 case of possible transmission between household members. This study design may be useful to capture additional cases of SARS-CoV-2 in future efforts.
This design permitted detection of symptomatic respiratory viral infection without direct contact between participants and researchers. Online enrollment, symptom monitoring via email or text messaging, home-collected swabs, and electronic illness questionnaires allowed this study to be conducted with minimal inconvenience and risk of exposure to participating households. Households could receive weekly symptom log reminders via email or text messages, which previous research has shown to be an effective mechanism for rapid, home-based detection of ARI [10]. Social distancing has become a necessary component of further research on SARS-CoV-2 transmission, and this remote study design provides a safe mechanism for investigation.
The presence of children <5 years old was a predictor of noninfluenza virus detection in a household [18, 19]. More than half of households with at least 1 confirmed infection had a child aged <5 years, compared to only 26% of those without a noninfluenza viral infection (P < .001). However, the presence of a child aged 13–17 years old was negatively correlated with infection, with 33% of households without viral infection containing a child in this age range compared to 14% of households with at least 1 infection. Families with adolescent children may be less likely to also include a younger child. A higher proportion of households with an infection than those without infection included adults aged 18–49 years, whereas more households with adults aged 50–64 years had no cases of viral infection. This may be due to younger adults being more likely to have children <5 years of age.
A majority of recorded illness episodes were not medically attended, confirming another cohort study where only 17% of influenza cases were medically attended [20]. Noninfluenza viruses were responsible for 34% of illness samples, and only 12% of these cases were medically attended. hRV and hCoV cases alone accounted for a majority of positive swabs. These findings align with other prospective cohort studies in children and adults, where hRV and hCoV were detected at greater frequency in the community than in hospital-based ARI studies [21–23]. Additionally, these results show a majority of coinfection cases and AdV cases occurring in children younger than 5 years, a majority of PIV cases in children 5–17 years, and the remaining organisms predominating in adults 18–64 years old, although sample sizes are small after stratifying by virus type and age group. Overall, children aged <5 years had the highest percentage positivity rate (70%). These findings are comparable to previous household studies conducted in the United States [8, 24].
The relative thresholds (Crt values) of primary cases did not differ significantly between the primary cases that were and were not associated with a secondary infection. Possible explanations for this finding include that Crt values may not be a direct quantitative measure of viral load. Additionally, due to the 72-hour window of eligibility to collect swabs and variation in home-swab collection among individuals, specimen collections likely varied among samples included in this analysis. Finally, given the broad time frame under which a case may be considered a secondary case, it is possible that some secondary cases became infected from sources outside of the household.
There are several limitations to this study. First, participants were instructed to self-collect a nasal swab in the event of an ARI. While this approach allows for more complete capture of respiratory pathogens with limited inconvenience to participants, it allows for some uncertainty in validity of the reported symptoms, as well as uncertainty due to potential inconsistency of at-home specimen collection. Additionally, this approach did not capture asymptomatic cases during the surveillance period and may have resulted in an underestimation of the incidence of the viruses analyzed. The rarity of smokers and high rates of influenza immunization, the exclusion of non-English speakers, the low enrollment of individuals older than 65 years, and the number of households with an annual income greater than $150 000 indicate that this study population may not be representative of the Seattle area [25, 26]. Another limitation is absence of clinical data for some cases of illness. Households occasionally mailed a swab to the laboratory without filling out the corresponding illness questionnaire (n = 74). While these events were infrequent, they unfortunately included all 4 of the SARS-CoV-2 cases detected in this population, so our ability to describe these cases is limited. In our statistical analysis, we included weeks between first and last symptom log for each household within the study period to be time at risk. This includes time in which no symptom logs were submitted, potentially lowering the primary incidence rates. Finally, the study includes time before and after the COVID-19 pandemic, and illness reporting and care-seeking behavior likely changed over the study period.
This study demonstrates the feasibility of home-based, longitudinal monitoring of respiratory viral illness in households with children. Conducting remote, prospective surveillance for detection of respiratory viral infections may be especially important during the COVID-19 pandemic when in-person monitoring may compromise the safety of researchers and participants. Remote, longitudinal surveillance of households may also provide further insight into signs and symptoms of non–medically attended SARS-CoV-2 infection. This prospective observational study of households over a single season demonstrates the incidence of a variety of respiratory illnesses commonly not receiving medical attention, emphasizing the household as an important setting for viral surveillance.
Supplementary Data
Supplementary materials are available at Clinical Infectious Diseases online. Consisting of data provided by the authors to benefit the reader, the posted materials are not copyedited and are the sole responsibility of the authors, so questions or comments should be addressed to the corresponding author.
Notes
Acknowledgments. The authors deeply appreciate the time and efforts of all household volunteers, along with our school partners who assisted with recruitment.
Disclaimer. The funders were not involved in the design of the study and do not have any ownership over the management and conduct of the study, the data, or the rights to publish. The findings and conclusions in this report are those of the authors and do not necessarily represent the official position of the Centers for Disease Control and Prevention.
Financial support. This work was supported by Gates Ventures and by the Seattle Flu Study team. REDCap at the Institute of Translational Health Sciences is supported by the National Center for Advancing Translational Sciences of the National Institutes of Health (award number UL1 TR002319).
Potential conflicts of interest. H. Y. C. has received research support from GlaxoSmithKline, Novavax, and Sanofi Pasteur, and personal fees from Sanofi Pasteur. J. A. E. has received research support from Gilead, Chimerix, GlaxoSmithKline, Merck, Novavax, and AstraZeneca; has received personal fees from Meissa Vaccines, and has served as a consultant for Sanofi Pasteur and Gilead. All other authors report no potential conflicts of interest.
All authors have submitted the ICMJE Form for Disclosure of Potential Conflicts of Interest. Conflicts that the editors consider relevant to the content of the manuscript have been disclosed.

