


Abstract
Vaccine-induced neutralizing antibodies are key in combating the coronavirus disease 2019 (COVID-19) pandemic. However, delays of boost immunization due to limited availability of vaccines may leave individuals vulnerable to infection and prolonged or severe disease courses. The emergence of severe acute respiratory syndrome coronavirus 2 (SARS-CoV-2) variants of concern (VOC)—B.1.1.7 (United Kingdom), B.1.351 (South Africa), and P.1 (Brazil)—may exacerbate this issue, as the latter two are able to evade control by antibodies.
We assessed humoral and T-cell responses against SARS-CoV-2 wild-type (WT), VOC, and endemic human coronaviruses (hCoVs) that were induced after single and double vaccination with BNT162b2.
Despite readily detectable immunoglobulin G (IgG) against the receptor-binding domain of the SARS-CoV-2 S protein at day 14 after a single vaccination, inhibition of SARS-CoV-2 S-driven host cell entry was weak and particularly low for the B.1.351 variant. Frequencies of SARS-CoV-2 WT and VOC-specific T cells were low in many vaccinees after application of a single dose and influenced by immunity against endemic hCoV. The second vaccination significantly boosted T-cell frequencies reactive for WT and B.1.1.7 and B.1.351 variants.
These results call into question whether neutralizing antibodies significantly contribute to protection against COVID-19 upon single vaccination and suggest that cellular immunity is central for the early defenses against COVID-19.
Several vaccines encoding the viral spike (S) protein have been approved to combat the coronavirus disease 2019 (COVID-19) pandemic [1–3]. The recent emergence of the severe acute respiratory syndrome coronavirus 2 (SARS-CoV-2) variants of concern (VOC)—B.1.1.7 in the United Kingdom (UK), B.1.351 in South Africa, and P.1 in Brazil—may threaten measures to control the COVID-19 pandemic due to their ease of transmission [4, 5] and, in the case of variants B.1.351 and P.1, resistance to neutralization by monoclonal antibodies and partial resistance to neutralization by antibodies induced upon infection and vaccination [6–10].
Results from clinical trials and real-world data suggest that vaccine protection against COVID-19 begins around 2 weeks after the first vaccine dose [1, 2, 11, 12]. However, only modest neutralization activity of sera was observed shortly before the second vaccine administration, and robust increase in neutralizing antibody titers required a second boosting dose [13, 14]. Due to the accelerating pandemic and the associated need to provide at least partial protection at the population level, the UK Joint Committee on Vaccines and Immunization has proposed extending the time to the second vaccine dose to enable first vaccination of more individuals within a short time period [15].
However, delaying time until second vaccination may lead to a sizable population of vaccinees with incomplete or short-lived anti–SARS-CoV-2 immunity, and this approach may favor the emergence of escape variants. To address this question, we analyzed cellular and humoral immune responses induced by a single-dose vaccination of the messenger RNA (mRNA) vaccine BNT162b2. We also determined the impact of preexisting immunity against human coronavirus (hCoV) on the vaccine response.
MATERIALS AND METHODS
The study was approved by the Internal Review Board of Hannover Medical School (MHH, approval numbers 3639_2017, 8973_BO-K_2020, 9226_BO_K_2020, 9255_BO_K_2020, and 9459_BO_K_2020) and University Medicine Göttingen (approval number SeptImmun Study 25/4/19 Ü). Following written informed consent, peripheral blood samples were obtained by venipuncture. Vaccinees for this analysis were healthcare professionals enrolled into the CoCo Study in 2020 before vaccination (Table 1) for detecting silent seroconversions against SARS-CoV-2 infection [16]. Individuals with previous polymerase chain reaction (PCR)–confirmed SARS-CoV-2 infection or SARS-CoV-2 seroconversion before vaccination were excluded from this analysis. Blood samples from individuals vaccinated with the BioNTech/Pfizer vaccine BNT162b2 were obtained at a mean of 17.6 days (range, 2–27 days) after the first dose and a mean of 21 days (range, 6–36 days) after the second dose. Characteristic for convalescent COVID-19 patients with reverse-transcription PCR (RT-PCR)–confirmed SARS-CoV-2 infection before the occurrence of VOC in Germany are summarized in Table 1. After blood collection, we obtained plasma from ethylenediaminetetraacetic acid or lithium heparin blood (S-Monovette, Sarstedt) and stored it at –80°C until use. Peripheral blood mononuclear cells (PBMCs) were isolated from whole blood samples by Ficoll gradient centrifugation and stored in liquid nitrogen until use. For virus neutralization assays, we incubated plasma samples at 56°C for 30 minutes to inactivate putative infectious virus.
Characteristics of Convalescent Coronavirus Disease 2019 Patients and BNT162b2 Vaccinees
| COVID-19 Severity | |||||||
|---|---|---|---|---|---|---|---|
| No. of Patients | Mean Age, y (Range) | Sex, Male/Female | Mean Weeks Since Diagnosis (Range) | Outpatient | Hospitalized | ICU | Figure |
| Convalescent COVID-19 patients | |||||||
| 37 | 41 (19–74) | 13/24 | 9.03 (3–38) | 33 | 1 | 3 | Figure 1 |
| 26 | 37 (19–57) | 10/16 | 8.5 (3–36) | 25 | 1 | 0 | Figure 3ASupplementary Figure 3 |
| 20 | 54 (20–84)a | 12/8 | 10.1 (7–14) | 4 | 9 | 7 | Figure 4A |
| BNT162b2 vaccinees | |||||||
| 148 | 40.6 (22–66) | 63/85 | NA | NA | NA | NA | … |
Abbreviations: COVID-19, coronavirus disease 2019; ICU, intensive care unit; NA, not applicable.
aP < .001, analysis of variance (with Bonferroni post hoc analysis) compared to the other convalescent COVID-19 patients and the vaccinees. No significant differences for age or sex between the groups.
SEROLOGY
SARS-CoV-2 immunoglobulin G (IgG) serology was performed by quantitative enzyme-linked immunosorbent assay (anti–SARS-CoV-2 S1 spike protein domain/receptor-binding domain [RBD] IgG SARS-CoV-2 QuantiVac, Euroimmun, Lübeck, Germany) in all individuals according to the manufacturer’s instructions (dilution 1:400). Antibody levels are expressed as relative units (RU)/mL assessed from a calibration curve, with values >11 RU/mL defined as positive. Anti–SARS-CoV-2 S1 spike protein domain immunoglobulin A (IgA) (Euroimmun) was done according to the manufacturer’s instructions. Antibody amounts are expressed as IgA ratio (optical density divided by calibrator). The cPass Neutralization Antibody Detection kit (GenScript) was used to detect circulating neutralizing antibodies against SARS-CoV-2 that block the interaction between the RBD of the viral spike glycoprotein with the angiotensin-converting enzyme 2 (ACE2) cell surface receptor. For additional information of viral entry inhibition assays and detection of interferon gamma (IFN-γ) release of SARS-CoV-2 S–responsive T cells, see the Supplementary Data.
STATISTICAL ANALYSIS
Data are presented as single results where possible with median of groups depicted as lines. Alternatively, data are depicted as mean ± standard deviation. Comparisons between groups were performed by 2-sided unpaired or paired Studient’s t test, analysis of variance with Bonferroni post hoc analysis, Kruskal-Wallis test, or Fisher exact test, where appropriate. Statistical analysis was performed by GraphPad Prism version 5.01 software, which was also used for data illustration. A P value of < .05 was considered significant.
RESULTS
Anti–SARS-CoV-2 S IgG and IgA levels were determined in individuals early (mean, 8.7 days [range, 2–14 days]) and late (mean, 20.6 days [range, 17–27 days]) after immunization with a single 30-µg dose of BNT162b2 (n = 124). In addition, samples obtained at a mean of 21 days (range, 6–36 days) after a second 30-µg dose (n = 69) were analyzed. Antibodies of the IgG subtype directed against the S1 subunit of SARS-CoV-2 S became detectable around day 14 after the first shot. Almost all participants had measurable IgG levels 17 days after the first BNT162b2 dose and higher IgG levels after the second shot as compared to convalescent COVID-19 patients after mild disease (Figure 1A and 1B). Anti–SARS-CoV-2 IgA was detectable in most individuals at a mean of 20.2 days (range, 19–25 days) after the first vaccination, with further increase after the booster (Figure 1C). The magnitude of the anti–SARS-CoV-2 S IgG antibody response was significantly higher 21 days after the second BNT162b2 dose and higher than that in convalescent COVID-19 patients after mild disease (Figure 1B). Restricting the analysis on intra-individual responses over time gave similar results (Figure 1D and 1E).
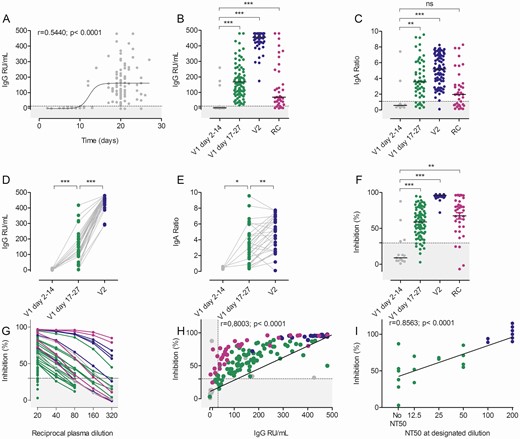
Humoral immune response after BNT162b2 vaccination. A, Time course of anti–severe acute respiratory syndrome coronavirus 2 (SARS-CoV-2) S protein immunoglobulin G (IgG) (n = 124) after the first BNT162b2 dose. B, Anti–SARS-CoV-2 S IgG responses in relative units (RU)/mL after the first (V1, gray and green dots, n = 30 and n = 87, respectively) and second (V2, blue dots, n = 87) BNT162b2 dose. Note the overlap with data in (A). Recovered coronavirus disease 2019 (COVID-19) patients (RC, n = 37) are depicted in purple. C, Anti–SARS-CoV-2 S immunoglobulin A (IgA) responses after the first (n = 65) and second (n = 88) BNT162b2 vaccinations as well as in RC patients (n = 37). Enzyme-linked immunosorbent assay (ELISA) results are depicted as sample/calibrator ratio and labeled as in (B). D and E, Intra-individual anti–SARS-CoV-2 S IgG and IgA responses as a function of time (gray dots, n = 5–10; green dots, n = 31–38; blue dots, n = 29–36). F, Inhibition in the surrogate virus neutralization test (sVNT) after the first or second BNT162b2 vaccination or in RC patients (gray dots, n = 16; green dots, n = 84; blue dots, n = 51; purple dots, n = 37). G, Reciprocal plasma dilutions of sVNT in convalescent COVID-19 patients (purple) after the second BNT162b2 dose (blue) or first BNT162b2 dose (green/gray). Note that only samples with >50% inhibition at the lowest dilution (1:20) were further titrated. H, Correlation of inhibition (sVNT) and anti–SARS-CoV-2 S IgG (ELISA) after the first or second BNT162b2 vaccination and in RC patients as indicated for (F). I, Correlation of the sVNT inhibition with the 50% neutralization titer (NT50) of the pseudotype virus neutralization results (n = 23). Dotted lines represent the assay cutoffs as suggested by the manufacturer. *P < .05, **P < .001, ***P < .0001 by 2-tailed paired Student’s t test (D and E) or analysis of variance with Bonferroni post hoc analysis (B, C, and F); ns, not significant.
When testing plasma samples in a surrogate virus neutralization test (sVNT) for inhibition of RBD binding to plate-bound ACE2 receptor, a similar picture emerged (Figure 1F, Supplementary Figure 1). Most plasma samples from days 2 to 14 after the first BNT162b2 vaccination remained below the cutoff (30%) of the assay. In contrast, almost all participants had anti–SARS-CoV-2 S1 RBD inhibitory antibodies detectable after day 17 post–first BNT162b2 vaccination. The second vaccination significantly increased inhibitory activity in this assay to levels above those in convalescent COVID-19 patients. To further assess the inhibitory activity of plasma samples after the first BNT162b2 dose, we diluted plasma with >50% inhibition in the sVNT and compared the results to those from convalescent COVID-19 patients or individuals 21 days after the second BNT162b2 dose. Plasma samples with inhibitory activity <90% at the highest plasma concentration (1:20) showed a rapid and linear decline by dilution. Only samples with baseline inhibition >90% maintained >50% inhibition in the sVNT upon further dilution (Figure 1G), indicating low antibody concentrations in most plasma samples. Our data support the finding that anti–SARS-CoV-2 antibodies need little affinity maturation [17, 18] and become detectable in the plasma at 10–14 days after first vaccination.
The sVNT showed a highly statistically significant correlation with anti–SARS-CoV-2 S IgG concentrations (Figure 1H) and, interestingly, convalescent COVID-19 patients exhibited higher SARS-CoV-2 inhibiting activity despite having lower IgG levels as compared to single-vaccinated individuals. Finally, sVNT correlated closely to inhibition of SARS-CoV-2 S-driven host cell entry in a vesicular stomatitis virus (VSV) pseudotype–based assay for detection of neutralizing antibody responses (Figure 1I).
Next, we determined whether antibodies induced by a single BNT162b2 vaccination inhibited host cell entry driven by WT S protein (harboring D614G) and the S proteins of variants B.1.1.7, B.1.351, and P.1. For this, we used a VSV-based vector pseudotyped with respective S proteins, as previously described [8]. Plasma collected from patients with severe, current COVID-19 WT was included as a control. These plasma samples reduced entry driven by WT S and the S protein of variant B.1.1.7 with similar efficiency (Figure 2A). In contrast, blockade of entry driven by the S protein of P.1 and particularly the B.1.351 variant was less efficient (Figure 2A), which is consistent with our published data [8]. Similarly, and again in line with our previous results [8], plasma collected from vaccinees 21 days after the second BNT162b2 dose efficiently neutralized entry driven by the WT S protein, and inhibition of entry driven by the S protein of B.1.1.7 was only marginally reduced (Figure 2C, Supplementary Figure 2B). In contrast, inhibition of entry driven by the S proteins of variants P.1, and particularly B.1.351, was less efficient (Figure 2C, Supplementary Figure 2B). Finally, plasma samples from the same donors obtained 21 days after the first dose exerted no (n = 8) or low (n = 5) inhibitory activity, and reduced inhibition of entry driven by the S protein of B.1.351 was observed (Figure 2B, Supplementary Figure 2A). The overall summary of the inhibition analysis of 19 vaccinees after a single dose is depicted in Figure 2D and suggests that a single vaccination may frequently fail to induce a measurable neutralizing antibody response. Moreover, if such a response is induced, it may fail to protect against infection with the B.1.351 variant.
![Spike (S) protein of severe acute respiratory syndrome coronavirus 2 (SARS-CoV-2) wild-type (WT), B1.1.7, B.1351, and P.1 variants show reduced neutralization sensitivity against plasma from BNT162b2 single- and twice-vaccinated individuals. Pseudotypes bearing the indicated S proteins were incubated with different dilutions of plasma derived from patients with severe coronavirus disease 2019 (COVID-19) (A) or plasma obtained shortly before the second dose of BNT162b2 (B) or 21 days after the second dose (C) and inoculated onto Vero target cells. Transduction efficiency was quantified by measuring virus-encoded luciferase activity in cell lysates at 16–20 hours posttransduction. The results are shown as percentage inhibition. For normalization, S protein–driven entry in the absence of plasma was set as 0%. Data from a single experiment performed with technical triplicates are presented. Error bars indicate standard deviation. Most results were confirmed in a second biological replicate. For more results and negative control, see Supplementary Figure 2. D, Plasma dilutions that led to a 50% reduction in S protein–driven transduction (50% neutralization titer [NT50]) were calculated for convalescent COVID-19 plasma (purple, n = 3) and vaccinee plasma after the first (green, n = 19) and second (blue, n = 10) BNT162b2 dose. The line represents the median NT50 of single-vaccinated individuals. Abbreviations: NP, no plasma; WT, wild-type.](https://oup.silverchair-cdn.com/oup/backfile/Content_public/Journal/cid/73/11/10.1093_cid_ciab555/2/m_ciab555f0002.jpeg?Expires=1749821699&Signature=T0Uj-038T3jCHOs~6JsJ-zbyeTsO5eKlvn~D~djG~mmOp4VgBa2peEH~mvHjnbePov-3myR3N9x5qBM4K1ZGMk2KCq6BE94AnwvXkoMqEZRpr3B8HAdSKzrgFarPIGuMebHnzOlESQ4AK-Q67R2TlYFa091N~C7G~5yEdG2EXrZAbc0GdIk0B46bB3EvEH61CUkMUIha5PP-RU6cAqZ4p~htNFSDP~9KZ8DFGrxlO76-A1B1hhcgdOW3hArKtiy1KpI7tYT4~EIh4VuZCDplTu71yCz6~fA5aFu3aUYaD8bGJ31Gxug-JLt2reHIAK9AuEcXx3pkdhCxZLam0jwLeg__&Key-Pair-Id=APKAIE5G5CRDK6RD3PGA)
Spike (S) protein of severe acute respiratory syndrome coronavirus 2 (SARS-CoV-2) wild-type (WT), B1.1.7, B.1351, and P.1 variants show reduced neutralization sensitivity against plasma from BNT162b2 single- and twice-vaccinated individuals. Pseudotypes bearing the indicated S proteins were incubated with different dilutions of plasma derived from patients with severe coronavirus disease 2019 (COVID-19) (A) or plasma obtained shortly before the second dose of BNT162b2 (B) or 21 days after the second dose (C) and inoculated onto Vero target cells. Transduction efficiency was quantified by measuring virus-encoded luciferase activity in cell lysates at 16–20 hours posttransduction. The results are shown as percentage inhibition. For normalization, S protein–driven entry in the absence of plasma was set as 0%. Data from a single experiment performed with technical triplicates are presented. Error bars indicate standard deviation. Most results were confirmed in a second biological replicate. For more results and negative control, see Supplementary Figure 2. D, Plasma dilutions that led to a 50% reduction in S protein–driven transduction (50% neutralization titer [NT50]) were calculated for convalescent COVID-19 plasma (purple, n = 3) and vaccinee plasma after the first (green, n = 19) and second (blue, n = 10) BNT162b2 dose. The line represents the median NT50 of single-vaccinated individuals. Abbreviations: NP, no plasma; WT, wild-type.
Besides neutralizing antibodies, the S protein also harbors T-cell epitopes, which are central in COVID-19 immunity [19, 20]. To assess T-cell immunity postvaccination, we analyzed the frequencies of T cells producing IFN-γ upon stimulation with peptide pools derived from the S protein of SARS-CoV-2, hCoV-OC43, and hCoV-299E, and cytomegalovirus (CMV) pp65 (as control) by enzyme-linked immunospot assay (EliSpot). T cells reactive to peptide stimulation from SARS-CoV-2 WT, B.1.1.7, and B.1.351 were undetectable in >40% of vaccinees after a single BNT162b2 shot (Figure 3A and 3B, Supplementary Figure 3) but increased significantly following boosting (Figure 3A–C). Using an alternative in vitro SARS-CoV-2–specific cytokine release assay analogous to the tuberculosis IFN-γ release assay [21, 22], we observed significantly increased IFN-γ production by PBMCs after the first and second BNT162b2 vaccination as compared to controls, but responses remained low in a sizable proportion of individuals after only 1 vaccination (Figure 4A). Interestingly, when we analyzed the IFN-γ release assay results in single-vaccinated individuals with low or absent spots per well in the EliSpot assay (Figure 4A), we found no clear correlation. In other words, in some vaccinees, low T-cell frequencies were accompanied by strong IFN-γ release, illustrating that both the quantity of specific T cells as well as qualitative cytokine production per cell strongly impact the overall antiviral response against SARS-CoV-2. This notion is further supported by the observation that T cells from some vacinees in our study released increased levels of tumor necrosis factor–α and interleukin 2 (Figure 4A), whereas no other cytokine or chemokines were significantly increased (Supplementary Figure 4).
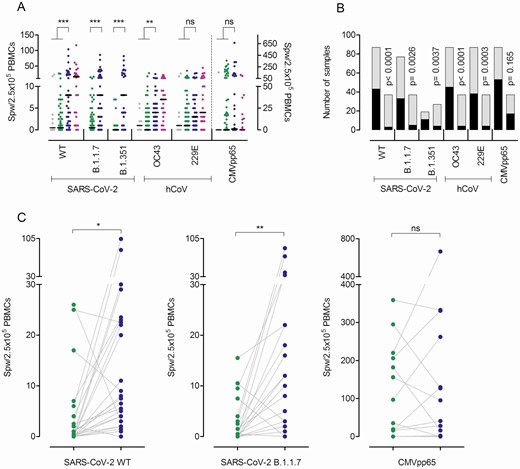
T-cell frequencies against severe acute respiratory syndrome coronavirus 2 (SARS-CoV-2) wild-type (WT) and variants B.1.1.7 and B.1.351, and human coronaviruses (hCoVs) OC43 and 229E after the first and second BNT162b2 doses. Interferon gamma (IFN-γ) enzyme-linked immunospot (EliSpot) assay data for the SARS-CoV-2 variants and 2 hCoVs from individuals vaccinated once (n = 78–88) or twice (n = 27–37) are shown. The first samples (gray dots, days 2–14; green dots, days 17–27 after the first dose) depict data from before the second vaccination and the second sample (blue dots) from 21 days after the second BNT162b2 dose. Purple dots represent results from convalescent patients at a mean 8.5 weeks (range, 3–36 weeks) after mild COVID-19. A, Data are depicted as the number of spots per well (SPW)/2.5 × 105 peripheral blood mononuclear cells (PBMCs). For cytomegalovirus (CMV) pp65, values from individuals irrespective of their CMV serostatus are depicted (note the separate axis on the right). Bars represent the median. B, Number of individuals with zero (black) or ≥1 (gray) SPW in the IFN-γ EliSpot assay after the first (left column) or second (right column) BNT162b2 dose. C, Changes in T-cell frequencies as a function of time between the first (green dots) and the second (blue dots) vaccination. *P < .05, **P < .01, ***P < .001, by 2-tailed Student’s t test (A), paired t test (C), or Fisher exact test (B); ns = not significant.
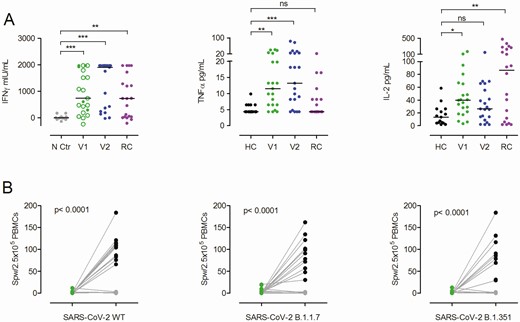
Severe acute respiratory syndrome coronavirus 2 (SARS-CoV-2) S protein–induced cytokine release after a single and double BNT162b2 dose. A, Interferon gamma (IFN-γ) release assay results obtained from peripheral blood mononuclear cells (PBMCs) of single (V1, green dots/circles) or twice (V2, blue dots) vaccinated individuals after restimulation with SARS-CoV-2 S protein for 24 hours and assessment of IFN-γ in the supernatant by enzyme-linked immunosorbent assay or by multiplex cytokine/chemokine quantification assay for tumor necrosis factor alpha (TNF-α) and interleukin 2 (IL-2). Green circles indicate individuals with ≤1 spot per well (SPW)/2.5 × 105 PBMCs in the enzyme-linked immunospot (EliSpot) assay after the first vaccination. All twice-vaccinated individuals analyzed here had >1 SPW/2.5 × 105 PBMCs. Negative controls (N Ctr, gray dots) are from the same individuals as after the second vaccination (blue dots) but from PBMCs collected in 2019 before vaccination. Purple dots represent results from PBMCs of convalescent patients with mild to severe COVID-19 (RC) at a mean of 10.1 weeks (range, 7–14 weeks) after symptom onset. For additional cytokine/chemokine results, see Supplementary Figure 4. *P < .05, **P < .01, ***P < .001, calculated by Kruskal-Wallis test; ns, not significant. B, PBMCs from individuals with low or zero SPW after a single BNT162b2 dose (n = 11) or healthy controls (HC) without anti–SARS-CoV-2 S immunoglobulin G (IgG) (both green dots) were in vitro–stimulated with overlapping peptide pools from SARS-CoV-2 S wild-type (WT) protein for 7 days and again assessed in the IFN-γ EliSpot with S protein–derived peptide pools from SARS-CoV-2 WT or variants B.1.1.7 and B.1.351. The black dots depict SPW of in vitro–stimulated cells of the vaccinated individuals; the gray dots depict SPW of controls. Groups were compared by 2-tailed paired Student’s t test.
Prompted by weak antibody neutralization activity in almost all individuals and low or even undetectable T-cell frequencies after the first vaccination, we performed experiments to expand vaccine-induced T cells. For this, we stimulated PBMCs with SARS-CoV-2 S1 and S2 peptide pools from WT and VOC for 7 days, which led to expansion and detection of responding T cells even in those individuals with initially low or no T-cell response (Figure 4B). This expansion was absent in healthy nonvaccinated controls with no anti–SARS-CoV-2 S IgG. In combination with our T-cell analysis, we conclude that a single BNT162b2 dose is able to generate an effective antiviral T-cell response, likely contributing to the clinical efficiency observed 2 weeks after immunization.
SARS-CoV-2 is a member of the coronavirus family that includes hCoV-OC43, hCoV-HKU1, hCoV-229E, and hCoV-NL63. For the 2 hCoV variants tested in our work, we observed a significant expansion of hCoV-OC43–reactive T cells and an increase in hCoV-229E–responsive T cells in the EliSpot assay (Figure 3A and 3B), suggesting a strong overlap of hCoV with SARS-CoV-2 immunity upon vaccination. This overlap in response was further demonstrated by the significant positive correlation of SARS-CoV-2 WT and variant B.1.1.7’s responsive T-cell frequencies with those against hCoVs OC43 and 229E after the first and second BNT162b2 vaccinations (Supplementary Figure 5A), while no correlation between SARS-CoV-2 T-cell responses and those toward the unrelated virus CMV occurred (Supplementary Figure 5A). Importantly, T-cell frequencies against SARS-CoV-2 WT also correlated closely and increasingly after the second vaccination with those observed for SARS-CoV-2 VOC (Supplementary Figure 5B).
DISCUSSION
Our comprehensive immunological analysis of B- and T-cell responses in a large number of individuals after a single BNT162b2 vaccination reveals important findings for the understanding of potential surrogates for protection against SARS-CoV2 WT, VOC, and preexisting cross-reactive immune responses against endemic hCoVs. The overall summary of the inhibition analysis of vaccinees suggests that a single vaccine dose may frequently fail to induce a measurable neutralizing antibody response. Moreover, if such a response is induced, it may fail to protect against infection with the B.1.351 variant.
Clinical trials and real-world data from the UK and Israel have shown protection against COVID-19 caused by SARS-CoV-2 WT or the B.1.1.7 variant [23] at around 14 days after the first vaccination against SARS-CoV-2 [1, 2, 23]. Even before the second dose, BNT162b2 was highly effective, with a vaccine efficacy of 92.6%, a finding similar to the first-dose efficacy of 92.1% reported for the mRNA-1273 vaccine [24]. A retrospective study from Israel reported adjusted rate reductions of COVID-19 of 47% (95% confidence interval [CI], 17%–66%) and 85% (95% CI, 71%–92%) for days 1–14 and days 15–28 after the first dose, respectively [12]. Similar declines after the first vaccination were reported by others [23]. A large prospective cohort study in Scotland revealed that the first dose of the BNT162b2 mRNA vaccine was associated with a vaccine effect of 91% for reduced COVID-19 hospital admission 28–34 days postvaccination, although some of the observed effects may have been influenced by other factors [11]. These studies convincingly confirm the clinical efficacy of single and full BNT162b2 vaccination. However, they provide no information of surrogates for protection; some studies found presumably indirect vaccine program–associated effects at immediately after vaccination before immunologic mechanisms could play a role [11, 12], and none determined single vaccine dose efficacy after the surge of SARS-CoV-2 VOC.
Before the second BNT162b2 shot, we did not observe high titer neutralizing antibodies even against SARS-CoV-2 WT, in line with a preprint report by Angyal et al, in which neutralizing antibodies to B.1.351 were not detectable in infection-naive individuals following a single BNT162b2 dose [25]. One might speculate that high titer neutralizing antibodies may be a more important surrogate for outcomes after SARS-CoV-2 infection or after treatment with convalescent plasma [26], but less for protection from SARS-CoV-2 infection or COVID-19 after vaccination with BNT162b2. On the other hand, fully vaccinated individuals had only slightly reduced but overall largely preserved neutralizing titers against the B.1.1.7 lineage, indicating that the B.1.1.7 variant will not escape BNT162b2-mediated protection [27].
Our data on vaccine-induced immune responses are in line with our previous analyses in convalescent COVID-19 patients [18] and show that the magnitude of B- and T-cell responses against SARS-CoV-2 upon vaccination is wide-ranging and differs for distinct virus variants. In particular, the magnitude of SARS-CoV-2–specific T-cell responses shows great heterogeneity and is not readily detectable after a single shot. These data suggest efficient T memory cell generation or booster of natural immunity against coronavirus variants after single vaccination, which was reactive after long-term in vitro stimulation with WT and mutant SARS-CoV-2 S peptide variants. These results provide evidence for potentially effective, albeit weak, T-cell immune responses against SARS-CoV-2 WT and VOC in a relevant proportion of individuals vaccinated with only the initial dose. This is in line with the study by Angyal and colleagues, in which 1 dose of vaccine elicited a significant but modest increase in T-cell responses in SARS-CoV-2–naive individuals, which was much more pronounced in individuals with prior infection. T-cell responses after 2 doses in naive individuals were comparable to those elicited by a single dose in previously infected participants. The authors concluded that a single dose of vaccine generates comparable antibody and T-cell levels to those detected weeks or months after natural infection, which are highly likely to confer similar levels of protection against infection/reinfection [25]. In a study in healthcare workers without prior infection, a single BNT162b2 shot resulted in inferior immunity against VOC as compared to a boost vaccination in individuals with prior COVID-19. In addition, peptide pools containing B.1.1.7 and B.1.351 spike mutations led to increased, abrogated, or unchanged T-cell responses depending on human leukocyte antigen polymorphisms [28]. Studies in convalescent COVID-19 patients have described that efficient SARS-CoV-2–specific T-cell responses are associated with milder disease [18, 29], suggesting that T-cell responses may be central to control of SARS-CoV-2 infection. However, our study does not allow us to estimate whether these exclusively S protein–specific T-cell responses significantly add to protection against COVID-19. Specific correlates of protection can only be established by studies observing a significant number of reinfections over time [18]. We suggest in-depth T-cell analysis for postvaccination responses in individuals with incomplete antibody responses due to, for example, immunodeficiency to determine whether T-cell responses are measurable in these patients and provide a potential replacement for antibody-mediated protection. Importantly, undetectable T-cell responses in standard T-cell stimulation assays should not be interpreted as absence of T cells responsive to SARS-CoV-2 S protein after vaccination.
Our findings on strongly related intraindividual hCoV and SARS-CoV-2 immune responses are in line with our analyses in convalescent COVID-19 patients [30] and previously described associations that described overlapping B-cell responses against α- and β-hCoVs [31]. Cross-reactivity against SARS-CoV-2 and endemic hCoVs are mediated primarily by memory CD4+ T-cell responses directed against conserved epitopes and have been reported in up to 50% of individuals [18, 19, 32–34]. Predictably, T-cell frequencies against SARS-CoV-2 WT also correlated closely and increasingly after the second vaccination with those observed for SARS-CoV-2 VOC. Whether such cross-reactivity also occurs through COVID-19 vaccination and whether individuals with cross-reactive T cells may respond differently to vaccines than those without such memory cannot be concluded from our data, since we did not assess prevaccination responses [35–37].
Our study is limited by the fact that we were unable to assess T-cell responses before vaccination and that we only investigated one mRNA-based vaccine. Second, the analyzed cellular responses would benefit from further identification of T-cell subsets and viral epitopes involved [25]. Third, our study only considers systemic responses, and studies of airway compartments or tissue-resident T cells may be important to gain additional insights into protective immunity after vaccination against COVID-19.
In summary, our data demonstrate suboptimal neutralizing antibody activity against SARS-CoV-2 WT and VOC after a single BNT162b2 vaccination, consistent with previous studies [25, 36]. T cells, which responded equally to spike-derived peptides from SARS-CoV-2 WT, B.1.1.7, and B.1.351, were detectable with a broad interindividual range and influenced by cross-reactive T cells against hCoVs. We propose that nonneutralizing antibody function and/or cellular immunity constitutes an important outcome after vaccination and may be part of the early defense against SARS-CoV-2 infection. We conclude that studies confidently assessing COVID-19 protection and sterile immunity against SARS-CoV-2 have yet to be completed; until then, variations in effective immunization programs cannot be confidently recommended [36, 38].
Supplementary Data
Supplementary materials are available at Clinical Infectious Diseases online. Consisting of data provided by the authors to benefit the reader, the posted materials are not copyedited and are the sole responsibility of the authors, so questions or comments should be addressed to the corresponding author.
Notes
Acknowledgments. The authors thank all participants of the CoCo study. They also thank Marion Hitzigrath, Sabine Buyny, Melanie Ignacio, Annika Heidemann, Luis Manthey, Till Redeker, Elisa Armbrecht, Annkathrin Anton, Christian Sturm, Julia Wahlen, Anna Zeisler, Oliver Keil, Mathäus Vetter, Andreas Bode, Birgit Heinisch, Gudrun Mielke, Nele SteinDaniel Gussarow, Juliane Ebersold, Nicole Neumann, Dörthe Rokitta, and Sophie Meyer for technical and logistical support. They thank the entire CoCo study team for help and Marcus Wortmann from the information technology department for providing support during the vaccination rollout.
Financial support. This work was supported by unrestricted grants from Novartis, Gilead Sciences, Kinderherz Hannover e.V., and Pari and in part by grants from the state of Lower Saxony (14 - 76103-184 CORONA-12/20) and the Federal Ministry of Health (ZMVI1-2520COR804). G. M. N. B. is supported by the German Center for Infection Research. M. S. W. received unrestricted funding from Sartorius for lung research.
Potential conflicts of interest. G. M. N. B., C. H., G. M. R., R. B., and A. D.-J. have received unrestricted funding to their institutions from Novartis, Gilead, Kinderherz Hannover e.V., and Pari for the CoCo Study. B. E.-V. has received funding paid to their institution from the State of Lower Saxony. S. P. has received funding from the State of Lower Saxony (paid to their institution), the German Research Foundation (DFG), and the German Federal Ministry of Education and Research (BMBF); and reports support paid to their institution by DFG and BMBF, during the conduct of the study. R. B. has the patent “Method for identifying T-cell–stimulating protein fragments” (PCT/DE99/00175) issued, and has received royalties for granting use of patents “Method for identifying T-cell stimulating protein fragments” (PCT/DE99/00175) and “Method for antigen-specific stimulation of T lymphocytes with synthetic peptide libraries” (US 7 994 096 B1). M. S. W. has received unrestricted personal funding support from Sartorius; and received a personal payment for consulting for Amomed, outside the submitted work. M. M. H. has received personal payment or honoraria for consulting or lectures from Acceleron, Actelion, Bayer, GSK, Janssen, MSD, and Pfizer. A. B. reports payment to their institution by the State of Lower Saxony, during the conduct of the study. All other authors report no potential conflicts.
All authors have submitted the ICMJE Form for Disclosure of Potential Conflicts of Interest. Conflicts that the editors consider relevant to the content of the manuscript have been disclosed.
References
Author notes
M. V. S. and A. C. contributed equally to this work.

