


Abstract
In October 2007, Veterans Affairs (VA) launched a nationwide effort to reduce methicillin-resistant Staphylococcus aureus (MRSA) transmission called the National MRSA Prevention Initiative. Although the initiative focused on MRSA, recent evidence suggests that it also led to a significant decrease in hospital-onset (HO) gram-negative rod (GNR) bacteremia, vancomycin-resistant Enterococci (VRE), and Clostridioides difficile infections. The objective of this analysis was to evaluate the cost-effectiveness and the budget impact of the initiative taking into account MRSA, GNR, VRE, and C. difficile infections.
We developed an economic model using published data on the rate of MRSA hospital-acquired infections (HAIs) and HO-GNR bacteremia in the VA from October 2007 to September 2015, estimates of the attributable cost and mortality of these infections, and the costs associated with the intervention obtained through a microcosting approach. We explored several different assumptions for the rate of infections that would have occurred if the initiative had not been implemented. Effectiveness was measured in life-years (LYs) gained.
We found that during fiscal years 2008–2015, the initiative resulted in an estimated 4761–9236 fewer MRSA HAIs, 1447–2159 fewer HO-GNR bacteremia, 3083–3602 fewer C. difficile infections, and 2075–5393 fewer VRE infections. The initiative itself was estimated to cost $561 million over this 8-year period, whereas the cost savings from prevented MRSA HAIs ranged from $165 to $315 million and from prevented HO-GNR bacteremia, CRE and C. difficile infections ranged from $174 to $200 million. The incremental cost-effectiveness of the initiative ranged from $12 146 to $38 673/LY when just including MRSA HAIs and from $1354 to $4369/LY when including the additional pathogens. The overall impact on the VA’s budget ranged from $67 to$195 million.
An MRSA surveillance and prevention strategy in VA may have prevented a substantial number of infections from MRSA and other organisms. The net increase in cost from implementing this strategy was quite small when considering infections from all types of organisms. Including spillover effects of organism-specific prevention efforts onto other organisms can provide a more comprehensive evaluation of the costs and benefits of these interventions.
In October 2007, Veterans Affairs (VA) launched a nationwide effort to reduce methicillin-resistant Staphylococcus aureus (MRSA) transmission called the National MRSA Prevention Initiative. This initiative consisted of a bundle that included [1] universal nasal surveillance for MRSA, [2] isolation and contact precautions (CPs) for patients whose nasal test for MRSA was positive, [3] improved hand hygiene efforts, and [4] an increased emphasis on infection control being the responsibility of all healthcare workers. Several recently published studies have shown that MRSA hospital-acquired infections (HAIs) decreased significantly after the implementation of the initiative [1, 2]. In previous work, we conducted a budget impact analysis (BIA) and cost-effectiveness analysis (CEA) of the first 3 years of the initiative. We estimated incremental cost-effectiveness ratios (ICERs) of $56 944–$28 048/life-year (LY) [3].
The universal surveillance component of the initiative is an example of a vertical infection control approach, meaning that it is focused on a specific organism, namely, MRSA. On the other hand, the other components of the initiative could apply to all organisms (horizontal). In fact, recent evidence suggests that the MRSA Prevention initiative also led to a significant decrease in hospital-onset (HO) gram-negative rod (GNR) bacteremia [4], vancomycin-resistant Enterococci (VRE) [1], and Clostridium difficile infections [1]. This decline in infection rates may have been the result of increased isolation of patients who tested positive on admission for MRSA who also happened to be carrying other organisms. Evidence for this has been documented for GNR bacteria [5].
Considering only the direct effects of interventions on the target organisms may underestimate their benefit. The objective of this analysis was to evaluate the cost-effectiveness and the budget impact of the initiative taking into account MRSA, GNR, VRE, and C. difficile infections (CDI).
METHODS
We developed a simulation model in which a population of hypothetical patients entered the hospital each month over an 8-year time frame (FY2008–FY2015). We analyzed our model using costs from the VA’s perspective and converted all costs to 2019 US dollars (US$). Table 1 lists the values and sources for key input parameters included in our model. The cost of the materials used in the intervention included the cost of the screening test ($27) [6, 7], isolation materials including gowns, gloves, surgical masks, goggles, and isolation laundry double bags ($44.71 per isolation day). In addition, we included costs associated with extra workload for nurses ($66.80 per isolation day), physicians ($8.82 per isolation day), and other hospital staff ($16.60 per isolation day) such as donning and doffing gloves and gowns upon entering and exiting an isolation room. One-time costs per isolated patient captured extra time for providers and deep cleaning on the first or last day of a patient’s stay ($22.51 per patient). In addition, we included the salaries of an MRSA Prevention Coordinator ($97 101 salary and benefits) and 0.5 full-time equivalent (FTE) of a laboratory technician ($70 924 salary and benefits). Finally, each year, facilities were provided educational materials (estimated to be $6083 for the first year and $1176 each subsequent year) related to the initiative.
Input Parameters for Budget Impact Analysis and Cost-Effectiveness Analysis Simulation Model
| Input | Value | Source |
|---|---|---|
| Admission-related parameters | ||
| Number of admissions/year in VA | 582 230 | Jain (2011) |
| Proportion of VA inpatients admitted to ICU | 0.109 | Chen (2012) |
| ICU patient-days per month | 39 783 | Jain (2011) |
| Non-ICU patient-days per month | 212 298 | Jain (2011) |
| HAI rates | ||
| MRSA (per 1000 patient days) | ||
| ICU, baseline (Oct 2007) | 1.64 | Jain (2011) |
| Non-ICU, baseline (Oct 2007) | 0.46 | Jain (2011) |
| ICU, end of study period (Sept 2015) | 0.15 | Evans (2017) |
| Non-ICU, end of study period (Sept 2015) | 0.09 | Evans (2017) |
| Monthly change if no initiative, temporal trend assumption | -0.8% | Dantes (2013) |
| E. coli (per 10 000 patient days) | ||
| Baseline (Oct 2007) with MRSA initiative | 1.43 | Goto (2016) |
| End of study period (Dec 2013) with MRSA initiative | 1.25 | Goto (2016) |
| Baseline (Jan 2007) without MRSA initiative | 1.48 | Goto (2016) |
| End of study period (Dec 2013) without MRSA initiative | 1.73 | Goto (2016) |
| Klebsiella (per 10 000 patient days) | ||
| Baseline (Oct 2007) with MRSA initiative | 1.60 | Goto (2016) |
| End of study period (Dec 2013) with MRSA initiative | 1.15 | Goto (2016) |
| Baseline (Jan 2007) without MRSA initiative | 1.86 | Goto (2016) |
| End of study period (Dec 2013) without MRSA initiative | 2.41 | Goto (2016) |
| P. aeruginosa (per 10 000 patient days) | ||
| Baseline (Oct 2007) with MRSA initiative | 1.05 | Goto (2016) |
| End of study period (Dec 2013) with MRSA initiative | 0.60 | Goto (2016) |
| Baseline (Jan 2007) without MRSA initiative | 1.10 | Goto (2016) |
| End of study period (Dec 2013) without MRSA initiative | 1.20 | Goto (2016) |
| C diff (per 1000 patient days) | ||
| Non-ICU, baseline with MRSA Initiative | 1.44 | Jain (2011) |
| Non-ICU, end of study period with MRSA Initiative | 0.56 | Jain (2011) |
| Monthly change if no initiative, temporal trend assumption | 1.4% | Luo (2018) |
| VRE (per 1000 patient days) | ||
| ICU, baseline with MRSA Initiative | 1.51 | Jain (2011) |
| ICU, end of study period (June 2010) with MRSA Initiative | 0.00 | Jain (2011) |
| Non-ICU, baseline with MRSA Initiative | 0.33 | Jain (2011) |
| Non-ICU, end of study period (June 2010) with MRSA Initiative | 0.09 | Jain (2011) |
| Costs | ||
| Cost of initiative—per patient | ||
| Screening test | $27 | Clancy (2006), McKinnell (2015) |
| Isolation materials per day | $44.71 | Roth (2018) |
| Cleaning materials per day | $5.50 | Roth (2018) |
| Nurse time per day | $66.80 | Roth (2018) |
| Physician time per day | $8.82 | Roth (2018) |
| Other staff time per day | $16.60 | Roth (2018) |
| One-time costs on first or last day in isolation | $22.51 | Roth (2018) |
| Cost of initiative—fixed (per facility) | ||
| MRSA Prevention Coordinator | ||
| Salary + benefits | $97 101 | BLS |
| Lab tech | ||
| Salary + benefits | $70 924 | BLS |
| Proportion used | 0.5 | VA NIDS |
| Educational materials (per facility) | ||
| 1st year | $6 083 | VA NIDS |
| Each subsequent year | $1176 | VA NIDS |
| Effectiveness outcome (life years gained) | ||
| Average age of patients | 50 | Assumption |
| Average life expectancy | 78.8 | CDC FastStats |
Abbreviations: BLS, Bureau of Labor Statistics; CDC, Centers for Disease Control and Prevention; HAI, hospital-acquired infections; ICU, intensive care unit; MRSA, methicillin-resistant Staphylococcus aureus; NIDS, National Infectious Diseases Service; VA, Veterans Affairs; VRE, vancomycin-resistant Enterococci.
Our simulation model tracked healthcare-associated infections (HAIs) due to MRSA, VRE, C. difficile, and GNR. We used published estimates of the monthly rates of MRSA HAIs from October 2007 to September 2010 from Jain et al (2011) and October 2010 to December 2015 from Evans et al (2017). Similar estimates were obtained for C. difficile and VRE from October 2007 to September 2010 from Jain et al (2011) and for GNR from Goto et al (2017). The specific types of GNR presented in Goto et al (2017) were Escherichia coli (E. coli), Klebsiella species, and Pseudomonas aeruginosa (P. aeruginosa). We explored several different assumptions for the rate of infections that would have occurred if the initiative had not been implemented. First, we assumed that, in the absence of the MRSA prevention initiative, infection rates would have remained relatively constant. We referred to this scenario as the straight line assumption. Second, we assumed that infection rates would have followed the same trajectory they had been on prior to the initiative or in other healthcare systems during the time window of our analysis. For example, there is evidence to suggest that MRSA infection rate was declining in the United States prior to the VA initiative [8]. So for our second assumption (temporal trend), we assumed MRSA infection rates in the VA would have followed this same trajectory had the initiative not been implemented. In Goto et al (2016), the temporal trends in hospital-onset E. coli, Klebsiella species, and P. aeruginosa were increasing prior to the implementation of the initiative [4]. Our temporal trend infection rates for CDI were obtained from a recent study that identified incidence of CDI in US acute care hospitals from 2005 to 2014 using data from the Nationwide Inpatient Sample database [9]. Finally, we found evidence of no significant temporal trend in VRE infections during this time period [10].
Another important set of input parameters for our simulation model was the consequences of infections (see Table 2). Using data from published studies, the attributable risk of mortality due to infection ranged from 10.1% for MRSA [11] to 18.0% for C. difficile [12–34], and the attributable cost of infection ranged from $12 286 for C. difficile [21, 32, 33, 35–37] to $40 739 for MDR P. aeruginosa [38].
Input Parameters for Budget Impact Analysis and Cost-Effectiveness Analysis Simulation Model—Attributable Mortality and Cost of Healthcare-Associated Infections Due to MRSA, Gram-Negative Bacteria, VRE, and Clostridioides difficile
| Organism | Attributable Mortality | Source | Attributable Cost | Source |
|---|---|---|---|---|
| MRSA | 10.1% | Nelson (2017) | $26 002 | Nelson (2015) |
| P. aeruginosa | 19.1% | Nelson (2017) | $31 399 | Nelson (2018) |
| Enterobacteriaceae | 16.8% | Nelson (2017) | $30 764 | Nelson (2018) |
| VRE | 12.4% | CDC Threat Report (2019) | $39 304 | Nelson (2020) |
| Clostridioides difficile | 18.0% | Ali (2012), Ananthakrishnan (2008), Ananthakrishnan (2011), Bateman (2013), Changela (2004), Classen (2010), Crabtree (2007), Dubberke (2008), Elixhauser (2008), Jiang (2013), Kenneally (2010), Kim (2013), Lesperance (2011), Maltenfort (2013), Micek (2013), Nguyen (2008), Pakyz (2011), Pant (2012), Sheth (2010), Song (2008), Stewart (2011), Tabak (2013), Wilson (2013) | $13 303 | Kyne (2002), Stewart (2011), Campbell (2013), Jian (2013), Tabak (2013), Magee (2015) |
Abbreviations: CDC, Centers for Disease Control and Prevention; MRSA, methicillin-resistant Staphylococcus aureus; VRE, vancomycin-resistant Enterococci.
We used this simulation model to calculate the budget impact of the MRSA prevention initiative by calculating the total cost of the intervention as well as the costs of the HAIs that occurred at a population level. We then compared these population-level costs with the costs of the HAIs that would have occurred without the initiative using both the straight line and the temporal trend assumptions.
We then used the simulation model to conduct a CEA of the initiative compared to no initiative. The effectiveness was measured by infections prevented, infection-related deaths prevented, and LYs gained in this CEA. For the CEA, we assumed that the average age of a patient admitted to a VA hospital was 50 years and that the life-expectancy of these individuals was 78.8 years [39]. We discounted outcomes occurring in future time periods but related to the initial hospital stay at a rate of 3%, but—following recommended practice—our model did not consider future access to healthcare [40]. Therefore, patients who did not die due to MRSA HAIs were assumed to gain 20.2 discounted LYs.
We analyzed our model first considering only MRSA infections. Then we included infections from other pathogen classes one at a time. In our final analysis, we considered all pathogens.
Finally, to explore uncertainty in our parameter values, we conducted probabilistic sensitivity analyses (PSAs) by randomly drawing 10 000 separate samples of each parameter value from its probability distribution and then rerunning our model on each of these 10 000 samples. Probability, cost, and relative risk inputs were assumed to follow a beta, gamma, and normal distribution, respectively. We performed this PSA using both the straight line and temporal trend assumption.
Our simulation model was constructed in SAS 9.4.
RESULTS
We found that during fiscal years 2008–2015, the total cost of the MRSA Prevention Initiative was $904.2 million (see Figure 1). The largest contributors to this cost included staff time ($224.9 million for nurses, $55.9 million for other staff, and $29.7 million for physicians), the costs of screening ($137.9 million for screening on admission and $105.9 million for screening on transfer or discharge), and isolation materials ($150.5 million).
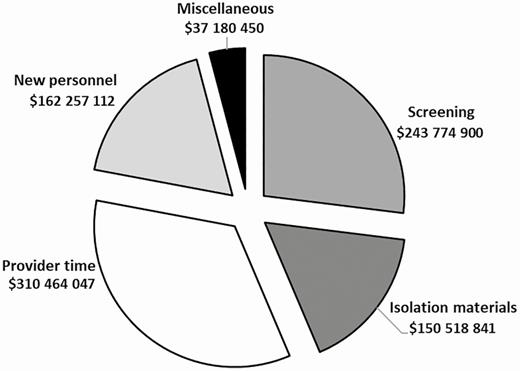
Total cost of MRSA Prevention Initiative intervention, FY2008–FY2015. Isolation materials include gowns, gloves, surgical masks, goggles, and isolation laundry double bags; new personnel includes a MRSA prevention coordinator and 0.5 full-time equivalent laboratory technician; provider time includes extra workload from nurses, physicians, and other hospital staff; miscellaneous includes cleaning materials, educational materials, and 1-time cost items on first last day of isolation such as extra workload for infection preventionists, nurses, residents, and deep cleaning of the room; screening costs include both screening on admission and transfer. Abbreviation: MRSA, methicillin-resistant Staphylococcus aureus.
Figure 2 shows the incremental effectiveness of the initiative compared to both assumptions of infection rates without the initiative for the scenario. Our model indicated that the initiative resulted in an estimated 4745 to 9220 fewer MRSA HAIs. In addition, we found that there were 1719–2563 fewer HO-GNR bacteremia, 3660–4076 fewer C. diff infections, and 1344–1823 fewer VRE infections. When considering infections from all pathogens, the initiative resulted in 12 729–16 422 fewer infections. Fewer infections also led to fewer infection-related deaths. The initiative led to 10 209–19 834 LYs gained when only considering MRSA. But when infections from all pathogens were included, the initiative yielded 37 147–43 037 more LYs compared to no initiative. The incremental costs were positive in each scenario, ranging from $565.4 to $729.8 million when only MRSA infections were taken into account and from $398.6 to $537.7 when additional pathogens were included (Figure 3).
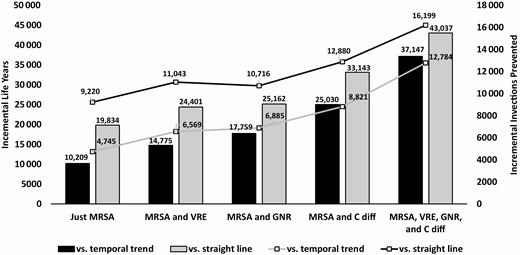
Incremental effectiveness—MRSA Prevention Initiative vs no MRSA Prevention Initiative. Abbreviations: C diff, Clostridioides difficile; GNR, gram-negative rod bacteria; MRSA, methicillin-resistant Staphylococcus aureus; VRE, vancomycin-resistant Enterococci.
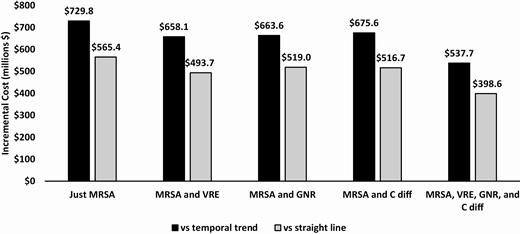
Incremental cost—MRSA Prevention Initiative vs no MRSA Prevention Initiative. Abbreviations: C diff, Clostridioides difficile; GNR, gram-negative rod bacteria; MRSA, methicillin-resistant Staphylococcus aureus; VRE, vancomycin-resistant Enterococci.
The incremental cost-effectiveness of the initiative ranged from $28 504 to $71 487 /LY when just including MRSA HAIs and from $9263 to $14 475 /LY when including the additional pathogens (Figure 4). Finally, results from the PSA are depicted as cost-effectiveness acceptability curves (CEAC) in Figures 5A and 5B when all 4 types of organisms are included in our model. CEACs show the proportion of the 10 000 Monte Carlo simulations for which each strategy was cost-effective at different willingness-to-pay (WTP) thresholds. Compared to no MRSA Prevention Initiative, the initiative was cost-effective in all iterations at a WTP threshold of $13 000/LY for the temporal trend assumption and $9000/LY for the straight line assumption.
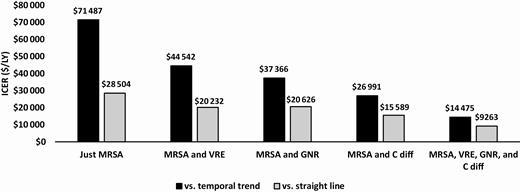
Incremental cost-effectiveness ratios. Abbreviations: C diff, Clostridioides difficile; GNR, gram-negative rod bacteria; MRSA, methicillin-resistant Staphylococcus aureus; VRE, vancomycin-resistant Enterococci.
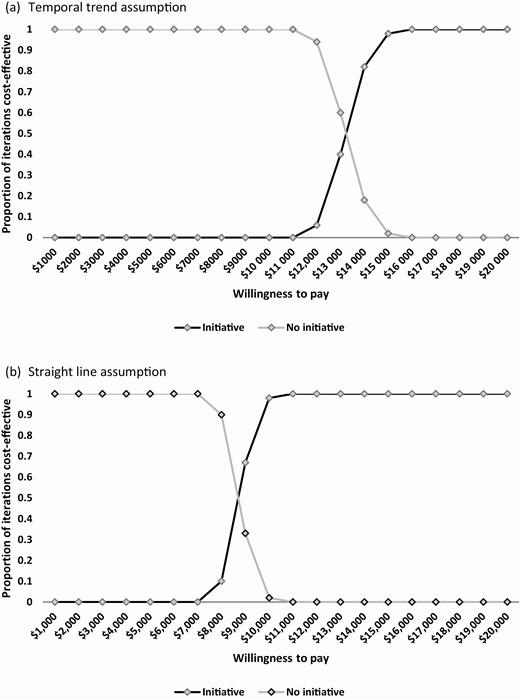
Cost-effectiveness acceptability curves. (A,Temporal trend assumption. B,Straight line assumption.
DISCUSSION
Using inputs from previously published papers, we developed a simulation model to conduct an economic evaluation of an MRSA surveillance and prevention strategy in VA. Compared to several different assumptions of the number of infections that would have occurred without the intervention, we found that the initiative may have prevented a substantial number of infections from MRSA and other organisms. Our simulation model compared the costs of the intervention with the costs saved from these prevented infections and weighed these net costs against the benefits of these prevented infections. We found that the savings associated with the prevented infections helped to offset some but not all of the cost of the initiative, resulting in a net increase in cost. Although still positive, this net increase in cost was quite small when considering infections from all 4 types of organisms yielding ICERs of $9263–$14 475/LY, which is well below the $50 000–$150 000/quality-adjusted LY threshold that is typically used for determining cost-effectiveness [41].
Economic evaluations of novel infection control interventions are an important component of implementation science [42]. These evaluations can help decision makers understand the tradeoffs between increased cost and improved health that can come from such interventions. Our CEA and BIA were conducted after implementation of the intervention using published consequences of the intervention as inputs. A recent systematic review of economic evaluations in the implementation and improvement science fields of found that virtually all of the identified studies were similarly done ex post [42].
The universal MRSA surveillance component of the MRSA Prevention Initiative is typically thought of as a vertical approach to infection prevention because it is designed to reduce transmission of a specific pathogen. The other components of the initiative (isolation, improved hand hygiene, and culture change related to the importance of infection control efforts) would be considered horizontal because they apply to all infectious pathogens generally. A number of commentaries have advocated using a horizontal approach, citing that this is a better use of scarce resources [43, 44]. We found that including spillover effects of organism-specific prevention efforts onto other organisms yielded even more favorable results than simply considering MRSA alone. This demonstrates that the evaluation of horizontal infection control interventions that only focus on the impacts of the intervention on single pathogens might underestimate the value of those interventions.
A number of published studies have reported the results of CEAs of infection control interventions. This current study updates our previously published CEA of the VA MRSA Prevention Initiative in which we found ICERs ranging from $61 567 to $30 369/LY (converted to 2019 US dollars) using data on MRSA infection rates in the VA from October 2007 to September 2010 [3]. The high end of the ICER range for the current study was similar ($71 487/LY) but slightly higher than our previous study because we used a recently published detailed estimate of the daily cost for a patient in an isolation room. These were much more reliable (and higher) than our assumed cost of isolation that was included in our previous study. In addition, the low end of the ICER range in our current study ($28 504/LY) is lower ICERs than that of our prior study for 2 reasons. The lower ICERs can be attributed to the inclusion of additional pathogens and the inclusion of an additional 5 years of MRSA infection rates. The sustained drop in MRSA infection rates following the initiative resulted in improved value for the program. Using a dynamic transmission model, Robotham et al (2015) examined another large-scale universal MRSA surveillance initiative for all inpatient admissions, from the National Health Service England. They found that a more efficient use of resources would be to screen only admissions to high-risk specialties [45].
This study had several limitations. First, other changes to infection control practices in VA hospitals were occurring during our 8-year evaluation window. For example, the VA launched a national C diff Prevention Initiative in July 2012 with the goal of reducing CDIs in VA acute care medical centers [46]. This initiative included both vertical elements such as molecular approaches to diagnosing CDI and horizontal elements such as environmental management, and a renewed effort to improve hand hygiene and emphasize that infection control is everyone’s responsibility. A subsequent study reported a 15% decline in CDIs through the first 3 years of the initiative [47]. Just as our model has drawn upon studies showing the spillover effects of the MRSA Prevention Initiative onto infections from other organisms, the C diff Prevention Initiative may have also contributed to declines in MRSA infection rates. Second, we assumed that every patient admitted for an inpatient stay at a VA acute care facility was, in fact, tested for MRSA colonization and that contact precautions were used when providers cared for this patient. This assumption meant that each admission contributed the costs of this testing and the gloves and gowns to the cost of the MRSA Prevention Initiative strategy. Relaxing this assumption would decrease the cost of the initiative, leading to even more favorable cost-effectiveness results. Third, we made a conscious effort to include input parameters that were specific to the VA. This included infection rates, intervention costs, and the cost and mortality consequences of HAIs. For example, we assumed that the life expectancy of patients in our model was 78.8 years which is slightly lower than the life expectancy for US males—because the Veteran population is predominantly male—conditional on surviving to age 50 (79.67) given that this population of hospitalized individuals likely has comorbidities that would increase the risk of mortality. Although we hope that this decision helps make the results of our analysis useful for VA decision makers, they may not be as generalizable to a non-VA audience. Fourth, we used inputs from Jain et al to characterize the decline in CDI and VRE infections. However, these results were only reported in a small fraction of VA facilities (17 out of 153) and so may not be an accurate representation of the true impact of the intervention on these infections. The ICERs generated from our model when CDI and VRE infections were excluded (ie, only including infections from MRSA and gram-negative bacteria) were $37 366–$20 626/LY. Finally, it is impossible to know what the infection rates would have been for each of the infection types if the MRSA Prevention Initiative had not been implemented. We made 2 relatively simple assumptions in an effort to cover a wide range of possible scenarios. In each case, the initiative was found to be cost-effective at standard willingness-to-pay thresholds.
CONCLUSIONS
In conclusion, preventing HAIs can lead to fewer infection-related deaths and lower costs among hospitalized patients. However, the resources required to undertake these prevention efforts can be costly, and the impact on a healthcare system’s budget impact and cost-effectiveness of the intervention depends on how many infections can be expected to be prevented. We found that including the horizontal effects of an infection prevention intervention leads to lower ICERs than when just considering the vertical effects. Although we included in our model the impact of the VA MRSA Prevention Initiative on infections due to several other pathogens, future research could explore whether there may be additional benefits to this intervention including decrease in infections due to other bacterial or viral pathogens, less transmission of these pathogens in the community following discharge, and decreased severity of those who do become infected. Future research could also examine the cost-effectiveness of large, system-wide infection control interventions such as this one at the facility level. For example, although the cost of this intervention (the salaries of the MRSA Prevention Coordinator and laboratory technician) was the same across all facilities, because the size of VA hospitals can vary substantially, there is likely a great deal of variation in the per-patient intervention costs across hospitals. In addition, the pre-intervention prevalence of MRSA likely varied widely across facilities, and previous studies have shown that the cost-effectiveness of infection prevention efforts can be affected by pre-intervention infection rates [48].
Notes
Acknowledgments. We would like to acknowledge funding for this supplement from the Informatics, Decision-Enhancement and Analytic Sciences (IDEAS) Center and the VA Health Services Research and Development (HSR&D) Service.
Disclaimer. The findings and conclusions in this report are those of the authors and do not necessarily represent the official position of the Centers for Disease Control and Prevention or the Department of Veterans Affairs.
Financial support. This work was supported with the use of facilities and resources at the George E. Wahlen Department of Veterans Affairs Medical Center, Salt Lake City, Utah. This study was supported by the VA Health Services Research and Development Service (Center of Innovation—Informatics, Decision-Enhancement and Analytic Sciences (IDEAS) Center [CIN 13–414 to M. S.] and CDA 11–210 to R. N.). The funders had no role in study design, data collection and analysis, decision to publish, or preparation of the manuscript.
Supplement sponsorship. This supplement is sponsored by the Informatics, Decision-Enhancement and Analytic Sciences (IDEAS) Center.
Potential conflicts of interest. The authors: No reported conflicts of interest. All authors have submitted the ICMJE Form for Disclosure of Potential Conflicts of Interest. Conflicts that the editors consider relevant to the content of the manuscript have been disclosed.

