


Abstract
Influenza is an important cause of viral hospital-acquired infection involving patients, healthcare workers (HCW), and visitors. The frequency of asymptomatic influenza among HCW with possible subsequent transmission is poorly described. The objective is to determine the cumulative incidence of asymptomatic, paucisymptomatic, and symptomatic influenza among HCW.
A multicenter prospective cohort study was done in 5 French university hospitals, including 289 HCW during the 2016–2017 influenza season. HCW had 3 physical examinations (time [T] 0, before epidemic onset; T.1, before epidemic peak; T.2, T.3, after epidemic peak). A blood sample was taken each time for influenza serology and a nasal swab was collected at T1 and T2 for influenza detection by polymerase chain reaction (PCR). Positive influenza was defined as either a positive influenza PCR, and/or virus-specific seroconversion against influenza A, the only circulating virus, with no vaccination record during follow-up. Symptoms were self-reported daily between T1 and T2. Cumulative incidence of influenza was stratified by clinical presentation per 100 HCW.
Of the 289 HCW included, 278 (96%) completed the entire follow-up. Overall, 62 HCW had evidence of influenza of whom 46.8% were asymptomatic, 41.9% were paucisymptomatic, and 11.3% were symptomatic. Cumulative influenza incidence was 22.3% (95% confidence interval [CI]: 17.4%–27.2%). Cumulative incidence of asymptomatic influenza was 5.8% (95% CI: 3.3%–9.2%), 13.7% (95% CI: 9.9%–18.2%) for paucisymptomatic influenza, and 2.9% (95% CI: 1.3%–5.5%) for symptomatic influenza.
Asymptomatic and paucisymptomatic influenza were frequent among HCW, representing 47% and 42% of the influenza burden, respectively. These findings highlight the importance of systematic implementation of infection control measures among HCW regardless of respiratory symptoms from preventing nosocomial transmission of influenza.
NCT02868658.
Influenza is a highly contagious viral disease that constitutes a major concern in hospital settings owing to its high incidence among patients and healthcare workers (HCW), the epidemic risk, and the related mortality among patients [1]. Influenza is known to increase hospital costs and is a substantial cause of absenteeism among HCW [2]. In France, 2–7 million people are symptomatically infected each year [3] and in the United States, 9–36 million individuals present influenza each season [4]. On average, 18% (95% confidence interval [CI]: 16–22%) of unvaccinated individuals are infected each winter season [5]. Hospital-acquired influenza epidemics are suspected when influenza-like illness (ILI) cases are observed in a healthcare facility during the influenza season [6, 7]. The prevention and control of hospital-acquired influenza is based on vaccination of HCW and patients, completed by control measures combining hand hygiene, mask wearing, patient isolation, antiviral treatments, and prophylaxis [8].
Influenza transmission is mainly by droplets during close contact, with possible transmission by air or direct contact [9]. Clinical influenza, as described in text books, combines fever associated with other respiratory symptoms such as cough, sore throat, and general symptoms such as headache or myalgia [10]. However, a recent study has reported that clinical presentation can be more self-limited or even asymptomatic in a significant number of influenza-documented cases in the community [5], but data are lacking for HCW. In hospital settings, exposure to symptomatic and influenza-infected patients and/or HCW increases the risk of influenza in patients [11] and infected HCW are frequently sources of nosocomial influenza [1, 12, 13]. We hypothesize that asymptomatic HCW could be responsible for transmission of influenza to patients [14–16] and colleagues and probably play a significant role in the transmission/spread of the infection [17].
The identification of asymptomatic HCW is therefore fundamental for the prevention and control of hospital-acquired influenza. For this purpose, a prospective cohort study with systematic sampling of HCW was implemented during the 2016–2017 influenza season to assess the incidence and the proportion of asymptomatic, paucisymptomatic, and symptomatic influenza among HCW in short-stay wards in 5 university hospitals in France.
METHODS
Settings, Population
A prospective multicenter cohort study was carried out in 5 French University hospitals between 1 September 2016 and 30 March 2017. Volunteer HCW from Lyon (Edouard Herriot and Lyon Est hospitals), Grenoble, Saint-Etienne, and Dijon University Hospitals were included. The identification and inclusion of HCW was carried out in each center by the occupational medicine department, the infection control unit, or the clinical research center. Information about the study was also given at the institutional level. Inclusion criteria were: (1) age ≥18 years, (2) voluntary participation, and (3) working in a short-stay healthcare unit. Exclusion criteria were: (1) presence of an ILI on the day of the first consultation, (2) programmed absence during the follow-up period, whatever the reason, or (3) a professional activity without patient contact (eg, secretary, administrative officer).
The inclusion period started on 4 October 2016 and ended on 5 December 2016. Time 0 (T.0), that is, the inclusion consultation, consisted of presentation of the study, signature of consent, face-to-face interviewer-administrated questionnaire with collection of demographic and professional information, and vaccination status. A blood sample (T.0 serology) was also collected on dry tube. The second consultation (consultation T.1) was scheduled from 2 to 18 January 2017 during the peak epidemic period. The latter was determined based on the French National Influenza Surveillance System [18]. The third consultation (consultation T.2) was scheduled 3-weeks (±7 days) after the T.1 consultation. T.1 and T.2 consultations consisted of face-to-face interviewer-administrated questionnaires to collect information on the existence of any recent ILI, blood sample collection (T.1, T.2 serologies), and nasopharyngeal swab on virocult (T.1 and T.2 polymerase chain reaction [PCR]). Between T.1 and T.2, a logbook with daily self-collection of clinical signs and symptoms, current treatment, and sick leave periods was completed prospectively by the enrolled HCW. Weekly contact by phone was performed to check that the logbook was completed and to ask for the presence of symptoms, which were also reported to the investigator. In case of clinical signs or symptoms, an additional consultation (T.s) was planned and included another nasopharyngeal swab for additional PCR viral research. The last consultation (T.2 + 30) was scheduled 30 days (±7 days) after the T.2 consultation and consisted of a phone questionnaire to identify the occurrence of an ILI since the T.2 consultation.
Virologic Investigations
Nasopharyngeal specimens were taken using Virocult swab (Sigma Virocult® Purflock® 2ml, Elitech). Each center performed aliquots of nasal swabs and sera according to a standardized protocol. All clinical samples were analyzed by the Influenza National Reference Center (CNG) of Southern France located in Lyon, except for the potential T.s test that was analyzed locally by PCR. Influenza diagnosis was performed by duplex A/B reverse transcription polymerase chain reaction (RT-PCR) (in-house PCR), and the result was positive or negative according to the detection for influenza A or B. The samples detected positive by RT-PCR for influenza were further subtyped by PCR. Serology was done by hemagglutination inhibition assay for the specific investigation of anti-A(H3N2) A/Hong Kong/4801/2014 and B-Victoria Lineage B/Brisbane/60/2008. The presence of antibodies against influenza was tested by a hemagglutination inhibition test (IHA). The sera were tested against influenza A (H3N2) and B virus strains circulating in the 2016–2017 winter season. All sera from a patient were tested with the same IHA test. Analyses of the respiratory samples and the sera received at the 3 consultations (T.0, T.1, and T.2) were centralized.
Outcomes, Endpoints
The main outcome was laboratory-confirmed influenza defined by the presence of at least 1 of the following criteria with the absence of seroconversion or significant increase in the level of anti-B/Brisbane/60/2008 antibodies (no circulation of influenza virus B during the season):
- Positive influenza PCR at T.1, T.2, and/or T.s.;
- Influenza seroconversion defined by a negative anti-A antibody titer in Hong-Kong/4801/2014 (<10 units) at T.0 or T.1 and positive anti-A antibody titer in Hong-Kong/4801/2014 (≥40) at the next time (T.1 or T.2);
- A significant increase in the anti-A antibody titer in Hong-Kong/4801/2014 defined as an antibody titer between 10 and 40 at T.0 or T.1 and antibody titer multiplied by ≥2 in the following consultation (T.1 or T.2).
As for signs and symptoms, influenza was defined for each period (T.0–T.1, T1. –T.2) among confirmed cases as the following:
- Asymptomatic influenza, defined by the absence of any signs or symptoms and temperature <37·8°C;
- Paucisymptomatic influenza, defined by the presence of ≥1 sign(s) or symptom(s) for >1 day, with temperature <37·8°C, or absence of cough and pharyngeal pain;
- Symptomatic influenza defined by the presence of fever ≥37·8°C with presence of cough or pharyngeal pain, which corresponded to a widely accepted definition of ILI [19].
Statistical Analysis
The primary endpoint was quantified by the cumulative incidence of asymptomatic, paucisymptomatic, and symptomatic influenza per 100 HCW. It was also evaluated by the proportion of HCW presenting asymptomatic/paucisymptomatic/symptomatic influenza among all HCW with laboratory-confirmed influenza during the entire influenza season. Sample size calculation was based on a 75% asymptomatic or paucisymptomatic proportion of confirmed influenza cases and an incidence of 20/100 HCW per year [5]. Inclusion of 196 HCW would make it possible to describe an incidence of 15% asymptomatic influenza and 5% symptomatic influenza with a precision of ±5%. Due to possible loss of follow-up, the initial objective was to include 50 HCW in each center (ie, 250 HCW in all).
The ILI date was defined as the day of first ILI presentation. The date of symptomatic presentation was defined as the date of first signs or symptoms. For influenza cases, the most plausible date of infection was established individually. Categorical variables were described as number (%) and compared by χ 2 test or Fischer exact test. Continuous variables were described as median (interquartile range [IQR]) and compared by Mann-Whitney U-test or Wilcoxon test. Factors associated with asymptomatic influenza or paucisymptomatic/symptomatic influenza assessed by univariate and multivariate multinomial logistic regression were absence of influenza and were the reference category. Tested variables were: age category (<30 years, 30–39 years, ≤40 years), sex, number of adults in the household (1, 2, ≥3), number of children in the household (0, 1, ≥2), profession (medical doctor, nurse, nursing auxiliary, other), and type of unit (medicine, surgery, pediatrics/gynecology-obstetrics, intensive care unit and emergency, other). After univariate analysis, variables with P-value < .10 in univariate analysis were entered in multivariate logistic regression analysis. A backward stepwise model was then fitted until all P-values were < .05. P < .05 was considered significant. All of the tests were 2-tailed. EpiData Entry was used for data entry, and Stata 13·0 (StataCorp. LP) was used for data analysis. The synthesis is reported according to the Strobe checklist (Supplementary Table 1) [20].
Ethics
The study was approved by the Regional Ethics Committee (31 August 2016, Comité de protection des Personnes Sud-Est II), the French National Agency for Medicine and Health Product Safety (12 August 2016, Agence Nationale des Produits de Santé) and conformed to the reference methodology MR-001 of the French Data Protection Authority (Commission Nationale de l’Informatique et des Libertés).
RESULTS
Overall Population
Overall, 289 volunteer HCW were included. Six were excluded because at least 1 consultation was missed and 5 for other study issues (Figure 1). The final analysis included 278 HCW, accounting for 30 415 person-days of follow-up. The female/male ratio was 5.3 (234/278, 84.2% female), and the median age was 36 years (IQR: 29–47 years, Table 1). Characteristics differed by study center for sex, age, and professional activity (P < .001, P = .002, P < .001, respectively, Supplementary Table 2). Influenza vaccination coverage in 2016–2017 was 49.6%, was higher in men than in women (70.5% vs 45.7%, respectively, P = .003) and varied by profession (90.3%, 38.1%, and 37.8%, respectively, among medical doctors, nurses, and other professions, P < .001).
Characteristics of Healthcare Workers at Enrollment, the Asymptomatic Flu Project (AFP) Cohort, N = 278
| Characteristics, No. / No. With Data (%)a | Overall Population |
|---|---|
| Hospital | |
| A | 55/278 (19·8) |
| B | 60/278 (21·6) |
| C | 51/278 (18·4) |
| D | 58/278 (20·9) |
| E | 54/278 (19·4) |
| Age, y, median (IQR) | 36 (29–47) |
| Sex | |
| Female | 234/278 (84·2) |
| Male | 44/278 (15·8) |
| Family home | |
| Number of children, median (IQR) | 0 (0–2) |
| Number of adults, median (IQR) | 2 (1–2) |
| Number of individuals, median (IQR) | 3 (2–4) |
| Profession | |
| Medical doctor | 62/278 (22·3) |
| Nurse | 134/278 (48·2) |
| Nursing auxiliary, other | 82/278 (29·5) |
| Type of unit | |
| Medicine | 146 (52·5) |
| Surgery | 30 (10·8) |
| Pediatrics, gynecology-obstetrics | 33 (11·9) |
| Intensive care unit | 40 (14·4) |
| Emergency, other | 29 (10·4) |
| Vaccinated against influenza virus | |
| 2013–2014 | 106 /270 (39·3) |
| 2014–2015 | 114/276 (41·3) |
| 2015–2016 | 117/277 (42·2) |
| 2016–2017 | 138/278 (49·6) |
Abbreviation: IQR, interquartile range.
aOtherwise specified.
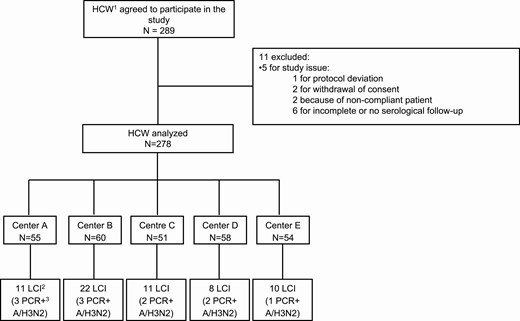
Flow-chart of study enrollment in the Asymptomatic Flu Project (AFP) cohort. Abbreviations: HCW, healthcare workers; LCI, laboratory confirmed influenza; PCR+, polymerase chain reaction positive.
Virologic Findings
Sixty-two (22.3%, 95% CI: 17.4%–27.2%) HCW had evidence of influenza A based on the case definition during follow-up. No influenza B was detected by PCR in the study population. On a national level, >99% influenza strains were influenza A during the 2016–2017 season [18]. Among the 62 confirmed influenza, 7 (11.3%) were diagnosed according to PCR, 51 (82.3%) according to serology, and 4 (6.7%) according to PCR and serology. Anti-A antibodies increased between periods in asymptomatic HCW (P < 10−3) as well as paucisymptomatic or symptomatic HCW (P < 10−3) with confirmed influenza, as shown in Figure 2. We detailed virological findings in Supplementary Table 3. Some heterogeneity was found between sites (Supplementary Table 2).
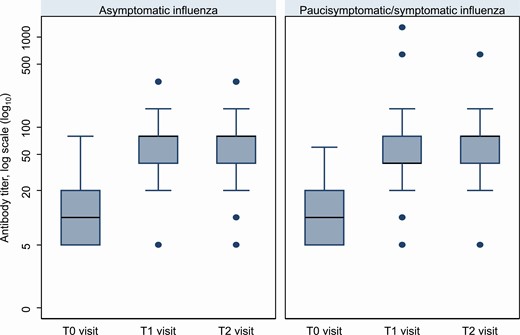
Influenza antibody titer by consultation in HCW with asymptomatic and paucisymptomatic/symptomatic influenza, by consultation (T.0, T.1, T.2), the Asymptomatic Flu Project (AFP) cohort, N = 278. Overall median anti-A antibody level was 1·6 log10 (IQR: 1–1.9, minimum: 0·7, maximum: 3·7), it was 1·3 log10 (IQR: 0.7–1.9) at the T.0 consultation, 1·6 log10 (IQR: 1·0–2·2) at the T.1 consultation, and 1·6 log10 (IQR: 1–2.1) at the T.2 consultation. Anti-A antibodies increased between periods in asymptomatic HCW (P < 10−3) as well as paucisymptomatic or symptomatic HCW (P < 10−3) with confirmed influenza. Abbreviations: HCW, healthcare worker; IQR, interquartile range.
Incidence of Asymptomatic and Symptomatic Influenza
Among HCW with influenza, 46.8% (95% CI: 34.2%–59.4%, n = 29) presented with asymptomatic influenza, 41.9% (95% CI: 29.5%–54.4%, n = 26) had paucisymptomatic influenza, and 11.3% (95% CI: 3.3%–19.3%, n = 7) presented with symptomatic influenza. Most (80.6%) influenza infections occurred before the T.1 consultation. Among HCW with positive influenza PCR, 8 (72.7%) were detected at T.1, 2 (18.2%) at T.s, and 3 (27.3%) at T.2. The cumulative incidence of laboratory-confirmed influenza (LCI) did not differ between vaccinated and unvaccinated HCW (20.3% vs 24.3%, respectively, P = .38, Table 2).
Characteristics of Healthcare Workers With Confirmed Influenza, the Asymptomatic Flu Project (AFP) Cohort, N = 62
| Clinical Presentation | Overall | Vaccinated HCWs | Unvaccinated HCWs |
|---|---|---|---|
| Number of HCWs with influenza | N = 62 | N = 28 | N = 34 |
| Asymptomatic influenza, N (%) | 29/62 (46·8) | 17/28 (60·7) | 12/34 (35·3) |
| Paucisymptomatic influenza | 26/62 (41·9) | 10/28 (35·7) | 16/34 (47·1) |
| Symptomatic influenza | 7/62 (11·3) | 1/28 (3·6) | 6/34 (17·6) |
Abbreviation: HCW, healthcare worker.
Table 3 details the proportions of HCW presenting influenza and cumulative incidences according to the main characteristics of HCW. Global cumulative influenza incidence was 22.3% (95% CI: 17.7%–27.5%). Cumulative incidence of asymptomatic influenza was 10.4% (95% CI: 6.9%–14.0%), 9.4% (95% CI: 5.9%–12.8%) for paucisymptomatic influenza, and 2.5% (95% CI: .7%–4.4%) for symptomatic influenza. Some heterogeneity was found depending on patient characteristics (Supplementary Figures 1, 2).
Proportion of Healthcare Workers (HCW) Presenting Influenza and Cumulative Incidence of Influenza, the Asymptomatic Flu Project (AFP) Cohort, N = 278
| Characteristics | No. Influenza Cases / No. HCW (%) | Relative Distribution, per 100 HCW Presenting Influenza | Cumulative Incidence of Influenza, per 100 HCW | ||||
|---|---|---|---|---|---|---|---|
| Asymptomatic | Paucisymptomatic | Symptomatic | Asymptomatic | Paucisymptomatic | Symptomatic | ||
| Overall | 62/278 (22) | 46.8% | 41.9% | 11.3% | 10.4% | 9.4% | 2.5% |
| Age category | |||||||
| <30 y | 15/80 (19) | 40.0% | 46.7% | 13.3% | 7.5% | 8.8% | 2.5% |
| 30–39 y | 18/90 (20) | 44.4% | 33.3% | 22.2% | 8.9% | 6.7% | 4.4% |
| ≥40 y | 29/108 (27) | 51.7% | 44.8% | 3.5% | 13.9% | 12.0% | 0.9% |
| Sex | |||||||
| Male | 11/44 (25) | 72.7% | 0% | 27.3% | 18.2% | 0% | 6.8% |
| Female | 51/234 (22) | 41.2% | 51.0% | 7.8% | 9.0% | 11.1% | 1.7% |
| No. of other adults in the household | |||||||
| 1 | 12/70 (17) | 33.3% | 41.7% | 25.0% | 5.7% | 7.1% | 4.3% |
| 2 | 33/152 (22) | 45.5% | 42.4% | 12.1% | 9.9% | 9.2% | 2.6% |
| ≥3 | 16/55 (29) | 62.5% | 37.5% | 0% | 18.2% | 10.9% | 0% |
| No. of children in the household | |||||||
| 0 | 37/155 (24) | 43.2% | 46.0% | 10.8% | 10.3% | 11.0% | 2.6% |
| 1 | 11/47 (23) | 45.4% | 36.4% | 18.2% | 10.6% | 8.5% | 4.3% |
| ≥2 | 13/75 (17) | 61.5% | 30.8% | 7.7% | 10.7% | 5.3% | 1.3% |
| Profession | |||||||
| Medical doctor | 8/62 (13) | 75.0% | 0% | 25.0% | 9.7% | 0% | 3.2% |
| Nurse | 31/134 (23) | 38.7% | 54.8% | 6.5% | 9.0% | 12.7% | 1.5% |
| Nursing auxiliary, other | 23/82 (28) | 47.8% | 39.1% | 13.0% | 13.4% | 11.0% | 3.7% |
| Type of unit | |||||||
| Medicine | 29/146 (20) | 37.9% | 44.8% | 17.2% | 7.5% | 8.9% | 3.4% |
| Surgery | 8/30 (27) | 50.0% | 50.0% | 0% | 13.3% | 13.3% | 0% |
| Pediatrics, gynecology-obstetrics | 4/33 (12) | 100.0% | 0% | … | 12.1% | 0% | … |
| Intensive care unit | 13/40 (33) | 69.2% | 15.4% | 15.4% | 22.5% | 5.0% | 5.0% |
| Emergency, other | 8/29 (28) | 12.5% | 87.5% | 0% | 3.5% | 24.1% | 0% |
| Vaccinated against influenza, 2015–2016 | |||||||
| No | 43/160 (27) | 41.9% | 46.5% | 11.6% | 11.3% | 12.5% | 3.1% |
| Yes | 19/117 (16) | 57.9% | 31.6% | 10.5% | 9.4% | 5.1% | 1.7% |
| Vaccinated against influenza, 2016–2017 | |||||||
| No | 34/140 (24) | 35.3% | 47.1% | 17.7% | 8.6% | 11.4% | 4.3% |
| Yes | 28/138 (20) | 60.7% | 35.7% | 3.6% | 12.3% | 7.3% | 0.7% |
Characteristics Associated With the Clinical Presentation of Influenza
The most frequent symptoms among HCW with paucisymptomatic or symptomatic influenza were rhinorrhea, cough, and sneeze during the T.0–T.1 period (68%, 64%, and 56%, respectively) and rhinorrhea, cough, and headache during the T.1–T.2 period (55%, 45%, and 36%, respectively). Fever was present in <10% of all influenza cases. After univariate multinomial logistic regression, compared to the noninfluenza HCWs, the risk of asymptomatic influenza and the risk of paucisymptomatic/symptomatic influenza was not associated with sex, age category, number of children in family, or vaccinal status in 2016–2017 (P > .10 for all). Working in an intensive care unit (crude odds ratio [cOR] = 3·5, 95% CI: 1.3–9.4) and the presence ≥3 adults in a family (cOR = 3·7, 95% CI: 1.1–12.7) were associated with an increased risk of asymptomatic influenza but not with paucisymptomatic/symptomatic influenza. The professions of nurse (cOR = 5·0, 95% CI: 1.1–22.2), auxiliary nursing or other (cOR = 5·5, 95% CI: 1.2–25.7) were associated with an increased risk of paucisymptomatic/symptomatic influenza, whereas previous influenza vaccination in 2015–2016 (cOR = 0·4, 95% CI: .2–.93) was protective.
In multivariate multinomial logistic regression including adjustment on centers, working in an intensive care unit (adjusted [a]OR = 5·2, 95% CI: 1.8–15.2), and the presence of ≥3 adults in a family (aOR = 2·6, 95% CI: 1.1–6.6) were independently associated with an increased risk of asymptomatic influenza. The professions of nurse (aOR = 5·1, 95% CI: 1.1–24.2), auxiliary nursing or other (aOR = 6·6, 95% CI: 1.3–33.3) and working in an emergency unit or another unit (aOR = 3·1, 95% CI: 1.0–9.3) were independently associated with an increased risk of paucisymptomatic/symptomatic influenza, whereas the presence of ≥2 children in a family was independently associated with decreased risk (aOR = 0·3, 95% CI: .1–.9).
Discussion
The main objective of this multicenter prospective study was to determine the incidence of asymptomatic, paucisymptomatic, and symptomatic influenza among HCW in short-stay hospital wards. We found that influenza was frequent in this population because 22.3% (95% CI: 17.4%–27.2%) of HCW had a documented influenza infection during a single winter season. Most influenza infections were either asymptomatic (46.8%, 95% CI: 34.2%–59.4%) or paucisymptomatic (41·9%, 95% CI: 29.5%–54.4%). Similar to what was reported in the community during the 2016–2017 influenza epidemic, all of the influenza cases that were identified were influenza A (H3N2) [18].
These results confirm the importance of atypical clinical presentation of influenza, as previously suggested [21]. For example, in a retrospective study of 518 HCW initially included in a serological surveillance following vaccination against hepatitis, 120 subjects had recent influenza seroconversion. Among them, 71 (59%) had no memory of influenza, and 32 (28%) subjects found no notion of any respiratory infection in the previous months. The higher proportion of asymptomatic and paucisymptomatic influenza identified in our study could be explained in part by a lower rate of classification bias owing to the prospective collection of symptoms [21]. A systematic review of 11 outbreak or epidemic investigations based on LCI found a pooled mean of asymptomatic cases of 16% (95% CI: 13%–19%) with low heterogeneity (I2 = 0%) [22]. In a community-based cohort study, the proportion of asymptomatic cases was 11%, with 32% influenza A (H3N2) [23]. The authors also found that the mean levels of influenza viral RNA shedding were similar between asymptomatic and symptomatic influenza A (H3N2) cases. These findings and ours suggest the potential risk of transmission through asymptomatic influenza cases.
In the present study, <10% of HCW with LCI had fever. In current practice, fever is often a criteria for sick leave among HCW with influenza symptoms [17], but it can be too restrictive. The most frequent symptoms among HCW with paucisymptomatic or symptomatic confirmed influenza are rhinorrhea or cough. These clinical signs may suggest a common cold interpreted by HCW as a mild infection that does not require sick leave. Moreover, if the proportion of asymptomatic patients depends on the proportion of the immunized population, it can also be skewed by taking antipyretics or other drugs that may mask the classic influenza V on the temperature curve—sometimes the only clinical sign of infection [14]. The consequence of asymptomatic influenza presentation is a risk of cross-transmission between HCW and hospitalized patients [12] or between HCW themselves. Indeed, an asymptomatic HCW would be able to transmit the virus to both patients and colleagues. He or she can expose hospitalized patients to severe forms, which may in turn generate secondary infections. If the HCW index case is asymptomatic, the first chain of transmission would not be identified. The first step should therefore focus on accurate diagnosis and infection control measures when an HCW presents atypical symptoms for which influenza could be the etiological agent.
The main strength of our study includes the multicenter design that increases the external validity of the results, prospective collection of clinical samples, epidemiological data, and the active follow-up implemented in each center with weekly contact of volunteers by telephone. Potential classification bias was limited by the prospective design and virological testing performed at the national reference center for influenza.
Some limitations should also be noted. First, because of the precocity of the influenza outbreak, the majority of cases were detected by serological test and only 11 by PCR. In practice, virological diagnosis is performed on a respiratory sample such as nasopharyngeal swab and not by serology testing. Another limitation is that the study was performed during a single influenza season. There may be a variation in circulating strains according to the outbreak but also to the geographical location.
Conclusions
In conclusion, asymptomatic influenza is frequent among HCW. They can be a potential source of transmission to hospitalized patients, especially frail patients and to other colleagues. Paucisymptomatic influenza represents the main burden of influenza among HCW. The classic definition of nosocomial influenza should therefore be reassessed because it does not consider atypical forms of influenza [24]. Future studies could evaluate the role of HCW or even patients with asymptomatic and paucisymptomatic influenza in the transmission/spread of influenza in healthcare settings and the efficiency of additional infection control measures to limit influenza transmission from asymptomatic HCW.
Supplementary Data
Supplementary materials are available at Clinical Infectious Diseases online. Consisting of data provided by the authors to benefit the reader, the posted materials are not copyedited and are the sole responsibility of the authors, so questions or comments should be addressed to the corresponding author.
Notes
Members of the AFP Study Group. Pr Marc Bardou (Centre d’Investigation Clinique, CHU de Dijon, Dijon); Dr Jean-Baptiste Bour (Laboratoire de Sérologie-Virologie, CHU de Dijon, Dijon); Pr Luc Fontana (Service de médecine et santé au travail, CHU de Saint-Etienne); Dr Marie-Reine Mallaret (Service d’hygiène hospitalière, CHU Grenoble Alpes, Grenoble); Dr Julien Lupo (Laboratoire de Virologie, CHU Grenoble Alpes, Grenoble); Pr Patrice Morand (Laboratoire de Virologie, CHU Grenoble Alpes, Grenoble); Pr Pierre Pothier (Laboratoire de virologie, CHU de Dijon, Dijon); Pr Bruno Pozzetto (Laboratoire de Bactériologie-Virologie, Hôpital Nord, CHU de Saint-Étienne, Saint-Etienne); Dr Olivier Robert (retired from Service de médecine et santé au travail, Hôpital Edouard Herriot, Hospices Civils de Lyon, Lyon); Pr Henri Jacques Smolik (Service de médecine du travail et pathologies professionnelles, Centre hospitalier universitaire de Dijon).
Author contributions. S. A.T. B. and P. V. had full access to all of the data in the study and take responsibility for the integrity of the data and the accuracy of the data analysis.
Concept and design. T. B., M. S.-E., B. L., M. V., P. V.
Acquisition, analysis, or interpretation of data. All Authors.
Drafting of the manuscript. S. A., T. B., P. V.
Critical revision of the manuscript for important intellectual content. All Authors.
Statistical analysis. S. A., T. B., P. V.
Obtained funding. T. B.,M. S.-E., P. V.
Administrative, technical, or material support. L. S. A.-G., S. A., K. A., P. B., M.-A. D., J. G., C. L., B. L., A. P., S. P., M. V.
Supervision. T. B., P. V.
Acknowledgments. The authors thank the participating healthcare workers from Lyon, Saint-Etienne, Grenoble and Dijon University Hospitals. The authors thank Véronique Robin (RN) for patient inclusion, data collection and computing. They also thank the participating research healthcare workers from Lyon, Saint-Etienne, Grenoble, and Dijon University Hospitals.
Disclaimer. The funders had no role in the design and conduct of the study, collection, management, analysis, and interpretation of the data; preparation, review, or approval of the manuscript; and decision to submit the manuscript for publication.
Financial support. This work was supported by the French Ministry of Health (Ministère des Solidarités et de la Santé, France) in a Programme Hospitalier de Recherche Clinique Interrégional (PHRC-I).
Potential conflicts of interest. C. L. reports advisory board fees from Becton Dickinson France, outside the submitted work. All other authors report no potential conflicts. All authors have submitted the ICMJE Form for Disclosure of Potential Conflicts of Interest. Conflicts that the editors consider relevant to the content of the manuscript have been disclosed.
References
Author notes
T. B. and S. A. contributed equally.
Study group listed in the acknowledgment section.

