


Abstract
Sepsis disproportionately affects allogeneic hematopoietic cell transplant (HCT) recipients and is challenging to define. Clinical criteria that predict mortality and intensive care unit end-points in patients with suspected infections (SIs) are used in sepsis definitions, but their predictive value among immunocompromised populations is largely unknown. Here, we evaluate 3 criteria among allogeneic HCT recipients with SIs.
We evaluated Systemic Inflammatory Response Syndrome (SIRS), quick Sequential Organ Failure Assessment (qSOFA), and National Early Warning Score (NEWS) in relation to short-term mortality among recipients transplanted between September 2010 and July 2017. We used cut-points of ≥ 2 for qSOFA/SIRS and ≥ 7 for NEWS and restricted to first SI per hospital encounter during patients’ first 100 days posttransplant.
Of the 880 recipients who experienced ≥ 1 SI, 58 (6.6%) died within 28 days and 22 (2.5%) within 10 days of an SI. In relation to 10-day mortality, SIRS was the most sensitive (91.3% [95% confidence interval {CI}, 72.0%–98.9%]) but least specific (35.0% [95% CI, 32.6%–37.5%]), whereas qSOFA was the most specific (90.5% [95% CI, 88.9%–91.9%]) but least sensitive (47.8% [95% CI, 26.8%–69.4%]). NEWS was moderately sensitive (78.3% [95% CI, 56.3%–92.5%]) and specific (70.2% [95% CI, 67.8%–72.4%]).
NEWS outperformed qSOFA and SIRS, but each criterion had low to moderate predictive accuracy, and the magnitude of the known limitations of qSOFA and SIRS was at least as large as in the general population. Our data suggest that population-specific criteria are needed for immunocompromised patients.
(.)
Allogeneic hematopoietic stem cell transplant (HCT) recipients are 8 times more likely to develop sepsis than non-HCT patients and are at greater risk of adverse health outcomes following false or missed sepsis diagnoses [1, 2]. In the event of missed or delayed sepsis detection, allogeneic HCT recipients are more likely to die of sepsis than non-HCT recipients, and their estimated case fatality is > 50% [2]. Early antibiotic initiation is essential to sepsis management, and each hour of delayed antibiotic administration is associated with a 4% increased odds of mortality [3, 4]. Conversely, broad-spectrum antibiotic use is associated with increased resistance, and among allogeneic HCT recipients, microbiota-mediated detrimental effects linked to increased morbidity and mortality [5–7]. The mortality risk of sepsis among HCT recipients and the disparate impact that additional broad-spectrum antibiotic use has on this population indicate the need for accurate sepsis diagnoses in this medically complex population.
Unfortunately, early diagnosis of sepsis is challenging. Clinical criteria and scores, such as the National Early Warning Score (NEWS) and the Systemic Inflammatory Response Syndrome (SIRS), have been shown to predict mortality and intensive care unit (ICU) end-points in patients with suspected infections and for that reason have been adopted as clinical criteria for sepsis. Though such criteria are recommended for sepsis diagnosis and inform sepsis treatment, the criteria suffer from predictive limitations that lead to either missed sepsis events and high mortality risk (poor sensitivity) or unneeded broad-spectrum antibiotic use (poor specificity) [8–13]. To date, the majority of the research validating these criteria among patients with suspected infections has been performed among general emergency room and ICU patients and their value for high-risk, immunocompromised populations, such as allogeneic HCT recipients, is poorly characterized [14].
Understanding the predictive value of these criteria in HCT recipients is crucial because of the distinct challenge sepsis diagnosis poses in this population. Following transplantation, sepsis presents differently and progresses more rapidly than in the general, immunocompetent population [1]. Furthermore, common complications of HCT, such as engraftment syndrome, anemia, transfusion reactions, idiopathic pneumonia syndrome, acute kidney injury, and drug side effects, can present similarly to sepsis and are likely to reduce the predictive accuracy of currently available clinical criteria [15–18]. For these reasons, accuracy estimates generated among general patient populations may be inaccurate and be a basis for poor sepsis management among allogeneic HCT recipients.
We evaluated 3 commonly used clinical criteria (qSOFA, SIRS, and NEWS) among allogeneic HCT recipients with suspected infections in relation to 10-day and 28-day mortality end-points. Given evidence that NEWS predicts short-term mortality more accurately in emergency room patients and the larger number of factors included in NEWS (7) in comparison to qSOFA (3) or SIRS (4), we hypothesized that NEWS would be more accurate than SIRS and qSOFA [8, 10, 19, 20].
METHODS
Study Design and Population
We performed a retrospective analysis among adult allogeneic HCT recipients with suspected infections who received their first transplant at the Seattle Cancer Care Alliance (SCCA)/Fred Hutchinson Cancer Research Center (FHCRC) between 1 September 2010 and 31 July 2017. Per institutional standard practice, each recipient was observed daily for 100 days posttransplant or until death, and data from this follow-up period were examined. We excluded patients who opted out of research participation, patients who received their transplant outside of the SCCA/FHCRC, and individuals who did not experience a suspected infection event (Figure 1). The study was approved by the FHCRC Institutional Review Board.
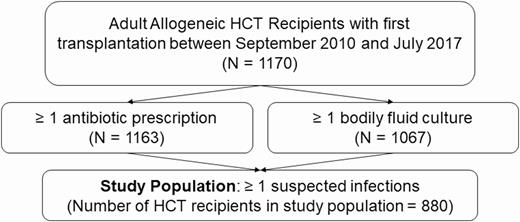
Flowchart of the hematopoietic cell transplant recipient study population. Suspected infection was defined as a body fluid culture plus a new antibiotic within 24 hours, if the antibiotic was prescribed first, or 72 hours, if the culture was obtained first. Abbreviation: HCT, hematopoietic cell transplant.
Cohort Development
The following analyses were performed on the patient-infection level. The primary cohort included the first suspected infection from all inpatient and outpatient hospital encounters experienced during follow-up. Inpatient encounters were inclusive of ICU stays and were defined as the full calendar day of admission through the full day of discharge (Figure 2). We developed secondary inpatient-identified and outpatient-identified suspected infection cohorts.
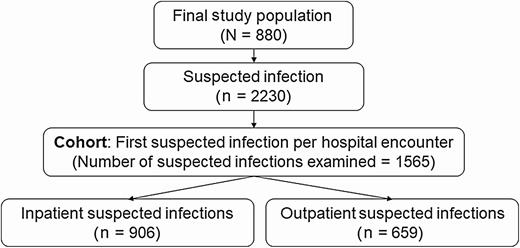
Flowchart of suspected infections experienced by study population and included in the primary cohort. Suspected infection was defined as a body fluid culture plus a new antibiotic within 24 hours, if the antibiotic was prescribed first, or 72 hours, if the culture was obtained first. The suspected infections included in the cohort were divided into outpatient and inpatient based on the location of culture collection.
Data Collection and Cleaning
Data were extracted from prospectively collected databases maintained by FHCRC that include demographic, laboratory, and clinical data. Additional data were collected directly from electronic medical records, including hospital admission dates, vital signs, and prescription data results. We defined outliers as biologically implausible measures and performed medical chart review on a randomly selected 10%. Outliers were infrequent (accounting for ≤ 0.1% of measurement records) and we found no inconsistencies between the medical records and the database records; all outliers were removed from the data (data not shown).
All variables extracted from clinical records were numeric except for white blood cell count and oxygen saturation measurements; these variables were infrequently reported as less or greater than categories. For our analyses, less or greater than observations were converted to the first included number of the statement (eg, if ≤ 91, 91 was used). Nonoral temperatures were standardized to oral temperatures by subtracting 0.2°C from arterial and rectal temperatures and adding 0.45°C to axillary temperatures [21].
Antimicrobial Prophylaxis and Empiric Management Protocols
Neutropenic recipients (absolute neutrophil count < 500 cells/μL) were placed on levofloxacin 750 mg once daily and recipients with neutropenic fever were preferentially given ceftazidime, cefepime, or meropenem as primary therapy; vancomycin was added by standard practice guidelines if patients had mucositis or evidence of central line infection or at the discretion of the physician. Patients received trimethoprim-sulfamethoxazole, dapsone, or atovaquone as primary prophylaxis for Pneumocystis jirovecii. Fluconazole was used as fungal prophylaxis, unless patients had known pretransplant fungal infection or idiopathic pulmonary nodules, for which they received more directed therapy [22].
Though center guidelines recommended the collection of aerobic and anaerobic blood cultures in patients with fever, blood cultures were ultimately drawn at the discretion of healthcare teams. Surveillance blood cultures were routinely drawn per protocol from patients treated with high-dose glucocorticoids (> 0.5 mg/kg). These surveillance cultures were drawn biweekly while inpatient, weekly on outpatient discharge, and were discontinued following tapering of glucocorticoids to < 0.5 mg/kg [23]. Most blood cultures were drawn through central venous catheters.
Criteria and Outcome Definition
We evaluated 3 clinical criteria among allogeneic HCT recipients with suspected infections in relation to short-term mortality. In agreement with Seymour et al’s evaluation of Sepsis-3 definitions, we defined “suspected infections” as a new antibiotic and a body fluid (blood, cerebrospinal fluid, urine, etc) culture within 24 hours if the antibiotic was prescribed first or within 72 hours if the culture was obtained first [24]. Suspected infection onset and location were defined based on date, time, and location of culture collection. We defined a new antibiotic as any (oral or intravenous) antibiotic that had not been prescribed or administered within the last 3 days. Because we wanted to evaluate distinct suspected infections, we dropped follow-up cultures, or continuously collected cultures for the 14 days following a positive culture.
Single, normal value imputation of missing measurements was performed as is standard in sepsis criteria evaluation and reflects clinicians’ use of the tools [24–27]. Maximum scores were calculated for the 24 hours following the onset of suspected infection and patients who met a tool’s cutoff were said to have screening tool–defined sepsis [28]. SIRS events were defined as patients meeting at least 2 of the following: temperature > 38°C or < 36°C, heart rate > 90 beats/minute, respiratory rate > 20 breaths/minute or partial pressure of carbon dioxide < 32 mm Hg (4.3 kPa), or white blood cell count > 12 000 cells/μL or < 4000 cells/μL or > 10% immature bands [20]. qSOFA events were defined as patients meeting at least 2 of the following: Glasgow Coma Scale (GCS) score < 15, respiratory rate of ≥ 22 breaths/minute, or systolic blood pressure of ≤ 100 mm Hg [8]. NEWS events were defined as patients scoring a 7 or more on the defined NEWS scoring system [19]. Fewer than 100 APVU (alert, verbal, pain, and unresponsive) measures were available and, in alignment with Brink et al, we substituted the presence of V (voice), P (pain), or U (unresponsive) with a GCS score of < 15 [10].
Our primary outcomes were 10-day and 28-day mortality, defined as death by any cause within 10 or 28 days of suspected infection onset.
Statistical Approach
Population characteristics were summarized by clinical criteria. Predictive accuracy was estimated using sensitivity, specificity, negative predictive value (NPV), positive predictive value (PPV), negative likelihood ratio (NLR), and positive likelihood ratio (PLR). The predictive accuracy metrics were manually estimated and 95% confidence intervals (CIs) were generated. Receiver operating characteristic curves were estimated using a stepwise function and the maximum thresholds were selected using the Youden index method [29]. We did not compare area under the curve estimates because the criteria comprise counts of biological events rather than an underlying continuum of risk. All analyses were performed using R software version 3.5.3 base functions and functions from the fbroc and epiR packages [30–32].
Sensitivity Analysis
We evaluated the impact of conceptual outcome misclassification (differential and nondifferential) using probabilistic bias analysis (PBA) (Supplementary Figure 1) and evaluated the robustness of our findings by varying how we handled missing data (complete case, restricted case, and pattern-mixture models), the window of time around suspected infection onset, and loosening our culture definition. A detailed description of the sensitivity analyses can be found in the Supplementary Data.
RESULTS
Between 1 September 2010 and 31 July 2017, we identified 1170 HCT recipients, including 880 (75.2%) who experienced at least 1 suspected infection and made up our sample population (Figure 1). During posttransplant follow-up, these patients experienced 2230 suspected infections (Figure 2), of which 1565 (70.6%) were the first suspected infection for a unique inpatient or outpatient hospital encounter and made up our primary cohort.
Table 1 outlines demographic and transplant characteristics for all patients with suspected infections and by clinical criteria. The median age at transplant was 53.4 (interquartile range, 21.1 [range, 19–80]) years, and 57.5% were male. Most patients were non-Hispanic white (78.4%) or Asian (7.6%). Ninety-four (10.7%) patients died during follow-up, of whom 58 (61.7%) died within 28 days and 22 (23.4%) within 10 days of a suspected infection.
Demographic and Transplant Characteristics of Hematopoietic Cell Transplant Recipients
| Characteristic | Suspected Infection (n = 880) | SIRS Sepsis Eventa (n = 747) | qSOFA Sepsis Eventa(n = 136) | NEWS Sepsis Eventa(n = 388) |
|---|---|---|---|---|
| Age at transplant, median (IQR), y | 53.4 (21.06) | 52.6 (21.69) | 49.5 (21.94) | 51.6 (23.56) |
| Male sex, No. (%) | 506 (57.5) | 420 (56.2) | 72 (52.9) | 207 (53.4) |
| Race/ethnicity, No. (%) | ||||
| American Indian/Alaska Nativeb | 15 (1.7) | 13 (1.7) | 3 (2.2) | 7 (1.8) |
| Asianb | 67 (7.6) | 59 (7.9) | 13 (9.6) | 39 (10.1) |
| Blackb | 19 (2.2) | 18 (2.4) | 8 (5.9) | 11 (2.8) |
| Hispanic | 42 (4.8) | 38 (5.1) | 9 (6.6) | 23 (5.9) |
| Multipleb | 12 (1.4) | 11 (1.5) | 3 (2.2) | 9 (2.3) |
| Native Hawaiian or other Pacific Islanderb | 18 (2) | 15 (2) | 6 (4.4) | 8 (2.1) |
| Unknownb | 17 (1.9) | 14 (1.9) | 3 (2.2) | 7 (1.8) |
| Non-Hispanic white | 690 (78.4) | 579 (77.5) | 91 (66.9) | 284 (73.2) |
| Donor type, No. (% unrelated) | 619 (70.3) | 526 (70.4) | 96 (70.6) | 278 (71.6) |
| Donor cell type, No. (%) | ||||
| Bone marrow | 81 (9.2) | 67 (9) | 13 (9.6) | 37 (9.5) |
| Bone marrow, peripheral blood stem cells | 2 (0.2) | 2 (0.3) | 28 (20.6) | 1 (0.3) |
| Human cord blood | 112 (12.7) | 102 (13.7) | 95 (69.9) | 66 (17) |
| Peripheral blood stem cells | 685 (77.8) | 576 (77.1) | 0 (0) | 284 (73.2) |
| Follow-up time, median (IQR) | 100 (4) | 100 (4) | 100 (9.25) | 100 (7) |
| Died during follow-up, No. (%) | 94 (10.7) | 85 (11.4) | 32 (23.5) | 69 (17.8) |
Abbreviations: IQR, interquartile range; NEWS, National Early Warning Score; qSOFA, quick Sequential Organ Failure Assessment; SIRS, Systemic Inflammatory Response Syndrome.
aPatients experienced at least 1 of these events during follow-up.
bNon-Hispanic.
Figures 3 and 4 display the frequency of criteria score by clinical measure, the overall distribution of the criteria scores, and the distribution of scores by mortality outcome. Respiratory rate was the most frequently met qSOFA measure but the least frequently met SIRS measure. The most frequently met SIRS measure was heart rate, and oxygen saturation was the most abnormal (most scores of 3) NEWS measure (Figure 3). The most common scores for SIRS, qSOFA, and NEWS were 2 (30.7%), 0 (60.5%), and 1 (13.1%) (Figure 4).
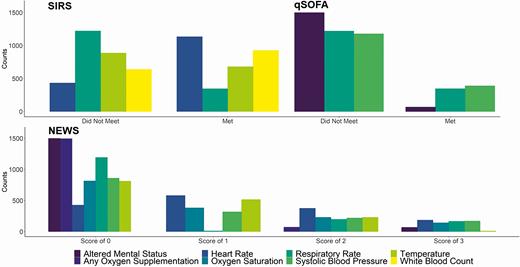
Frequency of clinical criteria scores among allogeneic hematopoietic cell transplant recipients following single, normal value imputation. Abbreviations: NEWS, National Early Warning Score; qSOFA, quick Sequential Organ Failure Assessment; SIRS, Systemic Inflammatory Response Syndrome.
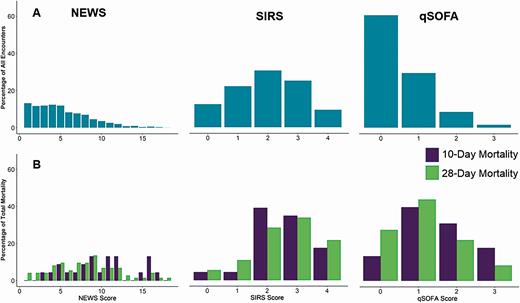
Distribution of National Early Warning Score (NEWS), quick Sequential Organ Failure Assessment (qSOFA), and Systemic Inflammatory Response Syndrome (SIRS) criteria among allogeneic hematopoietic cell transplant recipients with suspected infections (A) and by 10-day and 28-day mortality (B), following single, normal value imputation. Scoring systems are represented according to the scale of individual clinical criteria (NEWS, 0–20; SIRS, 0–4; qSOFA, 0–3).
A total of 1023 (65.4%) suspected infections were accompanied by a SIRS score of ≥ 2, 158 (10.1%) with a qSOFA score of ≥ 2, and 478 (30.5%) with a NEWS score of ≥ 7 (Table 2). Demographic and transplant characteristics for patients who met sepsis definitions were similar to characteristics of the full population (Table 1). However, a greater portion of patients who met qSOFA (23.5%) and/or NEWS (17.8%) sepsis definitions died during follow-up than patients who met SIRS sepsis definition (11.4%) or the full study population (10.7%).
Number of Suspected Infections (Cohort Size), Criteria-Specific Suspected Infections, and Sepsis Events in Total and by Inpatient/Outpatient Status
| Event | Unique Individuals, No.a | Individuals With Criteria-defined Sepsis Event, % | Unique Events, No. | Suspected Infections Identified as Criteria-Defined Sepsis, % |
|---|---|---|---|---|
| All events | ||||
| Suspected infection | 880 | … | 1565 | … |
| SIRS | 747 | 84.9 | 1023 | 65.4 |
| qSOFA | 136 | 15.5 | 158 | 10.1 |
| NEWS | 388 | 44.1 | 478 | 30.5 |
| Inpatient events | ||||
| Suspected infection | 747 | … | 906 | … |
| SIRS | 619 | 82.9 | 689 | 76.0 |
| qSOFA | 97 | 13.0 | 107 | 11.8 |
| NEWS | 289 | 38.7 | 316 | 34.9 |
| Outpatient events | ||||
| Suspected infection | 426 | … | 659 | … |
| SIRS | 268 | 62.9 | 334 | 50.7 |
| qSOFA | 48 | 11.3 | 51 | 7.7 |
| NEWS | 144 | 33.8 | 162 | 24.6 |
Abbreviations: NEWS, National Early Warning Score; qSOFA, quick Sequential Organ Failure Assessment; SIRS, Systemic Inflammatory Response Syndrome.
aInpatient and outpatient lists are not exclusive, and the same patients may appear in both.
The 10-day and 28-day predictive accuracy metrics and Youden index for each clinical criteria are presented in Table 3 and ROC curves are presented in Figure 5. SIRS had the highest sensitivity in relation to 10-day and 28-day mortality (91.3% [95% CI, 72.0%–98.9%] and 83.8% [95% CI, 73.4%–91.3%], respectively). qSOFA had the highest specificity in relation to 10-day and 28-day mortality (90.5% [95% CI, 88.9%–91.9%] and 90.9% [95% CI, 89.3%–92.3%], respectively). The sensitivity and specificity of NEWS was between that of SIRS and qSOFA for both mortality outcomes. The Youden index differed by patient location for NEWS and SIRS but was consistent for qSOFA in relation to 28-day mortality.
Predictive Accuracy Metrics of Sepsis Criteria in Relation to 10-Day and 28-Day Mortality in Hematopoietic Cell Transplant Recipients With Suspected Infections
| Infection | Sensitivitya, % (95% CI) | Specificitya, % (95% CI) | Youden Threshold |
|---|---|---|---|
| All suspected infections | |||
| 10-day mortality | |||
| SIRS | 91.3 (72.0–98.9) | 35.0 (32.6–37.5) | 2 |
| qSOFA | 47.8 (26.8–69.4) | 90.5 (88.9–91.9) | 1 |
| NEWS | 78.3 (56.3–92.5) | 70.2 (67.8–72.4) | 8 |
| 28-day mortality | |||
| SIRS | 83.8 (73.4–91.3) | 35.5 (33.1–38.0) | 4 |
| qSOFA | 29.7 (19.7–41.5) | 90.9 (89.3–92.3) | 1 |
| NEWS | 64.9 (52.9–75.6) | 71.2 (68.8–73.4) | 7 |
| Inpatient suspected infections | |||
| 10-day mortality | |||
| SIRS | 88.2 (63.6–98.5) | 24.2 (21.4–27.1) | 2 |
| qSOFA | 52.9 (27.8–77.0) | 89.0 (86.7–91.0) | 2 |
| NEWS | 76.5 (50.1–93.2) | 65.9 (62.7–69.0) | 9 |
| 28-day mortality | |||
| SIRS | 87.5 (74.8–95.3) | 24.6 (21.7–27.6) | 4 |
| qSOFA | 37.5 (24.0–52.6) | 89.6 (87.4–91.6) | 1 |
| NEWS | 68.8 (53.7–81.3) | 67.0 (63.8–70.2) | 8 |
| Outpatient suspected infections | |||
| 10-day mortality | |||
| SIRS | 100 (54.1–100) | 49.8 (45.9–53.7) | 3 |
| qSOFA | 33.3 (4.3–77.7) | 92.5 (90.2–94.4) | 1 |
| NEWS | 83.3 (35.9–99.6) | 76.0 (72.5–79.2) | 8 |
| 28-day mortality | |||
| SIRS | 76.9 (56.4–91.0) | 50.4 (46.4–54.4) | 3 |
| qSOFA | 15.4 (4.4–34.9) | 92.6 (90.2–94.5) | 1 |
| NEWS | 57.7 (36.9–76.6) | 76.8 (73.3–80.0) | 5 |
Abbreviations: CI, confidence interval; NEWS, National Early Warning Score; qSOFA, quick Sequential Organ Failure Assessment; SIRS, Systemic Inflammatory Response Syndrome.
aBased on the following prespecified cutpoints: SIRS ≥ 2, qSOFA ≥ 2, NEWS ≥ 7. CIs were estimated using the Clopper-Pearson method.
![The 10-day (A) and 28-day (B) mortality receiver operating characteristic curves for Systemic Inflammatory Response Syndrome (SIRS), quick Sequential Organ Failure Assessment (qSOFA), and National Early Warning Score (NEWS) criteria estimated among hematopoietic cell transplant recipients. The 10-day mortality sensitivity and specificity point values and 95% confidence intervals for each predefined cutpoint (boxes) were as follows: NEWS (sensitivity, 78.3% [56.3%–92.5%] and specificity, 70.2% [67.8%–72.4%]); SIRS (sensitivity, 91.3% [72.0%–98.9%] and specificity, 35.0% [32.6%–37.5%]); and qSOFA (sensitivity, 47.8% [26.8%–69.4%] and specificity, 90.5% [88.9%–91.9%]). The 28-day mortality estimates were as follows: NEWS (sensitivity, 64.9% [52.9%–75.6%] and specificity, 71.2% [68.8%–73.4%]); SIRS (sensitivity, 83.8% [73.4%–91.3%] and specificity, 35.5% [33.1%–38.0%]); and qSOFA (sensitivity, 29.7% [19.7%–41.5%] and specificity, 90.9% [89.3%–92.3%]).](https://oup.silverchair-cdn.com/oup/backfile/Content_public/Journal/cid/72/7/10.1093_cid_ciaa214/1/m_ciaa214f0005.jpeg?Expires=1750221365&Signature=BbzkKPNGT-J11mbbRUcQja22gL2QVfa2M62F34cFqh-GVqwtvr9zNBzx8DAZyTkkLgFwXD5N0AjiOK3bID1DPiluAIjB8I9T4rWseesVw9ziBAuGx5UZn9raUPQ3zG8WTJHS7hNk80S8~BIY-F~1Qn1aBlTTH3m9-j5wVjofIs88Cvf4dgbHQ4HrG0n4Wj0UmCRhGZz6HxpYB00-84IN4Ewx3~n606iAj1YaH4RIgGLlGdOkkS5v00PMuRVTA7QKVLwOB7OIAwzS9wdiVPWosXpL2ndd3PteqAtPjxc7fpGEcNMQeDsS5BuCUfNTtf2QkE1y~rIXWPrIHkHrfmGG~A__&Key-Pair-Id=APKAIE5G5CRDK6RD3PGA)
The 10-day (A) and 28-day (B) mortality receiver operating characteristic curves for Systemic Inflammatory Response Syndrome (SIRS), quick Sequential Organ Failure Assessment (qSOFA), and National Early Warning Score (NEWS) criteria estimated among hematopoietic cell transplant recipients. The 10-day mortality sensitivity and specificity point values and 95% confidence intervals for each predefined cutpoint (boxes) were as follows: NEWS (sensitivity, 78.3% [56.3%–92.5%] and specificity, 70.2% [67.8%–72.4%]); SIRS (sensitivity, 91.3% [72.0%–98.9%] and specificity, 35.0% [32.6%–37.5%]); and qSOFA (sensitivity, 47.8% [26.8%–69.4%] and specificity, 90.5% [88.9%–91.9%]). The 28-day mortality estimates were as follows: NEWS (sensitivity, 64.9% [52.9%–75.6%] and specificity, 71.2% [68.8%–73.4%]); SIRS (sensitivity, 83.8% [73.4%–91.3%] and specificity, 35.5% [33.1%–38.0%]); and qSOFA (sensitivity, 29.7% [19.7%–41.5%] and specificity, 90.9% [89.3%–92.3%]).
Each criteria had high NPV (range, 96.2%–100%) and low PPV (range, 1.8%–16.8%) in relation to both mortality outcomes among all 3 cohorts. The PLR and NLR were significant for each criteria among all examined suspected infections. This significance held for NEWS and qSOFA among inpatient-detected suspected infections for both mortality outcomes, but did not hold in all scenarios for any criteria (Table 4).
Predictive Values and Likelihood Ratios of Sepsis Criteria in Relation to 10-Day and 28-Day Mortality in Hematopoietic Cell Transplant Recipients With Suspected Infections
| Infection | PPVa, % (95% CI) | NPVa, % (95% CI) | PLRa (95% CI) | NLRa (95% CI) |
|---|---|---|---|---|
| All suspected infections | ||||
| 10-day mortality | ||||
| SIRS | 2.1 (1.3–3.1) | 99.6 (98.7–100) | 1.41 (1.23–1.60) | 0.25 (.07–.94) |
| qSOFA | 7.0 (3.5–12.1) | 99.1 (98.5–99.6) | 5.02 (3.19–7.90) | 0.58 (.39–.85) |
| NEWS | 3.8 (2.2–5.9) | 99.5 (98.9–99.9) | 2.62 (2.09–3.30) | 0.31 (.14–.67) |
| 28-day mortality | ||||
| SIRS | 6.1 (4.7–7.7) | 97.8 (96.2–98.9) | 1.30 (1.17–1.45) | 0.46 (.27–.77) |
| qSOFA | 13.9 (8.9–20.3) | 96.3 (95.2–97.2) | 3.26 (2.22–4.79) | 0.77 (.67–.90) |
| NEWS | 10.0 (7.5–13.1) | 97.6 (96.5–98.4) | 2.25 (1.87–2.71) | 0.49 (.36–.67) |
| Inpatient suspected infections | ||||
| 10-day mortality | ||||
| SIRS | 2.2 (1.2–3.6) | 99.1 (96.7–99.9) | 1.16 (.97–1.39) | 0.49 (.13–1.80) |
| qSOFA | 8.4 (3.9–15.4) | 99.0 (98.0–99.6) | 4.80 (2.96–7.80) | 0.53 (.32–.88) |
| NEWS | 4.1 (2.2–6.9) | 99.3 (98.3–99.8) | 2.24 (1.70–2.97) | 0.36 (.15–.84) |
| 28-day mortality | ||||
| SIRS | 6.1 (4.4–8.2) | 97.2 (94.1–99.0) | 1.16 (1.04–1.30) | 0.51 (.24–1.08) |
| qSOFA | 16.8 (10.3–25.3) | 96.2 (94.7–97.5) | 3.62 (2.39–5.47) | 0.70 (.56–.87) |
| NEWS | 10.4 (7.3–14.4) | 97.5 (95.8–98.6) | 2.08 (1.68–2.58) | 0.47 (.31–.71) |
| Outpatient suspected infections | ||||
| 10-day mortality | ||||
| SIRS | 1.8 (.7–3.9) | 100 (98.9–100) | 1.99 (1.84–2.15) | 0.00 (.00–∞) |
| qSOFA | 3.9 (.5–13.5) | 99.3 (98.3–99.8) | 4.44 (1.39– 14.22) | 0.72 (.41–1.27) |
| NEWS | 3.1 (1–7.1) | 99.8 (98.9–100) | 3.47 (2.36–5.08) | 0.22 (.04–1.31) |
| 28-day mortality | ||||
| SIRS | 6.0 (3.7–9.1) | 98.2 (96.0–99.3) | 1.55 (1.24–1.94) | 0.46 (.23–.93) |
| qSOFA | 7.8 (2.2–18.9) | 96.4 (94.6–97.7) | 2.07 (.81–5.32) | 0.91 (.77–1.08) |
| NEWS | 9.3 (5.3–14.8) | 97.8 (96.1–98.9) | 2.48 (1.74–3.55) | 0.55 (.35–.86) |
Abbreviations: CI, confidence interval; NEWS, National Early Warning Score; NLR, negative likelihood ratio; NPV, negative predictive value; PLR, positive likelihood ratio; PPV, positive predictive value; qSOFA, quick Sequential Organ Failure Assessment; SIRS, Systemic Inflammatory Response Syndrome.
aBased on the following prespecified cutpoints: SIRS ≥ 2, qSOFA ≥ 2, NEWS ≥ 7.
The predictive accuracy under scenarios of differential misclassification was nonsignificantly higher than in the primary analysis, (sensitivity increase < 3%, specificity increase < 0.3%). From the pattern-mixture model (imputation) analyses, we observed an increase in sensitivity for all criteria, at the cost of specificity. NEWS outperformed qSOFA and SIRS and, in relation to 10-day mortality, NEWS had a sensitivity of 100% under 2 scenarios assuming that missingness equated to illness (ie, individuals with missing measurements were assumed to be less healthy than individuals with recorded measurements) but had low specificity (< 34%). When missingness was assumed to be missing-at-random, NEWS had moderate to high sensitivity (78.8%) and moderate specificity (< 69.0%). Results from the sensitivity analyses and the missingness patterns are available in Supplementary Tables 1–7 and Supplementary Figures 2 and 3).
DISCUSSION
We evaluated the predictive accuracies of NEWS, qSOFA, and SIRS in relation to short-term mortality among allogeneic HCT recipients with suspected infections. We observed an overall 100-day mortality of 10.7%, which is similar to previously published rates among US transplant centers [33, 34]. All of the analyzed criteria were previously validated in general populations with suspected infections, but their predictive values in allogeneic HCT recipients were unmeasured. We found that SIRS was highly sensitive but suffered from limited specificity, qSOFA was highly specific at the cost of sensitivity, and NEWS was moderately sensitive and specific. These results were robust to evaluations under varied culture inclusion, measurement collection windows, and under multiple missing data assumptions. While each criteria had higher sensitivities and lower specificities in our multiple imputation sensitivity analyses than the primary analysis, only under the unlikely scenario that missingness was driven by illness did NEWS have high and qSOFA have moderate sensitivity. Furthermore, through probabilistic bias analysis, we found that our results held in scenarios accounting for the conceptual outcome misclassification introduced to this and similar analyses using a suspected infection definition that includes mortality-risk reducing treatment (Supplementary Table 1).
Our findings suggest that, in relation to 1-month mortality, NEWS is similarly sensitive and specific among HCT recipients (sensitivity, 64.9%; specificity, 71.2%) and general emergency room patients (sensitivity, 68.0%; specificity, 66.5%) [10]. In contrast, we found qSOFA to be similarly specific but less sensitive and SIRS to have higher sensitivity but lower specificity among allogeneic HCT recipients than among general population patients (Table 5) [11–13]. This indicates that the recognized limitations of qSOFA and SIRS (low sensitivity for qSOFA and low specificity for SIRS) may be exacerbated in HCT recipients. These results are not surprising given the unique presentation of sepsis and the frequency of sepsis-like ailments following transplantation, such as transfusion reactions and engraftment syndrome [15, 16].
Predictive Accuracies of Quick Sequential Organ Failure Assessment and Systemic Inflammatory Response Syndrome Criteria in Allogeneic Hematopoietic Cell Transplant Recipients With Suspected Infection Versus General Population Patients With Suspected Infection in Relation to 1-Month (28- or 30-Day) Morality
| Criteria | HCT Recipients | Mixed Country and Hospital Setting Populationa [11] | Mixed Country and Hospital Setting Populationa,b [12] | Mixed-Country Emergency Patientsa [13] | ||||
|---|---|---|---|---|---|---|---|---|
| Sensitivity, % (95% CI) | Specificity, % (95% CI) | Sensitivity, % (95% CI) | Specificity, % (95% CI) | Sensitivity, % | Specificity, % | Sensitivity, % (95% CI) | Specificity, % (95% CI) | |
| SIRS | 83.8 (73.4–91.3) | 35.5 (33.1–38.0) | 70.0 (60.7–77.8) | 53.1 (50.4–55.7) | … | … | 74 (69–78) | 54 (53–55) |
| qSOFA | 29.7 (19.7–41.5) | 90.9 (89.3–92.3) | 43.2 (27.7–60.1) | 86.0 (74.8–92.7) | 43.0 | 84.0 | 41 (37–46) | 92 (92–93) |
Abbreviations: CI, confidence interval; HCT, hematopoietic cell transplant; qSOFA, quick Sequential Organ Failure Assessment; SIRS, Systemic Inflammatory Response Syndrome.
aMeta-analysis.
bNo confidence intervals provided by publication.
Despite adding to the growing evidence showing the superiority of NEWS in comparisons to SIRS and qSOFA, we do not believe our results should prompt the use of NEWS as a clinical criteria for sepsis in HCT recipients. Our concern stems from the moderate overall predictive performance of NEWS and its incredibly low observed PPV.
In relation to 10-day and 28-day mortality, the primary analysis–estimated sensitivities were 78% and 65%, with lower bounds of 56% and 53%, respectively. Because the reported case fatality of sepsis in HCT recipients is > 50% and because sepsis-related mortality is inversely related to treatment, failing to identify > 20% of 10-day and 28-day mortality is concerning and would be considered unacceptable by the majority of treating physicians [2]. As a result, a tool with high sensitivity would have potential advantages. However, the highly sensitive alternative, SIRS, suffered from PPV of 2.1% for 10-day and 6.1% for 28-day mortality, meaning that > 90% of patients who screen positive for SIRS criteria may receive unneeded broad-spectrum antibiotics and may be subject to their associated consequences. We observed similarly low PPVs among the other 2 criteria and in our sensitivity analyses addressing conceptual misclassification. The fact that the low PPV held in our PBA analysis indicates to us that the low predictive value is not driven by current antibiotic treatment standards.
Our study has numerous strengths. First, our study population includes eligible adult allogeneic HCT recipients who received transplantation over an 8-year period, and at a center with standard practice guidelines for managing and treating patients for infections that remained constant for the length of follow-up [35]. Furthermore, the frequency of patient observation during the first 100 days posttransplant allowed us to examine NEWS, SIRS, and qSOFA in both inpatient and outpatient settings. Finally, our PBA sensitivity analyses used novel statistical techniques to mitigate concerns that our results only generalize to patients who would die regardless of antibiotic treatment.
However, our study has several limitations. First, our population was more racially homogenous than the national transplant population [36, 37]. Because complication rates following HCT differ by racial group, similar analyses should be conducted at other centers with differing populations [38]. Second, our study relied on retrospectively collected electronic medical records and suffers from missing data. While we ran numerous sensitivity analyses testing our results under differing missingness mechanism assumptions, we do not know the actual missingness structure of our data. Future work should examine the mechanism of missingness for commonly missing clinical factors, such as GCS. Additionally, we did not look at ICU admission as an outcome, nor at the predictive accuracy of lactate plus qSOFA within this population, but believe that this would be a good direction for additional analyses.
CONCLUSIONS
In alignment with studies performed among general patient populations, we found that NEWS outperformed SIRS and qSOFA in relation to short-term mortality among HCT recipients with suspected infections. Additionally, we found that the commonly recognized predictive limitations of SIRS and qSOFA may be amplified in HCT recipients with suspected infections. Despite the superior nature of NEWS, it had moderate predictive value and we do not feel our results should prompt its use as the singular clinical criterion for sepsis among this immunocompromised population. Based on these findings, we conclude that the limited predictive accuracies of NEWS, qSOFA, and SIRS in relation to short-term mortality indicate the need for new, population-specific, clinical criteria for sepsis in this immunocompromised population.
Supplementary Data
Supplementary materials are available at Clinical Infectious Diseases online. Consisting of data provided by the authors to benefit the reader, the posted materials are not copyedited and are the sole responsibility of the authors, so questions or comments should be addressed to the corresponding author.
Notes
Acknowledgments. The authors thank Chris Davis, John Klassen, and Madeline Kesten for their help in understanding and accessing the data.
Disclaimer. The content of this work is solely the responsibility of the authors and does not necessarily represent the official views of the National Institutes of Health (NIH).
Financial support. M. L. is supported by the National Center for Advancing Translational Sciences of the NIH (grant number TL1 TR002318). S. J. M. is supported by the National Library of Medicine (grant number R00LM012868). This research was also supported in part by the National Cancer Institute (grant number CA-15704).
Potential conflicts of interest. S. A. P. reports grant support from Global Life Technologies, participates in research trials with Chimerix, Inc and Merck & Co, and currently participates in a clinical trial sponsored by the National Institute of Allergy and Infectious Diseases (grant number U01-AI132004; vaccines for this trial are provided by Sanofi-Aventis), all outside of this submitted work. All other authors report no potential conflicts of interest. All authors have submitted the ICMJE Form for Disclosure of Potential Conflicts of Interest. Conflicts that the editors consider relevant to the content of the manuscript have been disclosed.

