


Abstract
The increasing global prevalence of pulmonary nontuberculous mycobacteria (NTM) disease has called attention to challenges in NTM diagnosis and management. This study was conducted to understand management and outcomes of patients with pulmonary NTM disease at diverse centers across the United States.
We conducted a 10-year (2005–2015) retrospective study at 7 Vaccine and Treatment Evaluation Units to evaluate pulmonary NTM treatment outcomes in human immunodeficiency virus–negative adults. Demographic and clinical information was abstracted through medical record review. Microbiologic and clinical cure were evaluated using previously defined criteria.
Of 297 patients diagnosed with pulmonary NTM, the most frequent NTM species were Mycobacterium avium-intracellulare complex (83.2%), M. kansasii (7.7%), and M. abscessus (3.4%). Two hundred forty-five (82.5%) patients received treatment, while 45 (15.2%) were followed without treatment. Eighty-six patients had available drug susceptibility results; of these, >40% exhibited resistance to rifampin, ethambutol, or amikacin. Of the 138 patients with adequate outcome data, 78 (56.5%) experienced clinical and/or microbiologic cure. Adherence to the American Thoracic Society/Infectious Diseases Society of America (ATS/IDSA) treatment guidelines was significantly more common in patients who were cured (odds ratio, 4.5, 95% confidence interval, 2.0–10.4; P < .001). Overall mortality was 15.7%.
Despite ATS/IDSA Guidelines, management of pulmonary NTM disease was heterogeneous and cure rates were relatively low. Further work is required to understand which patients are suitable for monitoring without treatment and the impact of antimicrobial therapy on pulmonary NTM morbidity and mortality.
(.)
There are more than 190 nontuberculous mycobacteria (NTM) species [1, 2], and although most are nonpathogenic, some cause serious human disease [3]. Nontuberculous mycobacteria are primarily environmental saprophytes that are found in soil, water, and dust and may be acquired via inhalation, ingestion, or direct inoculation. Pulmonary NTM disease is most common in adults who are negative for human immunodeficiency virus (HIV) [4].
In many countries, particularly where the incidence of tuberculosis (TB) is low, both the prevalence of pulmonary NTM and the mortality rate associated with NTM infections are increasing [4–8]. A US study of Medicare Part B beneficiaries showed that the prevalence of NTM increased from 20 to 47 per 100 000 persons between 1997 and 2007, an increase of 8.2% per year [5]. A more recent report estimated that the number of pulmonary NTM cases in the United States increased by at least 2-fold between 2010 and 2014 [9]. Limited data suggest that pulmonary NTM is associated with increased risk of hospitalization and reduced quality of life [10, 11]. Current American Thoracic Society (ATS) and Infectious Diseases Society of America (IDSA) guidelines recommend treatment with multiple drugs for many months [12], although data demonstrating that such treatment reduces morbidity or mortality are lacking.
Most clinical studies of pulmonary NTM in North America have focused on the experiences of a single institution or region, potentially limiting generalizability of results [13, 14]. Meta-analyses and case series have analyzed composite data from smaller cohorts with some success [15–20], which still warrants multicenter epidemiological studies. Therefore, this multicenter epidemiological study was conducted to determine mycobacterial species and risk factors associated with pulmonary NTM, describe variability in patient management, determine treatment outcomes, and identify factors that affect treatment outcomes.
METHODS
Study Design and Setting
We performed a multicenter, 10-year, retrospective cohort study of patients with NTM evaluated at 7 Vaccine and Treatment Evaluation Units (VTEUs) in the United States. Participating institutions included Saint Louis University, Emory University, University of Iowa, Baylor College of Medicine, Duke University, Vanderbilt University Medical Center, and Kaiser Permanente Washington Health Research Institute. The VTEU network is funded under contract by the National Institute of Allergy and Infectious Diseases and has been a ready resource for conducting clinical trials and research of vaccine and treatments for infectious diseases since 1962. The study was approved by the institution review boards of all participating VTEUs.
Inclusion and Exclusion Criteria
Medical records of patients who were 18 years of age or older with NTM isolated from a respiratory specimen and in whom the diagnosis of pulmonary NTM was made between 1 January 2005 and 1 July 2015 were eligible for the study. Exclusion criteria were history of HIV infection and concurrent diagnosis of TB as determined by culture or molecular tests, such as polymerase chain reaction at the time of NTM diagnosis or during follow-up visits.
Data Collection
Patient data were abstracted through medical record review by licensed nurses, clinical research coordinators, subspecialty training fellows, or physicians who were trained in protocol-specific data collection procedures. Patients with NTM were identified for review of eligibility using International Classification of Diseases (ICD), 9th and 10th revision, codes. All patients had NTM culture-positive respiratory specimens. Clinical, laboratory, radiology, and treatment data were evaluated through 30 months post-NTM diagnosis using electronic data collection forms standardized across sites by the Statistical and Data Coordinating Center (SDCC; The Emmes Corporation, LLC). Abstracted data were reviewed and queried by the SDCC for data quality and adherence to protocol data collection procedures across sites. All participating sites used laboratories that adhere to Clinical and Laboratory Standards Institute guidelines for drug susceptibility testing. More than 3986 medical records of patients with possible pulmonary NTM were reviewed, and data were collected from 322 patients who were diagnosed with pulmonary NTM. Two sites that had fewer than 100 total eligible patients included all patients; 4 sites randomly selected patients’ records from each of the study years; and 1 site randomly selected records from 3 time periods (2005–2008, 2009–2012, 2013–2015). Upon further review of abstracted data, 18 patients were unlikely to have pulmonary NTM, and 2 did not have positive NTM culture results recorded. Therefore, the data from the remaining 302 patients were analyzed (Figure 1).
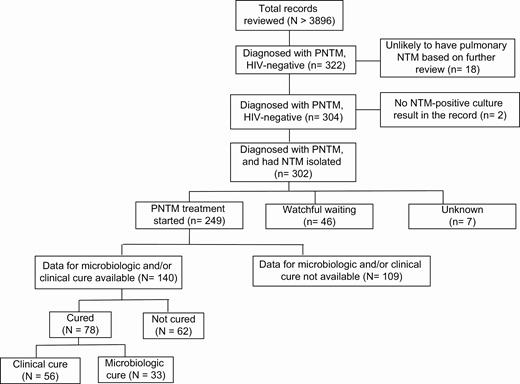
Schematic of total medical records reviewed and the number of patients with pulmonary NTM who were negative for HIV analyzed for different outcome measures. Abbreviations: HIV, human immunodeficiency virus; NTM, nontuberculous mycobacteria; PNTM, pulmonary nontuberculous mycobacteria.
Definitions
Microbiologic cure was defined as 1 or more negative sputum or bronchoalveolar lavage (BAL) culture without reversion to culture positivity after 1 year of anti-NTM therapy [12, 21]. Clinical cure was defined as patient-reported or objective improvement in symptoms sustained until the end (minimum) of NTM treatment [21, 22]. The presence of observed or reported symptoms was documented by review of clinical case records, and changes in symptoms (improved, worsened, or no change) from the previous visit were adjudicated by reviewers. Comorbidities were defined as the recorded diagnoses or ICD diagnosis codes at the time of NTM diagnosis.
Statistical Analysis
Demographic and clinical characteristics, radiologic and microbiologic results, and treatment types and duration were reported using descriptive statistics in the full cohort and stratified by NTM species. Comorbidities, clinical symptoms, treatment characteristics, and NTM species were compared between NTM cases who did or did not meet criteria for clinical and microbiologic cure using Pearson’s chi-square or Fisher’s exact tests for categorical variables and Wilcoxon 2-sample tests for continuous variables. Unconditional logistic regression was used to estimate unadjusted odds ratios (ORs) and 95% confidence intervals (CIs) for the associations of characteristics with cure outcomes. Analyses were repeated among the subgroup of patients with Mycobacterium avium-intracellulare complex (MAC) to describe characteristics associated with cure among this most frequent NTM type. Demographic, clinical, diagnostic, and treatment characteristics were also compared by vital status at the end of follow-up among all patients with NTM and among patients with MAC. Characteristics associated with cure and mortality in bivariate analyses at a significance level of less than 0.1 were included as independent variables in separate multivariate logistic regression models of cure and mortality as the dependent variables. Kaplan-Meier curves of time to mortality over follow-up were plotted and compared by log-rank test for select predictors that were identified as independently associated with vital status at the end of follow-up in the multivariate analyses.
RESULTS
Data from 297 patients negative for HIV diagnosed with pulmonary NTM were used for analysis (Figure 1). Of these 297 cases, 245 (82.5%) were begun on treatment; 45 (15.2%) were followed without treatment; and the treatment status of 7 (2.4%) patients was unknown. Table 1 shows demographic characteristics at the time of NTM diagnosis. Sixty-four percent of patients with NTM were female and 61% were white. The median age was 64 years (interquartile range [IQR], 55–73 years), and median body mass index (BMI) was 21.9 kg/m2 (IQR, 19.5–25.0). Half of patients (49.5%) had public insurance, while 27 had private insurance. A total of 213 of 297 (72%) met ATS/IDSA diagnostic criteria for pulmonary NTM. The most frequent NTM species was MAC (247/297, 83.2%), followed by Mycobacterium kansasii (23/297, 7.7%), and Mycobacterium abscessus (12/297, 4%). Eight (2.7%) patients had more than 1 NTM species isolated.
Demographic Characteristics of Patients With Pulmonary Nontuberculous Mycobacteria Negative for Human Immunodeficiency Virus
| All (N = 297) | MAC (n = 247) | M. kansasii (n = 23) | M. abscessus (n = 12) | Other (n = 7) | Multiple (n = 8) | |
|---|---|---|---|---|---|---|
| Age at presentation, median (IQR), y | 64.0 (55.0, 73.0) | 65.3 (56.7, 73.0) | 53.7 (43.0, 63.7) | 55.2 (29.8, 67.5) | 57.7 (42.5, 69.3) | 73.5 (65.6, 78.4) |
| Female, n (%) | 186 (63.6) | 161 (65.2) | 6 (26.1) | 6 (50) | 6 (85.7) | 7 (87.5) |
| BMI, median (IQR), kg/m2 | 21.9 (19.5, 25.0) | 21.9 (19.7, 25.0) | 22.6 (19.4, 27.8) | 21.3 (20.3, 24.3) | 21.7 (17.5, 28.8) | 19.9 (19.0, 22.7) |
| Met ATS/IDSA diagnostic guidelines, n (%) | 213 (71.7) | 176 (71.3) | 15 (65.2) | 9 (75) | 6 (85.7) | 7 (87.5) |
| Race/ethnicity, n (%) | ||||||
| Non-Hispanic white | 180 (60.6) | 153 (61.9) | 10 (43.5) | 7 (58.3) | 3 (42.9) | 7 (87.5) |
| Non-Hispanic black | 15 (5.1) | 10 (4) | 3 (13) | 1 (8.3) | … | 1 (12.5) |
| Hispanic | 6 (2) | 5 (2) | 1 (4.3) | … | … | … |
| Other | 15 (5.1) | 12 (4.9) | 1 (4.3) | … | 2 (28.6) | … |
| Unknown | 81 (27.3) | 67 (27.1) | 8 (34.8) | 4 (33.3) | 2 (28.6) | … |
| Health insurance, n (%) | ||||||
| Public | 147 (49.5) | 126 (51) | 11 (47.8) | 1 (8.3) | 4 (57.1) | 5 (62.5) |
| Private | 81 (27.3) | 65 (26.3) | 5 (21.7) | 8 (66.7) | 2 (28.6) | 1 (12.5) |
| No insurance | 15 (5.1) | 12 (4.9) | 3 (13) | … | … | … |
| Unknown | 54 (18.2) | 44 (17.8) | 4 (17.4) | 3 (25) | 1 (14.3) | 2 (25) |
| Site | ||||||
| St Louis | 41 (13.8) | 22 (8.9) | 8 (34.8) | 6 (50) | 3 (42.9) | 2 (25) |
| Emory | 70 (23.6) | 69 (27.9) | … | 1 (8.3) | … | … |
| Kaiser | 14 (4.7) | 14 (5.7) | … | … | … | … |
| Baylor | 19 (6.4) | 14 (5.7) | 4 (17.4) | … | 1 (14.3) | |
| Iowa | 84 (28.3) | 66 (26.7) | 9 (39.1) | 3 (25) | 3 (42.9) | 3 (37.5) |
| Vanderbilt | 40 (13.5) | 38 (15.4) | 2 (8.7) | … | … | … |
| Duke | 29 (9.8) | 24 (9.7) | … | 2 (16.7) | … | 3 (37.5) |
Abbreviations: ATS/IDSA, American Thoracic Society/Infectious Diseases Society of America; BMI, body mass index; IQR, interquartile range; MAC, Mycobacterium avium-intracellulare complex.
Table 2 shows the clinical presentation features and comorbidities at the time of NTM diagnosis. Eighty-five percent of patients had 1 or more chronic diseases, and 20.5% had an acute comorbidity at the time of pulmonary NTM diagnosis. Thirty-seven (14.7%) were previously treated for pulmonary NTM. Nearly half (44.4%) used selected drugs such as vitamin D (56/297, 18.9%), statins (54/297, 18.2%), and glucocorticoids (32/297, 10.8%) at presentation. Cough was the most common presenting symptom (86.4%); most patients with cough (64.8%) reported it to be productive and 17.0% of patients reported hemoptysis. Half (50.6%) of the patients reported shortness of breath, 29.2% had unintentional weight loss, 26.9% had fatigue, and 14.4% had fever.
Clinical Presentation and Comorbidities of Patients With Pulmonary Nontuberculous Mycobacteria Negative for Human Immunodeficiency Virus
| All (N = 297) | MAC (n = 247) | M. kansasii (n = 23) | M. abscessus (n = 12) | Other (n = 7) | Multiple (n = 8) | |
|---|---|---|---|---|---|---|
| Chronic comorbidities | 252 (84.8) | 215 (87) | 14 (60.9) | 10 (83.3) | 7 (100) | 6 (75) |
| COPD | 85 (33.7) | 70 (32.6) | 9 (64.3) | 2 (20) | 4 (57.1) | … |
| Abnormal PFT | 65 (25.8) | 60 (27.9) | 1 (7.1) | 2 (20) | 1 (14.3) | 1 (16.7) |
| Cystic fibrosis | 13 (5.2) | 10 (4.7) | 3 (30) | … | … | |
| Interstitial lung disease | 15 (6) | 12 (5.6) | 1 (7.1) | 2 (20) | … | … |
| Pulmonary sarcoidosis | 7 (2.8) | 7 (3.3) | … | … | … | … |
| Bronchiectasis | 82 (32.5) | 74 (34.4) | … | 4 (40) | 1 (14.3) | 3 (50) |
| Autoimmune diseases/connective tissue disorder | 34 (13.5) | 29 (13.5) | 2 (14.3) | 1 (10) | 1 (14.3) | 1 (16.7) |
| History of treated pulmonary TB | 12 (4.8) | 9 (4.2) | 3 (21.4) | … | … | … |
| History of treated pulmonary NTM | 37 (14.7) | 28 (13.1) | 1 (7.1) | 4 (40) | 1 (14.3) | 3 (50) |
| Gastroesophageal reflux disease | 88 (34.9) | 76 (35.3) | 4 (28.6) | 4 (40) | 2 (28.6) | 2 (33.3) |
| Organ transplant | 15 (6) | 13 (6) | … | 1 (10) | 1 (14.3) | … |
| Chronic liver disease | 13 (5.2) | 13 (6) | … | … | … | … |
| Chronic kidney disease | 11 (4.4) | 10 (4.7) | 1 (7.1) | … | … | … |
| Congestive heart failure | 11 (4.4) | 9 (4.2) | … | 1 (10) | 1 (14.3) | … |
| Emphysema | 21 (8.4) | 17 (8) | 3 (21.4) | … | 1 (14.3) | … |
| Acute comorbidities | 61 (20.5) | 48 (19.4) | 7 (30.4) | 1 (8.3) | 2 (28.6) | 3 (37.5) |
| CAP | 25 (41) | 19 (39.6) | 2 (28.6) | 1 (100) | 2 (100) | 1 (33.3) |
| Leukemia | 4 (6.6) | 2 (4.2) | 1 (14.3) | … | … | 1 (33.3) |
| Lymphoma | 3 (4.9) | 2 (4.2) | 1 (14.3) | … | … | … |
| Lung cancer | 9 (14.8) | 6 (12.5) | 2 (28.6) | … | 1 (50) | … |
| Pulmonary nocardiosis | 1 (1.9) | 1 (2.3) | … | … | … | … |
| Acute respiratory failure | 3 (5.6) | 2 (4.7) | … | … | 1 (50) | … |
| Symptoms at presentation | 264 (88.9) | 221 (89.5) | 18 (78.3) | 11 (91.7) | 7 (100) | 7 (87.5) |
| Cough (any) | 228 (86.4) | 192 (86.9) | 16 (88.9) | 8 (72.7) | 6 (85.7) | 6 (85.7) |
| Productive cough | 171 (64.8) | 142 (64.3) | 13 (72.2) | 6 (54.5) | 4 (57.1) | 6 (85.7) |
| Hemoptysis | 45 (17) | 36 (16.3) | 5 (27.8) | 2 (18.2) | … | 2 (28.6) |
| Shortness of breath | 133 (50.6) | 114 (51.8) | 8 (44.4) | 6 (54.5) | 3 (42.9) | 2 (28.6) |
| Fever | 38 (14.4) | 31 (14) | 5 (27.8) | … | 1 (14.3) | 1 (14.3) |
| Fatigue | 71 (26.9) | 62 (28.1) | 4 (22.2) | 2 (18.2) | 1 (14.3) | 2 (28.6) |
| Reported weight loss | 77 (29.2) | 63 (28.5) | 7 (38.9) | 2 (18.2) | 2 (28.6) | 3 (42.9) |
| Chest pain | 31 (13.2) | 27 (13.7) | 3 (16.7) | … | 1 (16.7) | … |
| Edema | 17 (6.5) | 17 (7.7) | … | … | … | … |
Data are presented as n (%).
Abbreviations: CAP, community acquired pneumonia; COPD, chronic obstructive pulmonary disease; MAC, Mycobacterium avium-intracellulare complex; NTM, nontuberculous mycobacteria; PFT, pulmonary function tests; TB, tuberculosis.
Radiologic and microbiologic results at diagnosis are shown in Table 3. At the time of diagnosis, pulmonary nodules, bronchiectasis, infiltrate/opacity, and/or cavitary lesion(s) were seen in 155 (52.2%), 128 (43.1%), 92 (31%), and 80 (26.9%) patients, respectively. A single culture-positive sputum specimen was used to satisfy the microbiologic criteria for NTM diagnosis in 116 (40.6%) patients. More than 1 culture-positive sputum specimen was used in 36 (12.6%) patients, and a culture-positive bronchial specimen (BAL and/or biopsy) was used for diagnosis in 134 (46.9%) patients. Eighty-six patients (28.5%) had drug susceptibility results at the time of diagnosis. Among the 86 tested NTM isolates, in vitro drug resistance to ethambutol, rifampin, and amikacin was 48.5%, 40%, and 43.1%, respectively. Baseline clarithromycin resistance among MAC isolates was 4.8%.
Radiologic and Microbiologic Results of Patients With Pulmonary Nontuberculous Mycobacteria Negative for Human Immunodeficiency Virus at Time of Diagnosis
| All (N = 297) | MAC (n = 247) | M. kansasii (n = 23) | M. abscessus (n = 12) | Other (n = 7) | Multiple (n = 8) | |
|---|---|---|---|---|---|---|
| Radiologic findings at diagnosis | ||||||
| Infiltrates/opacities | 92 (34.3) | 71 (32.3) | 8 (34.8) | 6 (60) | 4 (57.1) | 3 (37.5) |
| Single nodule | 8 (3) | 7 (3.2) | … | … | 1 (14.3) | |
| Multiple nodules | 147 (54.9) | 124 (56.4) | 10 (43.5) | 2 (20) | 5 (71.4) | 6 (75) |
| Cavitation | 80 (30) | 62 (28.2) | 14 (60.9) | 1 (10) | 2 (28.6) | 1 (14.3) |
| Single area bronchiectasis (unilobar)a | 30 (11.2) | 24 (10.9) | 2 (8.7) | … | 2 (28.6) | 2 (25) |
| Multifocal bronchiectasisa | 98 (36.6) | 88 (40) | 1 (4.3) | 6 (60) | 1 (14.3) | 2 (25) |
| Ground-glass opacities | 43 (16) | 36 (16.4) | 3 (13) | 2 (20) | … | 2 (25) |
| Tree-in-bud opacities | 81 (30.6) | 74 (34.1) | 4 (17.4) | 1 (10) | … | 2 (25) |
| Scarring | 52 (19.5) | 43 (19.7) | 8 (34.8) | … | 1 (14.3) | … |
| Emphysema | 51 (19.2) | 38 (17.5) | 8 (34.8) | 1 (10) | 3 (42.9) | 1 (12.5) |
| Pleural thickening | 16 (6.1) | 13 (6) | 1 (4.3) | … | … | 2 (25) |
| Pleural effusion | 9 (3.8) | 7 (3.6) | … | … | 2 (28.6) | … |
| Imaging test at diagnosis | ||||||
| CT | 219 (73.7) | 184 (74.5) | 17 (73.9) | 6 (50) | 6 (85.7) | 6 (75) |
| CXR | 111 (37.4) | 89 (36) | 11 (47.8) | 4 (33.3) | 3 (42.9) | 4 (50) |
| CT and CXR | 65 (21.9) | 56 (22.7) | 5 (21.7) | … | 2 (28.6) | 2 (25) |
| Source of positive culture at diagnosis | ||||||
| 1 sputum culture | 116 (40.6) | 93 (39.4) | 10 (43.5) | 7 (58.3) | 3 (42.9) | 3 (37.5) |
| >1 sputum culture | 36 (12.6) | 30 (12.7) | 4 (17.4) | … | … | 2 (25) |
| Bronchial culture (BAL or biopsy) | 134 (46.9) | 113 (47.9) | 9 (39.1) | 5 (41.7) | 4 (57.1) | 3 (37.5) |
Denominators for percentages represent the number of subjects with nonmissing data for each row variable.
Abbreviations: BAL, bronchoalveolar lavage; CT, computed tomography; CXR, chest X-ray; MAC, Mycobacterium avium-intracellulare complex.
aThe number of patients with radiologic findings of bronchiectasis was much higher than the number of patients with known past medical history of bronchiectasis shown in Table 2.
Treatment characteristics and clinical course are shown in Table 4. The majority (83%) of patients with pulmonary NTM were begun on anti-NTM treatment. Among treated patients, 210 (85.4%) received at least 3 drugs, 26 (10.6%) received 2 drugs, and 10 (4%) received 1 drug. Two hundred twenty-nine (93.1%) patients received an exclusively oral regimen, while the remaining patients received a combination of oral and parenteral therapy. On average, treatment was continued for 13.7 ± 9.6 (mean ± SD) months. One or more drugs in the treatment regimen were discontinued or replaced in 97 (32.7%) of the 245 patients who received antimicrobial treatment. Among these 97 patients, 56.6% experienced an adverse drug effect, making it the most common reason for a change in the treatment regimen. Gastrointestinal symptoms, such as nausea and diarrhea, were the most common adverse drug effects.
Treatment and Clinical Course of Patients With Pulmonary Nontuberculous Mycobacteria Negative for Human Immunodeficiency Virus
| All (N = 297) | MAC (n = 247) | M. kansasii (n = 23) | M. abscessus (n = 12) | Other (n = 7) | Multiple (n = 8) | |
|---|---|---|---|---|---|---|
| Treated | 245 (83.1) | 203 (82.9) | 21 (91.3) | 9 (75) | 6 (85.7) | 6 (75) |
| No. of antibiotics administered as initial therapy | ||||||
| 1 | 10a (4.1) | 8 (3.9) | … | 2 (22.2) | … | … |
| 2 | 26 (10.6) | 22 (10.8) | 1 (4.8) | 2 (22.2) | 1 (16.7) | … |
| ≥3 | 210 (85.4) | 174 (85.3) | 20 (95.2) | 5 (55.6) | 5 (83.3) | 6 (100) |
| Mode of initial antibiotics administration | ||||||
| Oral only | 229 (93.1) | 192 (94.1) | 21 (100) | 4 (44.4) | 6 (100) | 6 (100) |
| Oral and parenteral | 17 (6.9) | 12 (5.9) | … | 5 (55.6) | … | … |
| Duration of treatment, mean ± SD, m | 13.7 ± 9.7 | 13.7 ± 10.0 | 13.6 ± 8.0 | 13.4 ± 12.2 | 17.2 ± 3.3 | 10.9 ± 7.3 |
| Adherence to ATS/IDSA treatment guidelines | 99 (33) | 88 (35.6) | 4 (17.4) | 2 (16.7) | 1 (14.3) | 3 (37.5) |
| Change in treatment | 97 (32.7) | 80 (32.4) | 5 (21.7) | 7 (58.3) | 2 (28.6) | 3 (37.5) |
| Reason for discontinued treatment | ||||||
| Persistent positive culture | 12 (7.5) | 12 (9.3) | … | … | … | … |
| Culture-confirmed drug resistance | 9 (5.7) | 9 (7) | … | … | … | … |
| Adverse drug effects | 90 (56.6) | 75 (58.1) | 3 (23.1) | 6 (85.7) | 1 (25) | 5 (83.3) |
| Drug interaction | 3 (1.9) | 2 (1.6) | … | … | … | 1 (16.7) |
| NTM culture result available at follow-up | ||||||
| 12–24 m | 141 (47.5) | 114 (46.2) | 11 (47.8) | 9 (75) | 3 (42.9) | 4 (50) |
| 24–30 m | 66 (22.2) | 56 (22.7) | 1 (4.3) | 5 (41.7) | 2 (28.6) | 2 (25) |
| >30 m | 41 (13.8) | 35 (14.2) | 3 (13) | 2 (16.7) | … | 1 (12.5) |
| NTM culture negative at follow-up | ||||||
| 12–24 m | 88 (62.4) | 70 (61.4) | 11 (100) | 3 (33.3) | 2 (66.7) | 2 (50) |
| 24–30 m | 36 (54.5) | 30 (53.6) | 1 (100) | 3 (60) | 1 (50) | 1 (50) |
| >30 m | 22 (53.7) | 18 (51.4) | 2 (66.7) | 2 (100) | … | … |
| Symptoms improvement | ||||||
| 3 m | 104 (44.6) | 85 (43.4) | 11 (68.8) | 4 (50) | 2 (33.3) | 2 (28.6) |
| 6 m | 76 (41.3) | 66 (41.3) | 5 (50) | 3 (42.9) | 2 (66.7) | … |
| 9 m | 69 (41.1) | 65 (44.8) | 2 (20) | 1 (14.3) | 1 (25) | … |
| 12 m | 55 (34.6) | 49 (34.5) | 4 (50) | 1 (25) | … | 1 (25) |
| 18 m | 75 (36.2) | 66 (38.2) | 6 (37.5) | … | 2 (40) | 1 (20) |
| 30 m | 50 (29.6) | 42 (28.8) | 3 (37.5) | 3 (42.9) | … | 2 (40) |
| Hospitalization | 83 (29.2) | 62 (26.3) | 9 (40.9) | 6 (50) | 3 (50) | 3 (37.5) |
| Died | 44 (15.7) | 34 (14.7) | 4 (18.2) | 4 (33.3) | … | 2 (25) |
| Total person-years follow-up | 506 | 428 | 32 | 21 | 12 | 13 |
| Months of follow-up, median (IQR) | 24.2(14.5, 29.7) | 24.8(15.0, 29.7) | 17.5(13.8, 24.0) | 26.1(14.4, 29.8) | 24.4(20.7, 29.9) | 23.4(9.0, 29.5) |
Data are presented as n (%) unless otherwise indicated.
Abbreviations: ATS/IDSA, American Thoracic Society/Infectious Diseases Society of America; IQR, interquartile range; MAC, Mycobacterium avium-intracellulare complex; NTM, nontuberculous mycobacteria.
aSix received macrolide alone and four received doxycycline, levofloxacin, tobramycin or vancomycin.
The total person-years of follow-up in this study was 506, with a median follow-up of 24.2 months (IQR, 14.5–29.7). Eighty-three (29.2%) patients with NTM required hospitalization after NTM diagnosis, and among those with known vital status, 44 (15.7%) died during follow-up. Approximately 45% of patients had symptom improvement at 3 months, and of 142 patients who had follow-up cultures performed at 12–24 months, 62.4% were negative. Among 138 treated patients with data available for evaluation of treatment outcome, 78 (56.5%) met criteria for clinical or microbiologic cure. Table 5 shows that adherence to ATS/IDSA diagnostic guidelines did not significantly change the treatment outcome, but adherence to the ATS/IDSA treatment guidelines was significantly more common in patients who were cured (OR, 4.6; 95% CI, 2.0–10.4; P < .001).
Factors Associated With Clinical and/or Microbiologic Cure
| Cure (n = 78) | No Cure (n = 60) | P | Odds Ratio | 95% CI | |
|---|---|---|---|---|---|
| Age at presentation, median (IQR), y | 61.5 (54.0, 71.2) | 62.2 (55.0, 70.7) | .986 | 1.000 | (.977, 1.024) |
| Female, n (%) | 54 (69.2) | 40 (66.7) | .854 | 1.125 | (.547, 2.313) |
| BMI, median (IQR), kg/m2 | 22.4 (19.1, 24.7) | 22.1 (19.5, 25.7) | .467 | 1.026 | (.957, 1.098) |
| Race/ethnicity, n (%) | |||||
| Non-Hispanic white | 47 (60.3) | 35 (58.3) | .396 | … | … |
| Non-Hispanic black | 6 (7.7) | 2 (3.3) | … | … | |
| Hispanic | … | 2 (3.3) | … | … | |
| Other | 6 (7.7) | 3 (5) | … | … | |
| Unknown | 19 (24.4) | 18 (30) | … | … | |
| Health insurance, n (%) | |||||
| Public | 36 (46.2) | 29 (48.3) | .454 | … | … |
| Private | 20 (25.6) | 19 (31.7) | … | … | |
| No insurance | 5 (6.4) | 5 (8.3) | … | … | |
| Unknown | 17 (21.8) | 7 (11.7) | … | … | |
| Chronic comorbidities, n (%) | 65 (83.3) | 47 (78.3) | .514 | 1.383 | (.588, 3.253) |
| Acute comorbidities, n (%) | 10 (12.8) | 10 (16.7) | .628 | .735 | (.285, 1.900) |
| Symptoms at presentation, n (%) | |||||
| Cough (any) | 64 (87.7) | 41 (82) | .441 | 1.561 | (.572, 4.259) |
| Productive cough | 46 (63) | 31 (62) | 1.000 | 1.044 | (.497, 2.195) |
| Hemoptysis | 10 (13.7) | 12 (24) | .158 | .503 | (.198, 1.275) |
| Shortness of breath | 32 (43.8) | 22 (44.9) | 1.000 | .958 | (.462, 1.985) |
| Fever | 11 (15.1) | 5 (10) | .587 | 1.597 | (.519, 4.916) |
| Fatigue | 17 (23.3) | 9 (18) | .510 | 1.383 | (.561, 3.411) |
| Reported weight loss | 17 (23.3) | 10 (20) | .825 | 1.214 | (.504, 2.928) |
| Chest pain | 11 (16.7) | 4 (9.8) | .398 | 1.849 | (.547, 6.250) |
| Edema | 3 (4.1) | 3 (6.1) | .683 | .657 | (.127, 3.398) |
| Radiologic findings at diagnosis, n (%) | |||||
| Infiltrates/opacities | 21 (27.6) | 15 (27.8) | 1.000 | .993 | (.455, 2.164) |
| Single nodule | 2 (2.6) | 1 (1.9) | 1.000 | 1.432 | (.127, 16.209) |
| Multiple nodules | 45 (59.2) | 29 (53.7) | .592 | 1.251 | (.619, 2.530) |
| Cavitation | 22 (29.3) | 13 (24.1) | .552 | 1.309 | (.590, 2.907) |
| Single area bronchiectasis (unilobar) | 14 (18.4) | 6 (11.1) | .327 | 1.806 | (.646, 5.048) |
| Multifocal bronchiectasis | 34 (44.7) | 16 (29.6) | .101 | 1.922 | (.918, 4.024) |
| Ground-glass opacity | 10 (13.2) | 6 (11.1) | .792 | 1.212 | (.412, 3.563) |
| Tree-in-bud opacities | 32 (42.7) | 15 (29.4) | .137 | 1.786 | (.838, 3.805) |
| Scarring | 10 (13.3) | 13 (25) | .106 | .462 | (.185, 1.152) |
| Emphysema | 15 (20) | 13 (25.5) | .516 | .731 | (.313, 1.704) |
| Pleural thickening | 1 (1.4) | 4 (7.8) | .158 | .161 | (.017, 1.485) |
| Pleural effusion | 1 (1.4) | 1 (2.3) | 1.000 | .632 | (.039, 10.378) |
| Met ATS/IDSA diagnostic guidelines, n (%) | 62 (79.5) | 40 (67.8) | .166 | 1.841 | (.848, 3.994) |
| Duration of treatment, mean ± SD, m | 15.7 ± 7.0 | 17.8 ± 11.5 | .226 | .976 | (.938, 1.016) |
| Adherence to ATS/IDSA treatment guidelines, n (%) | 64 (85.3) | 33 (55.9) | .000 | 4.583 | (2.017, 10.411) |
| No. of antibiotics administered as initial therapy, n (%) | |||||
| 1 | … | 4 (6.8) | .006 | … | … |
| 2 | 5 (6.4) | 10 (16.9) | … | … | |
| ≥3 | 73 (93.6) | 45 (76.3) | … | … | |
| NTM type at diagnosis, n (%) | |||||
| MAC | 61 (78.2) | 51 (86.4) | .645 | … | … |
| M. kansasii | 9 (11.5) | 3 (5.1) | … | … | |
| M. abscessus | 2 (2.6) | 3 (5.1) | … | … | |
| M. szulgai | 1 (1.3) | … | … | … | |
| M. chelonae group | 1 (1.3) | … | … | … | |
| M. xenopi | 1 (1.3) | … | … | … | |
| Multiple | 3 (3.8) | 2 (3.4) | … | … | |
| Aspergillus coinfection at diagnosis, n (%) | 4 (5.1) | 5 (8.3) | .502 | .595 | (.153, 2.317) |
| Staphylococcus aureus coinfection at diagnosis, n (%) | 5 (6.4) | 2 (3.3) | .699 | 1.985 | (.372, 10.605) |
| Pseudomonas aeruginosa coinfection at diagnosis, n (%) | 7 (9) | 4 (6.7) | .756 | 1.380 | (.385, 4.952) |
Abbreviations: ATS/IDSA, American Thoracic Society/Infectious Diseases Society of America; BMI, body mass index; CI, confidence interval; IQR, interquartile range; MAC, Mycobacterium avium-intracellulare complex; NTM, nontuberculous mycobacteria.
Factors associated with clinical cure alone are shown in Supplementary Table 1. Clinical symptoms (particularly fatigue), meeting ATS/IDSA diagnostic criteria, and adherence to ATS/IDSA treatment guidelines were more common in patients who experienced clinical cure (Supplementary Table 1). However, multivariable logistic regression analysis showed that daily treatment course, meeting ATS/IDSA diagnostic criteria, adherence to ATS/IDSA treatment guidelines, or number of antibiotics administered did not predict clinical cure (Supplementary Table 2). Because MAC was the most common NTM isolated from our patients, we performed a subgroup analysis (Supplementary Table 3). Patients with MAC with a radiologic finding of tree-in-bud opacities and those who received ethambutol or rifampin/rifabutin in the initial treatment regimen were more likely to be cured (OR [95% CI], 2.5 [1.1–5.6] and 3.2 [1.1–9.4], respectively). The number and frequency of follow-up cultures are shown in Supplementary Table 4. Factors associated with microbiologic cure are shown in Supplementary Table 5. As expected, patients who had microbiologic cure had significantly shorter duration of treatment (P < .05) and the number of patients with pulmonary MAC was significantly higher in the group who failed treatment (P < .05).
Among 44 patients who died, 34 (77.3%) had pulmonary disease due to MAC; therefore, we analyzed predictors of mortality among patients with MAC (Table 6). Of 221 patients with MAC whose vital status over the follow-up period was known, survivors were more likely to be female (OR, .34; 95% CI, .16–.72; P = .005) and have tree-in-bud opacities (OR, .21; 95% CI, .07–.64; P = .002) on chest imaging. In addition, survivors were less likely to have weight loss (OR, 3.43; 95% CI, 1.59–7.42; P = .003), chronic kidney disease (OR, 5.96; 95% CI, 1.61–22.04; P = .012), and infiltrates/opacities (OR, 2.26; 95% CI, 1.05–4.86; P = .04) or cavitation (OR, 3.43; 95% CI, 1.58–7.44; P = .002) on chest imaging. Multivariate logistic regression analysis (Table 7) showed that female sex (adjusted OR [aOR], .37; 95% CI, .16–.85) and tree-in-bud opacities (aOR, .28; 95% CI, .09–.87) on imaging studies were associated with increased odds of survival, and pulmonary cavitation (aOR, 3.18; 95% CI, 1.37–7.37) was associated with decreased odds of survival in patients with pulmonary NTM. Kaplan-Meier analysis estimated that overall survival was higher for females and patients without cavitation with a log-rank test P of .02 and .002, respectively (Figure 2).
Characteristics of Patients With Pulmonary MAC Who Were Negative for Human Immunodeficiency Virus Who Died Compared With Those Who Survived
| Died (n = 34) | Survived (n = 187) | P | Odds Ratio | 95% CI | |
|---|---|---|---|---|---|
| Age at presentation, median (IQR), y | 69.5 (59.9, 82.3) | 65.0 (57, 73.0) | .078 | 1.025 | (.997, 1.054) |
| Female, n (%) | 16 (47.1) | 135 (72.2) | .005 | .342 | (.162, .722) |
| BMI, median (IQR), kg/m2 | 20.6 (18.1, 23.7) | 22.1 (19.9, 25.0) | .085 | .922 | (.840, 1.012 |
| Chronic comorbidities, n (%) | |||||
| COPD | 13 (41.9) | 45 (28.1) | .139 | 1.846 | (.836, 4.076) |
| Abnormal PFT | 6 (19.4) | 47 (29.4) | .283 | .577 | (.222, 1.498) |
| Cystic fibrosis | 1 (3.2) | 8 (5) | 1.000 | .633 | (.076, 5.252) |
| Interstitial lung disease | 4 (12.9) | 7 (4.4) | .082 | 3.238 | (.887, 11.820) |
| Pulmonary sarcoidosis | 1 (3.2) | 6 (3.8) | 1.000 | .856 | (.099, 7.366) |
| Bronchiectasis | 6 (19.4) | 62 (38.8) | .042 | .379 | (.147, .977) |
| DM | 7 (22.6) | 17 (10.6) | .078 | 2.453 | (.920, 6.541) |
| Autoimmune diseases/connective tissue disorder | 3 (9.7) | 24 (15) | .579 | .607 | (.171, 2.156) |
| History of treated pulmonary TB | 4 (12.9) | 1 (0.6) | .003 | … | … |
| History of treated pulmonary NTM | 3 (9.7) | 22 (13.8) | .772 | .667 | (.187, 2.383) |
| Gastroesophageal reflux disease | 10 (32.3) | 59 (36.9) | .687 | .815 | (.360, 1.848) |
| Organ transplant | 2 (6.5) | 11 (6.9) | 1.000 | .934 | (.197, 4.438) |
| Chronic liver disease | 4 (12.9) | 8 (5) | .109 | 2.815 | (.792, 10.004) |
| Chronic kidney disease | 5 (16.1) | 5 (3.1) | .012 | 5.963 | (1.613, 22.040) |
| Congestive heart failure | 3 (9.7) | 6 (3.8) | .164 | 2.750 | (.649, 11.644) |
| Acute comorbidities, n (%) | |||||
| CAP | 5 (35.7) | 11 (36.7%) | 1.000 | .960 | (.256, 3.598) |
| Leukemia | 2 (14.3) | … | .096 | … | … |
| Lymphoma | … | 2 (6.7) | 1.000 | … | … |
| Lung cancer | 3 (21.4) | 3 (10) | .364 | 2.454 | (.428, 14.083) |
| Pulmonary nocardiosis | … | 1 (3.7) | 1.000 | … | … |
| Acute respiratory failure | 1 (8.3) | 1 (3.7) | .526 | 2.363 | (.135, 41.269) |
| Symptoms at presentation, n (%) | 33 (97.1) | 165 (88.2) | .217 | 4.400 | (.573, 33.789) |
| Cough (any) | 27 (81.8) | 143 (86.7) | .425 | .692 | (.257, 1.866) |
| Productive cough | 19 (57.6) | 107 (64.8) | .435 | .736 | (.344, 1.574) |
| Hemoptysis | 6 (18.2) | 24 (14.5) | .598 | 1.306 | (.488, 3.496) |
| Shortness of breath | 20 (60.6) | 80 (48.8) | .254 | 1.615 | (.754, 3.462) |
| Fever | 4 (12.1) | 24 (14.5) | 1.000 | .810 | (.261, 2.512) |
| Fatigue | 12 (36.4) | 44 (26.7) | .292 | 1.572 | (.714, 3.459) |
| Reported weight loss | 17 (51.5) | 39 (23.6) | .003 | 3.433 | (1.587, 7.424) |
| Chest pain | 2 (7.7) | 22 (14.4) | .536 | .496 | (.109, 2.250) |
| Edema | 4 (12.1) | 10 (6.1) | .259 | 2.124 | (.624, 7.235) |
| Radiologic findings at diagnosis, n (%) | |||||
| Infiltrates/opacities | 15 (45.5) | 45 (26.9) | .040 | 2.259 | (1.051, 4.859) |
| Single nodule | … | 7 (4.2) | .603 | … | … |
| Multiple nodules | 20 (60.6) | 97 (58.1) | .848 | 1.110 | (.518, 2.381) |
| Cavitation | 16 (48.5) | 36 (21.6) | .002 | 3.425 | (1.576, 7.441) |
| Single area bronchiectasis (unilobar) | 3 (9.1) | 20 (12) | .773 | .735 | (.205, 2.632) |
| Multifocal bronchiectasis | 10 (30.3) | 73 (43.7) | .179 | .560 | (.251, 1.250) |
| Ground-glass opacity | 4 (12.1) | 31 (18.6) | .460 | .605 | (.198, 1.847) |
| Tree-in-bud opacities | 4 (12.5) | 66 (40) | .002 | .214 | (.072, .639) |
| Scarring | 10 (30.3) | 27 (16.4) | .084 | 2.222 | (.950, 5.195) |
| Emphysema | 7 (21.9) | 24 (14.5) | .296 | 1.645 | (.640, 4.225) |
| Pleural thickening | 3 (9.4) | 9 (5.5) | .417 | 1.793 | (.458, 7.024) |
| Pleural effusion | 1 (3.8) | 5 (3.2) | 1.000 | 1.192 | (.134, 10.634) |
| Duration of treatment, mean ± SD, m | 9.2 ± 8.4 | 14.9 ± 9.9 | .005 | .917 | (.864, .973) |
| Adherence to ATS/IDSA treatment guidelines, n (%) | 20 (58.8) | 120 (64.2) | .566 | .798 | (.378, 1.681) |
| No. of antibiotics administered as initial therapy, n (%) | |||||
| 1 | 2 (6.7) | 5 (3.3) | .359 | … | … |
| 2 | 4 (13.3) | 13 (8.7) | … | … | |
| ≥3 | 24 (80) | 132 (88) | … | … | |
| Aspergillus coinfection at diagnosis, n (%) | 4 (11.8) | 13 (7) | .306 | 1.785 | (.545, 5.841) |
| Staphylococcus aureus coinfection at diagnosis, n (%) | 4 (11.8) | 17 (9.1) | .540 | 1.334 | (.420, 4.238) |
| Pseudomonas aeruginosa coinfection at diagnosis, n (%) | 2 (5.9) | 22 (11.8) | .547 | .469 | (.105, 2.093) |
| Met ATS/IDSA diagnostic guidelines, n (%) | 26 (76.5) | 134 (71.7) | .679 | 1.285 | (.547, 3.019) |
Abbreviations: ATS/IDSA, American Thoracic Society/Infectious Diseases Society of America; BMI, body mass index; CAP, community acquired pneumonia; CI, confidence interval; COPD, chronic obstructive pulmonary disease; DM, diabetes mellitus; IQR, interquartile range; MAC, Mycobacterium avium-intracellulare complex; NTM, nontuberculous mycobacteria; PFT, pulmonary function tests; TB, tuberculosis.
Multivariate Predictors of Mortality Among Patients With Pulmonary MAC
| Demographic and Clinical Characteristics | aOR | 95% CI |
|---|---|---|
| Age | 1.030 | (.997, 1.064) |
| Female | .368 | (.160, .849) |
| Cavitation | 3.176 | (1.369, 7.371) |
| Tree-in-bud opacities | .282 | (.091, .874) |
| Demographic and Clinical Characteristics | aOR | 95% CI |
|---|---|---|
| Age | 1.030 | (.997, 1.064) |
| Female | .368 | (.160, .849) |
| Cavitation | 3.176 | (1.369, 7.371) |
| Tree-in-bud opacities | .282 | (.091, .874) |
The aORs and 95% CIs were estimated from a multivariable logistic regression model of all characteristics as independent variables and mortality as the dependent variable.
Abbreviations: aOR, adjusted odds ratio; CI, confidence interval; MAC, Mycobacterium avium-intracellulare complex.
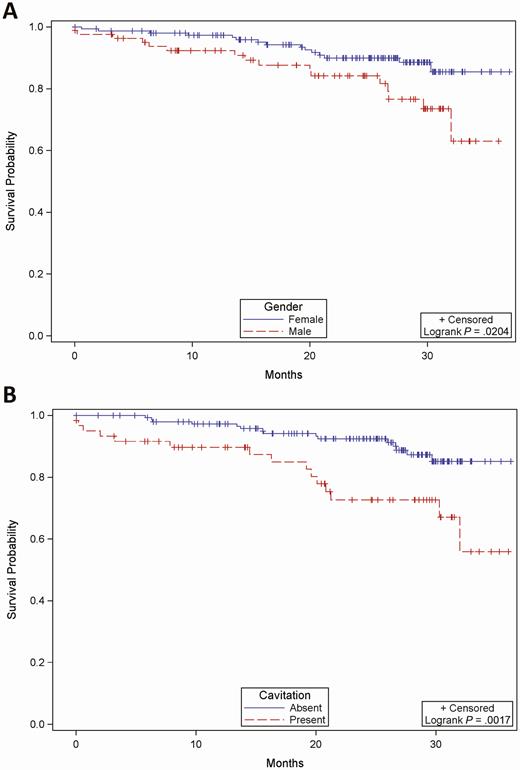
Kaplan-Meier estimate of survival of patients with pulmonary NTM. Overall survival is shown for patients with pulmonary NTM based on sex (A) and presence or absence of cavitation on imaging studies (B). Male patients compared with female patients and patients with cavitation compared with those without cavitary lesions on imaging studies had a shorter median overall survival, with P = .02 and .0017, respectively, by the log-rank test. Abbreviation: NTM, nontuberculous mycobacteria.
Supplementary Table 6 compares the initial and follow-up clinical courses of treated (n = 245) and untreated (n = 45) patients with pulmonary NTM. There were no significant differences between the 2 groups in the number of patients who required hospitalization and mortality. The frequency of symptomatic improvement was similar in treated (29.4%) and untreated (25.9%) groups during the 30-month follow-up.
DISCUSSION
The increasing prevalence of pulmonary NTM in the United States has prompted the scientific community to identify critical gaps in diagnosis and treatment [23]. Our findings in this multicenter study indicate that MAC, M. kansasii, and M. abscessus are the most common causes of pulmonary NTM disease in adults who are negative for HIV. The finding of M. kansasii as the second most common cause is surprising when compared with a previous report [24]. Adherence to ATS/IDSA guidelines was low, confirming results reported previously [25, 26]. Despite ATS/IDSA guidelines, management of pulmonary NTM disease was heterogenous and cure rate among those who received antibiotic treatment was low [27, 28], suggesting the need for a careful selection of patients who can be followed without treatment or increasing adherence to optimized treatment regimens.
In high-risk patients, particularly those with underlying lung diseases, differentiating NTM colonization from disease is challenging [29]. Therefore, the diagnosis of pulmonary NTM disease relies on a combination of clinical findings, radiographic changes, and cultures or histopathology of respiratory specimens [12, 30]. The clinical manifestations and radiologic findings of pulmonary NTM in patients in this multicenter study were similar to findings in previous single-center reports [12, 31]. The demographics of our patients, including sex, age, ethnicity, and BMI, were also similar to demographics reported previously [5, 32]. In addition, our study demonstrates that MAC, M. kansasii, and M. abscessus are the most common causes of pulmonary NTM in the United States [12, 15].
Because the treatment response of pulmonary NTM caused by different NTM species varies [33–36] and because most of our patients were infected with MAC, we performed a subgroup analysis of the cure rates of patients with MAC. The 54.5% cure rate of patients with pulmonary MAC in our study is better than the 42% cure rate reported in a meta-analysis [37] but lower than the 66% cure rate reported for patients who received triple therapy for at least 1 year [27]. Treatment modification was required in one-third of our patients, primarily due to adverse drug effects. Adverse drug effects that warrant treatment modification are commonly seen in patients receiving daily treatment [38]; however, for patients with nonfibrocavitary MAC, intermittent therapy 3 times per week may be preferable [38].
Macrolides are key drugs for the treatment of pulmonary MAC and M. abscessus, and both macrolide susceptibility and history of macrolide use have been shown to predict treatment outcomes of pulmonary MAC [39–41]. In our study, macrolide use and macrolide resistance did not differ based on cure. A high level of resistance to amikacin is alarming because inhaled amikacin is one of the promising drugs for salvage therapy or for treatment of patients with fibrocavitary pulmonary MAC [13, 42]. Amikacin resistance, particularly high-level resistance with genetic mutations, is associated with poor treatment outcome [43].
In our study, female sex and pulmonary tree-in-bud opacities were associated with improved survival, while weight loss, chronic kidney disease, pulmonary infiltrates/opacities, and cavitation were associated with decreased survival. These findings confirm previous reports on the association of sex and pulmonary cavitation with mortality [44, 45] and provide predictors of mortality that will have relevance in future studies aimed at determining criteria for early initiation of treatment or addition of new drugs to standard treatment regimens.
Forty-five patients with pulmonary NTM in our study were followed without treatment. This group had similar demographic and clinical findings to those who received antimicrobial therapy, including comorbidities and microbiologic and radiologic characteristics. The mortality rate in untreated patients was not different from the mortality rate in treated patients. Interestingly, rates of clinical improvement and culture conversion were similar between the untreated and the treated patient groups. One explanation is that there were clinical indications that were not identified by the study’s data collection forms that led physicians to not treat, a bias that we cannot identify; nevertheless, these results suggest that, for selected patients with pulmonary NTM, follow-up without treatment may be an appropriate strategy. Identifying patients who are at high risk of deterioration if left untreated is important [46]. Further studies are needed to determine prognostic factors that support follow-up of patients with pulmonary NTM without treatment and to identify indicators for initiation of NTM treatment during the follow-up period.
The limitations of this retrospective study include the following: (1) different sampling schemes used by sites, which may introduce bias; (2) incomplete follow-up for many patients, which may have introduced bias; (3) lack of data on treatment adherence; and (4) lack of insight into factors prompting clinicians to treat versus not treat. While more systematic data in these areas would have been helpful, in many ways our study reflects the realities of NTM pulmonary disease management, with no evidence-based consensus on what studies should be done to follow these patients and with what frequency they should be done.
In conclusion, in this multicenter retrospective study at 7 tertiary centers in the United States, MAC was the most common cause of pulmonary NTM. Adherence to ATS/IDSA guidelines was moderate, although in a multivariable regression analysis adherence to guidelines was not associated with improved cure rates, suggesting that follow-up without treatment is an option for carefully selected patients. The mortality rate in patients who were followed without treatment was similar to the mortality rate of patients who received antimycobacterial treatment. Predictors of mortality identified in our patients will have relevance in future studies to identify criteria for the selection of patients who can be followed without treatment, guide early initiation of treatment, and inform the addition of new drugs to routinely used regimens.
Supplementary Data
Supplementary materials are available at Clinical Infectious Diseases online. Consisting of data provided by the authors to benefit the reader, the posted materials are not copyedited and are the sole responsibility of the authors, so questions or comments should be addressed to the corresponding author.
Notes
Acknowledgments. The authors thank Brad Ford, Geri Dull, Doug Hornick, and Thuy Nguyen from the University of Iowa; Sonia Krengel from Emory University School of Medicine; Joyce Gandee and Lynn Harrington from Duke University School of Medicine; and Tracey Lanford from Baylor College of Medicine for helping in the review of medical records or supervision of activities related to review of medical records. We also thank Chris Focht from the Emmes Corporation for help in statistical analysis,
Financial support. This work was supported by the National Institute of Allergy and Infectious Diseases, part of the National Institutes of Health, through grants to the Vaccine and Treatment Evaluation Units that participated in this study: Saint Louis University (grant number HHSN272201300021I), Emory University School of Medicine (grant number HHSN272201300018I), University of Iowa (grant number HHSN272201300020I), Baylor College of Medicine (grant number HHSN272201300015I), Duke University School of Medicine (grant number HHSN272201300017I), Vanderbilt University Medical Center (grant number HHSN272201300023I), and Kaiser Permanente Washington Health Research Institute (grant number HHSN272201300019I) and by the Emmes Corporation (grant number HSN272201500002C).
Potential conflicts of interest. N. R. reports grants from Merck, Pfizer, and Sanofi Pasteur, outside the submitted work. L. J. reports funding to her institution for the conduct of vaccine clinical trials from Pfizer, outside the submitted work. E. G. reports that Sanofi Aventis provided medication for a clinical trial on tuberculosis treatment shortening, outside the submitted work. All other authors report no potential conflicts. All authors have submitted the ICMJE Form for Disclosure of Potential Conflicts of Interest. Conflicts that the editors consider relevant to the content of the manuscript have been disclosed.

