


Abstract
The Centers for Medicare and Medicaid Services (CMS) implemented a core measure sepsis (SEP-1) bundle in 2015. One element was initiation of broad-spectrum antibiotics within 3 hours of diagnosis. The policy has the potential to increase antibiotic use and Clostridioides difficile infection (CDI). We evaluated the impact of SEP-1 implementation on broad-spectrum antibiotic use and CDI occurrence rates.
Monthly adult antibiotic data for 4 antibiotic categories (surgical prophylaxis, broad-spectrum for community-acquired infections, broad-spectrum for hospital-onset/multidrug-resistant [MDR] organisms, and anti–methicillin-resistant Staphylococcus aureus [MRSA]) from 111 hospitals participating in the Clinical Data Base Resource Manager were evaluated in periods before (October 2014–September 2015) and after (October 2015–June 2017) policy implementation. Interrupted time series analyses, using negative binomial regression, evaluated changes in antibiotic category use and CDI rates.
At the hospital level, there was an immediate increase in the level of broad-spectrum agents for hospital-onset/MDR organisms (+2.3%, P = .0375) as well as a long-term increase in trend (+0.4% per month, P = .0273). There was also an immediate increase in level of overall antibiotic use (+1.4%, P = .0293). CDI rates unexpectedly decreased at the time of SEP-1 implementation. When analyses were limited to patients with sepsis, there was a significant level increase in use of all antibiotic categories at the time of SEP-1 implementation.
SEP-1 implementation was associated with immediate and long-term increases in broad-spectrum hospital-onset/MDR organism antibiotics. Antimicrobial stewardship programs should evaluate sepsis treatment for opportunities to de-escalate broad therapy as indicated.
(See the and the .)
Sepsis is a serious condition that occurs in hospitalized patients with numerous manifestations involving systemic inflammatory response syndrome. Sepsis in the presence of organ dysfunction is considered severe sepsis, and septic shock occurs in the presence of circulatory cellular and metabolic abnormalities [1]. In 2014, among 409 hospitals in the United States (US), the incidence of sepsis was estimated at 6.0%, with 54.7% of cases requiring intensive care and 21.2% resulting in an in-hospital death or discharge to hospice [2]. Between 2009 and 2011, there were > 1.2 million adult emergency room visits due to a sepsis diagnosis in the US [3]. The mortality rate is 8 times higher than the mortality rate of all inpatients. Costs for sepsis treatment totaled $15.4 billion in 2009, making sepsis the most expensive condition among inpatients [4].
To facilitate timely and high-quality sepsis care, beginning 1 October 2015, the Centers for Medicare and Medicaid Services (CMS) implemented a composite process measure, the Sepsis Bundle Core Performance Measure for hospitals participating in Inpatient Quality Reporting (SEP-1) [5]. The SEP-1 bundle requires specific time frames for volume assessment, intravenous fluids, lactate measurement, blood cultures, and broad-spectrum antibiotics [6]. To comply with the measure, > 50 measures must be met for persons presenting with severe sepsis or septic shock. One of the components is the time to first antibiotic dose (TFAD), which requires antibiotics to be administered within 3 hours of diagnosis. The SEP-1 policy outlines recommended antibiotics for initial coverage with 1 or more broad-spectrum agents that can be chosen to provide coverage of the causative pathogen [7]. These include antibiotics that provide coverage for gram-positive and -negative organisms, such as methicillin-resistant Staphylococcus aureus (MRSA) and Pseudomonas aeruginosa, respectively.
A previous infection-related core measure that included a TFAD component focused on community-acquired pneumonia (CAP). When the CAP TFAD was changed from 8 hours to 4 hours in 1998, the lack of a gold standard for CAP diagnosis and difficulties in chest radiography interpretation [8–10] led to misdiagnoses and the unintended consequences of inappropriate antibiotic use in order to comply with the measure [11]. Besides patient harm and the development of antimicrobial resistance, a significant concern with the use of broad-spectrum antibiotics is the development of Clostridioides difficile infection (CDI). In particular, the association between a CDI outbreak and CAP TFAD has been documented in the literature [12]. The implementation of SEP-1 may have led to similar unintended consequences but has not been fully investigated.
Although the establishment of hospital national performance measures are intended to improve patient outcomes, there may be unintended consequences in other areas not measured by quality indicators, for example, a potential increase in antibiotic-resistant infections or CDI when use of broad-spectrum antibiotics is promoted. Correctly identifying and diagnosing infection and sepsis can also be challenging [13, 14]. Most patients with sepsis do not have documented bacteremia [2], and the clinical diagnosis of sepsis is poorly associated with the presence of infection in post hoc assessments [15]. Fever, leukocytosis, and tachycardia are not specific to infections, while infections can also be present without these cardinal symptoms [16]. While it is important to initiate timely empiric broad-spectrum antibiotics in the face of a sepsis diagnosis, the need to adhere to aggressive timelines as specified in SEP-1’s bundled care may result in sepsis overdiagnoses and, consequently, possible untoward effects including development of antimicrobial resistance and CDI associated with inappropriate antibiotic use. The National Quality Forum recommended that broad-spectrum antibiotic use and CDI incidence be considered as SEP-1 balancing measures [17]. The purpose of this study was to evaluate the extent to which SEP-1 implementation impacted broad-spectrum antibiotic utilization and CDI occurrence.
METHODS
Data Source
This is a hospital-level, quasi-experimental investigation of member hospitals of Vizient, Inc (www.vizientinc.com). Segmented regression analysis with interrupted time series data was used to study the SEP-1 policy’s unanticipated consequences [18]. The study time period included pre– and post–SEP-1 implementation periods (October 2014–September 2015 and October 2015–June 2017, respectively). Vizient is the largest US member-driven healthcare performance improvement company and includes academic medical centers, pediatric facilities, and community hospitals. A subset of hospitals (approximately 144 in 2016) participates in the Clinical Data Base Resource Manager (CDB/RM) program. The CDB/RM contains detailed information on inpatient care such as procedure and diagnosis data from charge transaction masters and inpatient billing files. Medication data elements include specific therapy and duration. These medication data have been previously validated and used in studies concerning antimicrobial prescribing [19, 20].
Hospitals were included in our analysis if they subscribed to the CDB/RM through the study period and had complete information concerning adults (age ≥ 18 years) and had a minimum of 25 cases of either severe sepsis or septic shock as indicated by International Classification of Diseases (ICD) codes (ICD-9: 78552 and 99592; ICD-10: R65.20 and R65.21) in both pre– and post–SEP-1 periods. These ICD-9/10 codes for severe sepsis with or without septic shock were as specified in Appendix A, Table 4.01 of the National Hospital Inpatient Quality Reporting Measures Specifications Manual [21]. We set a criterion for ≥ 25 cases in each year of the study period based on minimum case criteria for other CMS measures (eg, acute myocardial infarction) [22]. Oncology specialty hospitals were excluded from the study. This study was approved by Virginia Commonwealth University’s Institutional Review Board.
Outcome Measures
Data retrieved from the CDB/RM included monthly data during the study period concerning systemic antibiotic use, expressed in 4 categories per the Centers for Disease Control and Prevention’s National Healthcare Safety Network Antimicrobial Use Option (version 2014) [23] as days of therapy (DOT) per 1000 patient-days (PD). If a patient received a single antibiotic dose on a given day, whether or not multiple doses were administered, it was recorded as 1 DOT. If a patient received > 1 antibiotic on the same day, each antibiotic was also counted as 1 DOT. The DOT was aggregated to the hospital level.
The antibiotic categories were as follows:
Broad-spectrum agents predominantly used for hospital-onset/multidrug-resistant (MDR) organisms (amikacin, aztreonam, cefepime, ceftazidime, ceftazidime-avibactam, ceftolozane-tazobactam, doripenem, gentamicin, imipenem-cilastatin, meropenem, piperacillin, piperacillin-tazobactam, ticarcillin-clavulanate, tigecycline, tobramycin, (colistimethate and polymyxin B not included due to infrequent use).
Broad-spectrum agents predominantly used for community-acquired infections (cefotaxime, ceftriaxone, ciprofloxacin, ertapenem, gemifloxacin, levofloxacin, moxifloxacin).
Anti-MRSA agents (ceftaroline, daptomycin, linezolid, quinupristin/dalfopristin, telavancin, vancomycin [dalbavancin, oritavancin, tedizolid not included as data were not available]).
Agents predominantly used for surgical site infection prophylaxis (cefazolin, cefotetan, cefoxitin [cefuroxime and cephalexin not included due to frequent use for other infections]).
We did not expect SEP-1 to have an impact on surgical site infection prophylaxis agent utilization and considered this a control category. To assess the potential impact of SEP-1 implementation on CDI occurrence, a fifth outcome measure was CDI monthly rates (number of cases/1000 admissions). A case was defined as an ICD code for CDI (ICD-9 = 008.45; ICD-10 = A04.7) that was not present upon admission; this restricted the outcome to infections that were healthcare facility onset [24].
Data Analysis
Segmented regression analyses with interrupted time series data were used to evaluate SEP-1 impact on 5 outcomes (4 antibiotic categories and CDI). The changes in the level and trend (slope) of the outcomes before and after SEP-1 implementation were evaluated by setting the change point as 1 October 2015. Negative binomial generalized linear mixed regression models were chosen because of the prevalence of overdispersion. To account for the variability in hospitalizations, an offset of patient-days was included. Therefore, the model was as follows:
where Yit is 1 of the outcomes (eg, broad-spectrum DOT/1000 PD in month t for hospital i); time is a continuous monthly variable from the start of the study period; intervention (code “0” or “1”) is an indicator for time t after SEP-1 (October 2015–June 2017); time after intervention is a continuous monthly variable counting months after SEP-1 (October 2015–June 2017) at time t; case mix index value in month t is a variable to account for patient acuity; quarter is a quarterly dummy variable to account for seasonality (ie, December–February, March–May, June–August, September–November); and eit is the random error term. Thus, β0 represents baseline level of mean broad-spectrum DOT/1000 PD at time 0 and when all variables equal 0, β1 is the change in mean DOT/1000 PD each month before SEP-1, β2 is the change in level in mean DOT/1000 PD after SEP-1, and β3 is the change in trend in post- as compared to pre–SEP-1. Random effects were included for the overall intercept (u0i), the change in level (u2i), and the change in trend (u3i). A variance components covariance structure was used for random effects while a first-order autoregressive covariance structure was given to the error term to account for the decreasing correlation as the duration between observations increases. A similar analysis was performed for healthcare facility–onset CDIs; however, the offset was log (admissionsit/1000) and the random effect for the change in trend was eliminated due to a non-positive-definite matrix. For all analyses, the Huber-White sandwich estimator was used to obtain robust variance estimates.
For the main analysis, all hospital patients’ DOT were included if the hospital met inclusion criteria.
Sensitivity Analysis
A sensitivity analysis was carried out on a subset of inpatients to evaluate the impact of SEP-1 on a population directly affected by SEP-1. Analyses were similar, including identical ICD-9/10 codes as the main analysis, but hospitals’ DOT were restricted to only those patients with either an ICD diagnosis code of severe sepsis or septic shock and who were not transferred from another acute care facility.
All analyses were completed using SAS version 9.4 software (SAS Institute, Cary, North Carolina). Two-sided P values ≤ .05 were considered statistically significant.
RESULTS
A total of 122 hospitals had complete data for the duration of the study period; 6 hospitals were removed from analyses as they were oncology hospitals and 5 were removed as they did not have a minimum of 25 sepsis cases, leaving 111 for analyses. Regarding location, 22.5% of hospitals were located in the Northeast, 29.7% in the South, 30.6% in the Midwest, and 17.1% in the West. Transplant programs were present in 63.6% of the hospitals, and half of the hospitals (55.5%) were a level I trauma center. The median number of acute care beds was 536 (interquartile range [IQR], 330–738). Across the study period, there was a total of 40 908 558 patient-days from 7 353 968 inpatient admissions (median, 63 002 [IQR, 33 233–89 567]) and included 293 665 sepsis cases (per-hospital severe sepsis cases: median, 1198.0 [IQR, 634.0–1940.0]; septic shock cases: median, 1204.0 [IQR, 501.0–1693.0]). Because ICD-9 was transitioned to ICD-10 at the same time as SEP-1 implementation (October 2015) [25], we also assessed whether code shifting could have occurred at the time of SEP-1 implementation (Supplementary Figure 1).
Figure 1A displays the mean antibiotic utilization by category across the study period among all hospital admissions. The broad-spectrum agents predominantly used for hospital-onset/MDR organisms were the most commonly used. The results from the negative binomial regression models are presented in Table 1. Despite a smaller proportion of admissions coded as severe sepsis with or without septic shock after SEP-1 implementation, there was a statistically significant long-term effect of SEP-1 implementation (change in slope) on the use of broad-spectrum antibiotics for hospital-onset/MDR organism agents (+0.40% per month). As for immediate level changes pre– and post–SEP-1 implementation, there were small but statistically significant increases, by 2.3% and 1.4%, in the use of broad-spectrum antibiotics for hospital-onset/MDR organism agents and the overall usage of all antibiotic groupings, respectively. The mean and variability in the trend (slope) and level changes for broad-spectrum hospital-onset/MDR organism agents can be seen in Figures 2 and 3, respectively. There were no statistically significant changes in the level or slope from pre– to post–SEP-1 implementation for anti-MRSA agents, surgical infection prophylaxis, or broad-spectrum agents for community-acquired infection. Unexpectedly, we also observed a statistically significant decrease of 7.3% in CDI rates immediately following SEP-1 implementation (change in level).
Full Results of Segmented Negative Binomial Regression Analyses
| Outcome | Variable | IRR | (95% CI) | P Value |
|---|---|---|---|---|
| Broad-spectrum agents predominantly used for hospital-onset/MDR bacteria | ||||
| Baseline level | 113.962 | (99.082–131.076) | < .0001 | |
| Trend preimplementation | 0.995 | (.992–.997) | < .0001 | |
| Change in level at implementation | 1.023 | (1.002–1.044) | .0375 | |
| Trend postimplementation | 0.999 | (.997–1.001) | .1866 | |
| Change in trend postimplementation | 1.004 | (1.001–1.008) | .0273 | |
| Case mix index | 1.330 | (1.246–1.420) | ||
| Quarter (reference: September–November) | ||||
| December–February | 1.001 | (1.002–1.021) | .0142 | |
| March–May | 0.995 | (.985–1.006) | .3841 | |
| June–August | 0.992 | (.982–1.001) | .0696 | |
| Anti-MRSA agents | ||||
| Baseline level | 84.591 | (73.814–96.942) | < .0001 | |
| Trend preimplementation | 0.997 | (.995–1.000) | .0253 | |
| Change in level at implementation | 0.997 | (.980–1.015) | .7765 | |
| Trend postimplementation | 0.999 | (.997–1.001) | .4088 | |
| Change in trend postimplementation | 1.002 | (.999–1.005) | .2509 | |
| Case mix index | 1.332 | (1.242–1.428) | < .001 | |
| Quarter (reference: September–November) | ||||
| December–February | 1.019 | (1.009–1.028) | <.0001 | |
| March–May | 1.011 | (1.001–1.022) | .0339 | |
| June–August | 1.008 | (.999–1.018) | .0966 | |
| Broad-spectrum agents predominantly used for community-acquired infection | ||||
| Baseline level | 154.505 | (138.431–172.447) | < .0001 | |
| Trend preimplementation | 0.999 | (.997–1.002) | .6261 | |
| Change in level at implementation | 1.016 | (.994–1.038) | .1528 | |
| Trend postimplementation | 0.996 | (.995–.998) | .0001 | |
| Change in trend postimplementation | 0.997 | (.994–1.000) | .0743 | |
| Case mix index | 0.981 | (.929–1.036) | .981 | |
| Quarter (reference: September–November) | ||||
| December–February | 1.038 | (1.029–1.048) | < .0001 | |
| March–May | 1.019 | (1.009–1.029) | .0001 | |
| June–August | 0.991 | (.982–1.001) | .0661 | |
| Agents predominantly used for surgical site infection prophylaxis | ||||
| Baseline level | 60.945 | (53.958–68.836) | < .0001 | |
| Trend preimplementation | 1.001 | (.998–1.004) | .4736 | |
| Change in level at implementation | 1.017 | (1.000–1.034) | .0533 | |
| Trend postimplementation | 1.001 | (1.000–1.003) | .0921 | |
| Change in trend postimplementation | 1.000 | (.996–1.004) | .9643 | |
| Case mix index | 1.148 | (1.090–1.210) | < .0001 | |
| Quarter (reference: September–November) | ||||
| December–February | 0.969 | (.961–.978) | < .0001 | |
| March–May | 0.963 | (.954–.972) | < .0001 | |
| June–August | 0.991 | (.983–1.000) | .0523 | |
| Healthcare facility–onseta CDI | ||||
| Baseline level | 0.885 | (.630–1.243) | .4832 | |
| Trend preimplementation | 0.995 | (.986–1.002) | .1708 | |
| Change in level at implementation | 0.927 | (.873–.985) | .0154 | |
| Trend postimplementation | 0.992 | (.987–.997) | .0028 | |
| Change in trend postimplementation | 0.997 | (.987–1.007) | .5988 | |
| Case mix index | 2.308 | (1.898–2.806) | < .0001 | |
| Quarter (reference: September–November) | ||||
| December–February | 1.046 | (1.010–1.084) | .0117 | |
| March–May | 1.033 | (1.000–1.067) | .0492 | |
| June–August | 0.987 | (.947–1.028) | .5290 | |
| Overall (composite of all antibiotic groupings) | ||||
| Baseline level | 411.980 | (376.896–450.330) | < .0001 | |
| Trend preimplementation | 0.997 | (.996–.999) | .0003 | |
| Change in level at implementation | 1.014 | (1.002–1.026) | .0293 | |
| Trend postimplementation | 0.999 | (.998–1.000) | .0090 | |
| Change in trend postimplementation | 1.001 | (.999–1.003) | .1823 | |
| Case mix index | 1.205 | (1.153–1.260) | < .0001 | |
| Quarter (reference: September–November) | ||||
| December–February | 1.014 | (1.008–1.021) | < .0001 | |
| March–May | 0.999 | (.992–1.007) | .8813 | |
| June–August | 0.995 | (.989–1.001) | .1161 |
Abbreviations: CDI, Clostridioides difficile infection; CI, confidence interval; IRR, incidence rate ratio; MDR, multidrug-resistant; MRSA, methicillin-resistant Staphylococcus aureus.
aDefined as present upon admission indicator = “no” for International Classification of Diseases (ICD) CDI codes (00845 [ICD-9] and A047 [ICD-10]).
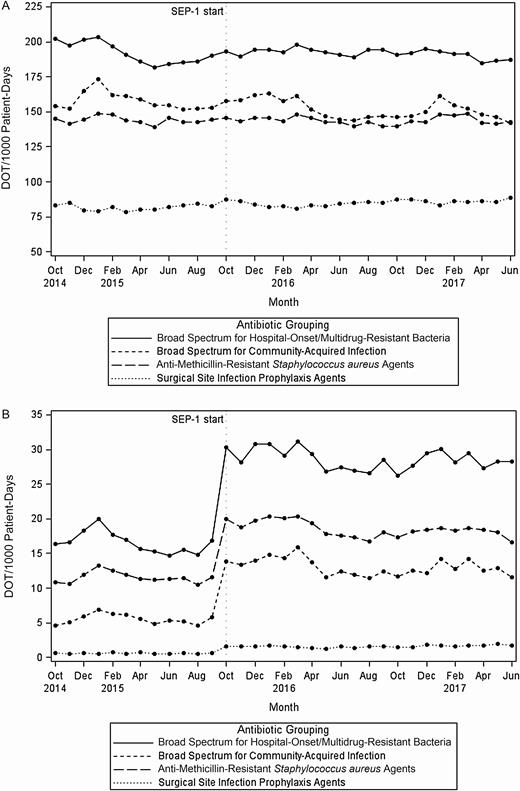
Hospital antibiotic category use in mean days of therapy per 1000 patient-days by month (N = 111). A, Among all hospital admissions. B, Restricted to patients with severe sepsis with or without septic shock. Abbreviations: DOT, days of therapy; SEP-1, Severe Sepsis/Septic Shock Early Management Bundle.
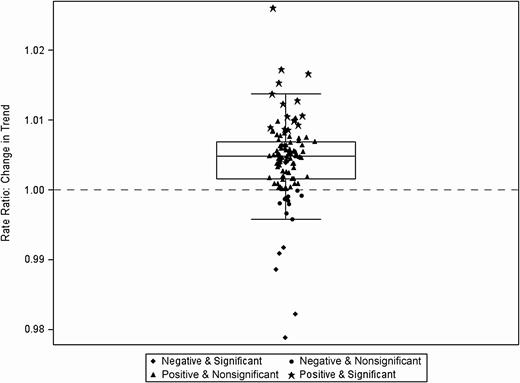
Change in trend (slope) before and after Severe Sepsis/Septic Shock Early Management Bundle (SEP-1) implementation for broad-spectrum agents predominantly used for community-acquired infections among all hospital admissions (N = 111). Each data point indicates estimate of change in trend at 1 hospital, inclusive of the random effect.
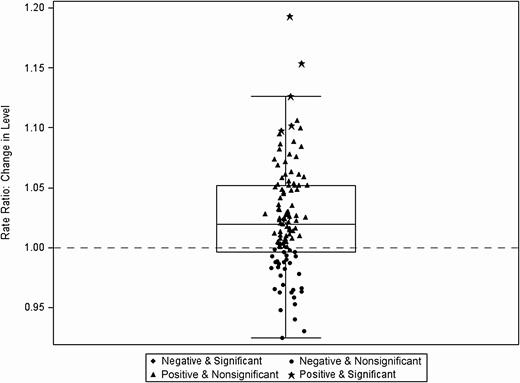
Immediate level change at the time of Severe Sepsis/Septic Shock Early Management Bundle (SEP-1) implementation for broad-spectrum agents predominantly used for hospital-onset/multidrug-resistant bacteria (N = 111). Each data point indicates estimate of change in trend at 1 hospital, inclusive of the random effect.
Due to missing data, a total of 107 hospitals were represented in the sensitivity analysis of the subset of inpatients who had an ICD diagnosis code of severe sepsis with or without septic shock and were not transferred from another acute care facility. There was a total of 40 613 657 patient-days among 291 748 cases (severe sepsis or septic shock). We did not find significant long-term changes in any individual antibiotic groupings or overall antibiotic use before and after SEP-1 implementation (Table 2 and Figure 1B). However, there were significant and sizable immediate increases (level changes) in antibiotic use (all antibiotic categories as well as overall use) in the immediate period following SEP-1 implementation: 88.9% increase in overall antibiotic use, and individual antibiotic categories ranging from a 64.7% increase in MRSA agents to a 284% increase in antimicrobials for surgical prophylaxis (Table 2 and Figure 1B).
Results of Segmented Negative Binomial Regression Analyses for Sensitivity Data
| Outcome | Variable | IRR | (95% CI) | P Value |
|---|---|---|---|---|
| Broad-spectrum agents predominantly used for hospital-onset/MDR bacteria | ||||
| Baseline level | 6.264 | (4.265–9.200) | < .0001 | |
| Trend preimplementation | 0.993 | (.986–1.000) | .0649 | |
| Change in level at implementation | 1.807 | (1.681–1.940) | < .0001 | |
| Trend postimplementation | 0.996 | (.992–.999) | .0068 | |
| Change in trend postimplementation | 1.002 | (.994–1.010) | .5779 | |
| Case mix index | 1.665 | (1.368–2.026) | < .0001 | |
| Quarter (reference: September–November) | ||||
| December–February | 1.070 | (1.044–1.096) | < .0001 | |
| March–May | 1.014 | (.987–1.043) | .3142 | |
| June–August | 0.960 | (.929–.991) | .0120 | |
| Anti-MRSA agents | ||||
| Baseline level | 4.243 | (2.889–6.229) | < .0001 | |
| Trend preimplementation | 1.000 | (.992–1.008) | .9861 | |
| Change in level at implementation | 1.647 | (1.495–1.814) | < .0001 | |
| Trend postimplementation | 0.993 | (.989–.996) | .0001 | |
| Change in trend postimplementation | 0.993 | (.984–1.002) | .1184 | |
| Case mix index | 1.643 | (1.348–2.002) | < .0001 | |
| Quarter (reference: September–November) | ||||
| December–February | 1.079 | (1.046–1.113) | < .0001 | |
| March–May | 1.043 | (1.010–1.077) | .0098 | |
| June–August | 0.963 | (.928–.999) | .0442 | |
| Broad spectrum agents predominantly used for community-acquired infection | ||||
| Baseline level | 2.635 | (1.780–3.900) | < .0001 | |
| Trend preimplementation | 1.001 | (.992–1.010) | .8777 | |
| Change in level at implementation | 2.433 | (2.199–2.692) | < .0001 | |
| Trend postimplementation | 0.991 | (.988–.995) | < .0001 | |
| Change in trend postimplementation | 0.991 | (.981–1.000) | .0653 | |
| Case mix index | 1.417 | (1.143–1.757) | .0015 | |
| Quarter (reference: September–November) | ||||
| December–February | 1.087 | (1.050–1.126) | < .0001 | |
| March–May | 1.059 | (1.019–1.101) | .0038 | |
| June–August | 0.964 | (.929–.999) | .0450 | |
| Agents predominantly used for surgical site infection prophylaxisa | ||||
| Baseline level | 0.006 | (.001–.029) | < .0001 | |
| Trend preimplementation | 1.024 | (.993–1.056) | .1273 | |
| Change in level at implementation | 2.835 | (2.070–3.883) | < .0001 | |
| Trend postimplementation | 0.991 | (.988–.995) | < .0001 | |
| Change in trend postimplementation | 0.986 | (.955–1.019) | .4028 | |
| Case mix index | 7.032 | (3.007–16.444) | < .0001 | |
| Quarter (reference: September–November) | ||||
| December–February | 1.219 | (1.055–1.408) | .0071 | |
| March–May | 1.011 | (.883–1.157) | .8786 | |
| June–August | 0.937 | (.800–1.098) | .4210 | |
| Overall (composite of all antibiotic groupings) | ||||
| Baseline level | 13.072 | (9.192–18.589) | < .0001 | |
| Trend preimplementation | 0.997 | (.999–1.004) | .4009 | |
| Change in level at implementation | 1.889 | (1.753–2.035) | < .0001 | |
| Trend postimplementation | 0.994 | (.991–.997) | < .0001 | |
| Change in trend postimplementation | 0.997 | (.989–1.004) | .4231 | |
| Case mix index | 1.642 | (1.367–1.972) | < .0001 | |
| Quarter (reference: September–November) | ||||
| December–February | 1.076 | (1.050–1.102) | < .0001 | |
| March–May | 1.031 | (1.006–1.057) | .0137 | |
| June–August | 0.962 | (.935–.990) | .0080 |
The outcome Clostridioides difficile infection was not studied due to low occurrence.
Abbreviations: CI, confidence interval; IRR, incidence rate ratio; MDR, multidrug-resistant; MRSA, methicillin-resistant Staphylococcus aureus.
aRandom effect on change in slope omitted and residuals assumed to be independent and uncorrelated to obtain convergence.
DISCUSSION
We sought to evaluate the extent to which SEP-1 implementation impacted broad-spectrum antibiotic utilization and CDI occurrence. When the analysis was not restricted to patients with sepsis, among 111 hospitals, this quasi-experimental study found that the trend in use of broad-spectrum antibiotics for hospital-onset/MDR infections significantly increased between the pre– and post–SEP-1 periods over the long term (change in slopes), whereas the increase in level immediately following implementation was also significant, albeit small. Use of broad-spectrum antimicrobials for hospital-onset/MDR organisms was decreasing pre–SEP-1, but experienced an immediate increase at the time of SEP-1 implementation and then remained flat thereafter. Overall antibiotic utilization also significantly increased immediately following SEP-1 implementation. Though robust interrupted time series methods were used to study unanticipated consequences of SEP-1, the noted significant changes in antibiotic use in the main analysis were relatively small on a percentage scale.
Particularly in regards to care of patients with severe sepsis or septic shock, although long-term changes in trends (slopes) did not remain significant in our sensitivity analyses on a population directly affected by SEP-1, the immediate increases in the use of all antibiotic categories and overall antibiotic use were significant and, in fact, were more pronounced. We observed an 89% increase in overall antibiotic use, with 64.7% to 284% increases among individual antibiotic categories. These findings were observed despite a possible undercounting of severe sepsis cases, evidenced by potential code shifting when ICD-9 was transitioned to ICD-10 in October 2015 (Supplementary Figure 1).
Similar to our results, an interrupted time series study among medicine wards from June 2011 to July 2014 found that an electronic sepsis treatment protocol led to an increased level change in broad-spectrum antibiotic use (50.4 DOT/1000 PD) in the postprotocol as compared to preprotocol implementation period [26]. There was also an increased level change in CDI rates (10.8 events per 10 000 PD) in this previous study.
In contrast to this previous study, we found an unexpected immediate decrease in healthcare facility-onset CDI post–SEP-1 implementation. Our quasi-experimental study design does not allow us to examine the potential explanations for this finding. Nationally, C. difficile cases have been slightly decreasing since 2015 [27]. Our findings of a decreased CDI rate after SEP-1 may reflect the countervailing effects of this national trend.
Importantly, these findings occurred during the early implementation phase of SEP-1. The SEP-1 measure was not included in the total performance score for hospital value-based purchasing, nor yet reported on Hospital Compare during the study period (reporting commenced in 2018 with 2017 data). A study of adherence rate to SEP-1 during the 2 years after SEP-1 implementation found that among 851 sepsis cases presenting within 7 hospitals, 67% failed to meet the measure [28]. It is possible that antibiotic use may increase at a higher rate due to SEP-1 once penalties are in place and adherence to SEP-1 increases. Further investigations are needed to assess the ongoing impact of SEP-1 in terms of both sepsis outcomes and antibiotic use, such as CDI, on sepsis populations and hospital-wide.
The SEP-1 policy has been questioned as to whether it represents, in its “all-or-nothing” fashion, high-quality sepsis care. The specific antibiotic selections meeting requirements for SEP-1 antibiotic therapy have been questioned for appropriateness [29]. The SEP-1 “Broad Spectrum or Other Antibiotic Administration Selection” element contains tables that list appropriate antibiotic choices, but emphasizes broad-spectrum agents and does not list all antibiotics. Furthermore, SEP-1 measures may lead to a reflexive overuse of broad-spectrum antibiotics without the opportunity for clinical discretion [30], and conflicts with the principles of antimicrobial stewardship, which aim to improve antimicrobial prescribing quality, reduce resistance, and minimize consequences related to overprescribing [31].
Practical difficulties remain when trying to diagnose sepsis. Previous studies suggest that up to 40% of patients with a “diagnosis” of sepsis admitted to intensive care do not actually have an infection [15]. Hence, SEP-1 may also affect care processes not in the SEP measure set in order to meet the quality measure definition to be captured, with negative consequences to patients. For example, the rush to meet the rigid timeframe stipulated for infected patients increases the likelihood that broad-spectrum antibiotics will be given to uninfected patients with a clinical presentation that resemble infections [32].
There are several limitations to this research. The majority of hospitals that participate in the CDB/RM, the study’s data source, are large academic medical centers. Thus, the results are largely representative of this hospital population. A larger sample of hospitals that included other hospital types could result in different findings. Another limitation is that hospitals may have implemented sepsis protocols before SEP-1 implementation [33], which could potentially lower the magnitude and or statistical significance of findings attributed to the timing of SEP-1 implementation. Furthermore, the increases in antibiotic use we reported could be underestimated, given that fewer cases of severe sepsis were reported when ICD-9 was transitioned to ICD-10, which occurred at the same time as SEP-1 implementation. Additionally, while interrupted time series analysis is a strong quasi-experimental research design for evaluating the effectiveness of population-level health interventions [34], its inherent design precludes direct comparison to a control group. While we controlled for factors that we believe could have caused changes in the use of antibiotics, such as seasonality and hospitals’ case mix index, unmeasured factors beyond the implementation of SEP-1 could have caused the significant changes found in our analyses. Hence, findings from this study should be considered hypothesis generating, and should not be used to suggest that introduction of the SEP-1 measures was the only factor responsible for the changes in antibiotic use we observed. Last, ICD-9/ICD-10 codes were used to identify healthcare facility–onset CDIs. While incorporating the use of the present-on-admission indicator to denote the occurrence of the infection in the hospital as opposed to the community improves specificity (to 93%) over the use of the ICD code alone, the sensitivity at 1 institution was found to be moderate (68%) [24].
In conclusion, the findings of this study support continuing observation of antibiotic utilization following SEP-1 implementation. Meeting the 3-hour antibiotic TFAD is an important element of SEP-1; however, these data suggest that antimicrobial stewardship programs should apply postprescription audit and feedback strategies among sepsis patients to ensure that antibiotic de-escalation is occurring appropriately. Utilization of all of the different antibiotic categories appeared to be affected, especially among the subset of sepsis patients. Further investigations regarding higher use of broad-spectrum antibiotics and impact on CDI and antibiotic resistance development are warranted.
Supplementary Data
Supplementary materials are available at Clinical Infectious Diseases online. Consisting of data provided by the authors to benefit the reader, the posted materials are not copyedited and are the sole responsibility of the authors, so questions or comments should be addressed to the corresponding author.
Notes
Acknowledgments. It is with great sadness that the authors share the passing of the lead author, Dr Amy L. Pakyz, a wonderful colleague, mentor, and leader across the infectious diseases community. Dr Pakyz left a legacy in infectious diseases epidemiology and inspired countless students and residents to pursue careers in infectious diseases. She was a good friend and is dearly missed. In addition, the authors thank Kai I. Cheang, PharmD, MS, of Scientific Value, LLC, for her professional assistance in preparing and editing the manuscript.
Financial support. This work was supported by the Virginia Commonwealth University Presidential Research Quest Fund to A. L. P.
Potential conflicts of interest. D. J. M. has received honoraria for journal and book editing from Springer Nature; has been a coinvestigator on awards for the Centers for Disease Control and Prevention, the National Institutes of Health, and the Agency for Healthcare Research and Quality; has received a Merit Award for infection control work from the Veterans Affairs Health Services Research and Development Service; and reports travel expenses from the Infectious Diseases Society of America and the Society for Healthcare Epidemiology of America, outside the submitted work. All other authors report no potential conflicts of interest. All authors have submitted the ICMJE Form for Disclosure of Potential Conflicts of Interest. Conflicts that the editors consider relevant to the content of the manuscript have been disclosed. M. P. Stevens has received honoraria from Springer Nature for journal editing.

