


Abstract
The World Health Organization (WHO) does not recommend routine adult booster vaccination for tetanus and diphtheria after completion of the childhood vaccination series. However, many countries continue to implement adult booster vaccinations, leading to the question of whether this is necessary to reduce the incidence of these 2 rare diseases.
We conducted an observational cohort study based on WHO case reports from 2001 through 2016. We compared the incidence of tetanus and diphtheria in 31 North American and European countries that either do or do not recommend adult booster vaccination.
Countries that vaccinate adults every 5–20 years (group 1) were compared with countries that do not routinely vaccinate adults for tetanus or diphtheria (group 2). Comparison of group 1 vs group 2 revealed no significant decline in tetanus incidence rates among countries that vaccinate adults (P = .52; risk ratio [RR] = 0.78; 95% confidence interval [CI], .36 to 1.70). The risk of contracting diphtheria was increased among countries that vaccinate adults due to inclusion of Latvia, a country that had poor vaccination coverage (P < .001). However, if Latvia is excluded, there is no difference in diphtheria incidence between countries that do or do not routinely vaccinate adults (P = .26; RR = 2.46; 95% CI, .54 to 11.23).
Review of >11 billion person-years of incidence data revealed no benefit associated with performing adult booster vaccinations against tetanus or diphtheria. Similar to other vaccines, this analysis supports the WHO position on adult booster vaccination and, if approved by governing health authorities, this may allow more countries to focus healthcare resources on vulnerable and undervaccinated populations.
Vaccination schedules are often developed empirically and therefore subject to modification and further optimization over time. For example, in 1955, adult tetanus and diphtheria booster vaccination in the United States was recommended every 3 years [1]. By 1964, the recommendation had shifted to booster vaccination every 5 years [2]. In 1966, the adult booster vaccination schedule was adjusted to once every 10 years [3, 4], and this policy has remained unchanged for more than half a century. In contrast to the United States, the World Health Organization (WHO) recommends no adult tetanus or diphtheria booster vaccinations for individuals who have completed their childhood vaccination series [5–8], and at least 10 European countries do not currently recommend routine booster vaccination for adults. Although we [9–12] and others [13–17] have shown that antibody responses to tetanus and diphtheria may be long-lived, there is little comparative data available with regard to disease incidence in the presence or absence of routine adult booster vaccination.
Here, we examined the incidence rates of tetanus and diphtheria among countries that do or do not recommend adult booster vaccination to determine if adult booster programs provide a benefit over childhood vaccination alone. We found no decline in tetanus or diphtheria incidence rates among countries that routinely vaccinate adults. These results support the WHO position on adult booster vaccination [5–8]. Bearing in mind that tetanus-related deaths have declined by >99% and diphtheria-related deaths have declined by >99.9% since the prevaccine era [18, 19] and that most tetanus- and diphtheria-related cases/deaths in industrialized nations are occurring among unvaccinated/undervaccinated individuals [19–21], this work suggests that future efforts should focus on increasing vaccination coverage of these susceptible members of the population.
METHODS
An observational cohort study was conducted using secondary sources from the WHO [22] and World Bank [23]. A univariate negative binomial regression (NBR) model was used to compare incidence rates between groups (see Supplementary Materials).
RESULTS
Tetanus: Vaccination Schedules and Incidence Rates
Among industrialized nations, approximately 95%–97% of reported cases of tetanus occur among adults aged >20 years [24, 25]. If adult booster vaccination at regular intervals is necessary to maintain immunity, then one might anticipate the incidence of tetanus to be higher among nonvaccinating countries or that there would be an increased incidence of tetanus over time among countries that do not recommend routine adult vaccinations. An initial comparison of 2 representative countries provides valuable insight into this question. For example, France and the United Kingdom are both large European countries that are similar in terms of socioeconomic status, geographical location (33 kilometers/21 miles apart), population (67 million vs 66 million people in 2016), childhood vaccination schedules (5 doses recommended for both countries), and infant vaccination coverage (96% vs 94% vaccination coverage, respectively; Table 1). The key difference between these countries is that France recommends routine booster vaccinations for adults (10-year booster schedule until 2012 with 79% document-verified tetanus vaccination coverage [26]) before switching to a 20-year booster schedule for adults aged ≤60 years by 2014 (https://vaccine-schedule.ecdc.europa.eu/), whereas the United Kingdom has never recommended booster vaccination for adults who have completed their primary vaccination series. Analysis of 1.7 billion person-years of data collected from 2001 through 2016 indicates that both countries maintain low incidence rates of tetanus (0.2 cases/million in France and 0.1 cases/million in the United Kingdom; Table 1). This indicates that despite a robust adult booster program in France maintained with nearly 80% documented compliance, there was no decline in the incidence of tetanus in comparison with a similarly sized country (United Kingdom) that does not recommend adult booster vaccination.
Incidence of Tetanus in North America and Europe
| Group Designation | Childhood Vaccinations | Adult Vaccinations | Incidence Rateb (per 1 000 000 Person-years) | |
|---|---|---|---|---|
| Number of Doses | Percentage Vaccination Coveragea | |||
| Group 1: North Americac | ||||
| Canada | 6 | 91 | Every 10 years | 0.09 |
| Mexico | 6 | 97 | Every 10 years | 0.42 |
| United States | 6 | 95 | Every 10 years | 0.09 |
| Range | 6 | 91–97 | Every 10 years | 0.09–0.42 |
| Group 1: Europed | ||||
| Austria | 5 | 87 | Every 10 yearse | 0.00 |
| Belgium | 6 | 98 | Every 10 years | 0.13 |
| Bulgaria | 7 | 92 | Every 10 years | 0.26 |
| Cyprus | 6 | 97 | Every 10 years | 0.18 |
| Czech Republic | 6 | 96 | Every 10–15 years | 0.03 |
| Estonia | 6 | 93 | Every 10 years | 0.23 |
| Finland | 5 | 92 | Every 10 years | 0.00f |
| France | 5 | 96 | Every 10–20 yearsg | 0.21 |
| Germany | 6 | 95 | Every 10 years | Not reported |
| Greece | 6 | 99 | Every 10 years | 0.48 |
| Italy | 5 | 94 | Every 10 years | 0.85 |
| Latvia | 6 | 98 | Every 10 years | 0.10 |
| Lithuania | 6 | 94 | Every 5–10 years | 0.55 |
| Luxembourg | 6 | 99 | Every 10 years | 0.00 |
| Portugal | 6 | 98 | Every 10 years | 0.45 |
| Romania | 6 | 89 | Every 10 years | 0.56 |
| Slovakia | 5 | 96 | Every 15 years | 0.05 |
| Slovenia | 6 | 94 | Every 10 years | 1.08 |
| Sweden | 5 | 97 | Every 20 years | 0.09 |
| Range | 5–7 | 87–99 | Every 5–20 years | 0–1.08 |
| Group 2: Europed | ||||
| Croatia | 7 | 93 | 1h | 1.14 |
| Denmark | 4 | 94 | – | 0.13 |
| Hungary | 6 | 99 | – | 0.39 |
| Iceland | 5 | 91 | – | 0.00 |
| Ireland | 5 | 95 | – | 0.18 |
| Malta | 6 | 97 | – | 0.75 |
| The Netherlands | 6 | 95 | – | 0.10 |
| Poland | 6 | 98 | 1h | 0.52 |
| United Kingdom | 5 | 94 | – | 0.12 |
| Range | 4–7 | 91–99 | 0–1.14 |
aVaccination coverage in 2016 of infants receiving at least 3 doses of tetanus and diphtheria containing vaccine by age 1 year: http://apps.who.int/gho/data/node.main.A827.
bIncidence rates were determined for each country by dividing the cumulative cases reported to the World Health Organization from 2001 through 2016 by the sum of the mid-year populations from 2001 through 2016. Tetanus incidence data from North America group 1, Europe group 1, and Europe group 2 comprised approximately 6.93 billion person-years, 2.73 billion person-years, and 1.92 billion person-years, respectively.
cUS Childhood and Adult Vaccinations: https://www.cdc.gov/vaccines/vpd/dtap-tdap-td/public/index.html. Canada Adult Vaccinations: https://www.canada.ca/en/public-health/services/vaccination-adults.html. Canada Childhood Vaccinations: https://www.canada.ca/en/public-health/services/immunization/vaccine-preventable-diseases/tetanus/prevention.html. Mexico Adult Vaccinations: Gutierrez-Robledo et al [27]. Mexico Childhood Vaccinations: https://www.cdc.gov/vaccines/schedules/downloads/child/binational-schedule-pr.pdf.
eRecommend individuals aged >60 years receive booster vaccination every 5 years.
fFinland only reported tetanus incidence in 2015.
gIn 2012, France recommended adult booster vaccinations every 10 years [26] and, by 2014, recommended booster vaccinations every 20 years except that individuals aged >60 years still receive booster vaccinations every 10 years (https://vaccine-schedule.ecdc.europa.eu/).
hRecommend 1 booster vaccination at age 18–20 years. Individuals in Croatia aged >60 years also receive 1 booster vaccination. Dashed lines indicate that no routine adult booster vaccinations are recommended.
Although comparisons between France and the United Kingdom provide important information on 2 similar countries, to determine if these results are more broadly applicable to other countries, we expanded our analysis to 11.6 billion person-years of incidence data from 31 North American and European countries (Table 1). Two groups were formed based on vaccination schedules: group 1 consists of 3 North American countries and 19 European countries that vaccinate adults every 5–20 years. Group 2 consists of 9 European countries that recommend no booster vaccinations against tetanus after the age of 20, with the only exception being Croatia, a small country of 4.2 million people that recommends a single booster for those aged >60 years [28]. The range in tetanus incidence rates between individual countries that do or do not routinely vaccinate adults is similar (Table 1), and both group 1 and group 2 showed a gradual decline in the incidence of tetanus from approximately 0.37–0.45 cases/million person-years in 2001 to ≤0.23 cases/million person-years by 2016 (Figure 1A). The trend line for group 2 is particularly revealing because it shows that the incidence of tetanus does not increase over time but instead remains similar to that for group 1 despite no routine vaccination of the adult population.
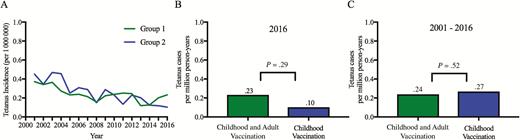
Incidence rates of tetanus, 2001–2016. Incidence rates were determined for 2 groups of countries based on their individual adult vaccination schedules. Longitudinal trends were determined for group 1 countries that vaccinate adults against tetanus every 5–20 years, whereas countries in group 2 do not routinely vaccinate adults for tetanus (A). The incidence data (per million person-years) from group 1 and group 2 were compared in a single year (2016) (B) and compared after pooling data from 2001 through 2016 (C) using a negative binomial regression model.
To determine the impact of adult vaccination on the incidence of tetanus among the countries described in this study, we compared these groups based on a single recent year (eg, 2015 or 2016) or based on pooled multiyear (2001–2016) incidence data (Figure 1B, 1C). In 2016, tetanus occurred at a rate of 0.23 cases/million person-years (95% confidence interval [CI], .18 to .29) in countries that routinely vaccinate adults compared with 0.10 cases/million person-years (95% CI, .05 to .19) among countries that do not routinely vaccinate adults (Figure 1B; P = .29, NBR). Likewise, in 2015, the rates of tetanus reported to the WHO were 0.20 cases/million person-years (95% CI, .17 to .24) vs 0.12 cases/million person-years (95% CI, .06 to .21), respectively (P = .70, NBR). These year-to-year values represent the relatively rare number of events reported in any given year; a more accurate assessment of disease occurrence may be obtained by pooling data across multiple years of observation. Based on data from 2001 through 2016, countries in group 1 had a rate of 0.24 tetanus cases/million person-years (95% CI, .23 to .25), whereas countries in group 2 had an incidence rate of 0.27 cases of tetanus/million person-years (95% CI, .25 to .29) (Figure 1C). NBR modeling indicated no difference in the incidence of tetanus among countries that vaccinate adults compared with those that do not routinely vaccinate adults (group 1 vs group 2, risk ratio [RR] = 0.78; 95% CI, .36 to 1.70). Overall, both groups had an incidence rate of <1 case of tetanus per 3 million person-years, regardless of the adult vaccination schedule. After analyzing 11.6 billion person-years of data, these results indicate that there is no significant difference in disease risk between countries that do or do not recommend adult tetanus vaccination (P = .52, NBR).
Diphtheria: Vaccination Schedules and Incidence Rates
We compared the incidence of diphtheria in France with the incidence in the United Kingdom, since these countries are similar except for their adult vaccination schedules. In practice, no country maintains 100% adult vaccination coverage; in 2002, vaccination coverage among those aged >16 years in France reached 57% [30]. Decennial diphtheria booster vaccination was recommended in 2005 and in 2011, yet, France still maintained 58% document-verified adult vaccination coverage [26], similar to other countries such as the United States (63%–64% adult vaccination coverage [31, 32]). Analysis of approximately 1.8 billion person-years of combined diphtheria incidence data revealed that diphtheria is very rare in both countries (0.06 cases/million in France and 0.03 cases/million in the United Kingdom; Table 2). This means that despite no recommendations for routine adult booster vaccination in the United Kingdom, the annual number of diphtheria cases remained low (0–6 cases/year) and comparable to those observed in France (0–14 cases/year), suggesting that herd immunity and disease surveillance efforts are adequate for controlling diphtheria in these countries.
Incidence of Diphtheria in North America and Europe
| Group Designation | Childhood Vaccinations | Adult Vaccinations | Incidence Rateb (per 1 000 000 Person-years) | |
|---|---|---|---|---|
| Number of Doses | Percent Vaccination Coveragea | |||
| Group 1: North Americac | ||||
| Canada | 6 | 91 | Every 10 years | 0.04 |
| Mexico | 6 | 97 | Every 10 years | 0.00 |
| United States | 6 | 95 | Every 10 years | 0.001 |
| Range | 6 | 91–97 | Every 10 years | 0–0.04 |
| Group 1: Europed | ||||
| Austria | 5 | 87 | Every 10 yearse | 0.03 |
| Belgium | 6 | 98 | Every 10 years | 0.07 |
| Bulgaria | 7 | 92 | Every 10 years | 0.00 |
| Cyprus | 6 | 97 | Every 10 years | 0.00 |
| Estonia | 6 | 93 | Every 10 years | 0.09 |
| Finland | 5 | 92 | Every 10 years | 0.04 |
| France | 5 | 96 | Every 10–20 yearsf | 0.06 |
| Germany | 6 | 95 | Every 10 years | 0.05 |
| Greece | 6 | 99 | Every 10 years | 0.00 |
| Italy | 5 | 94 | Every 10 years | 0.002 |
| Latvia | 6 | 98 | Every 10 years | 10.06 |
| Lithuania | 6 | 94 | Every 5–10 years | 0.16 |
| Luxembourg | 6 | 99 | Every 10 years | 0.00 |
| Portugal | 6 | 98 | Every 10 years | 0.00 |
| Romania | 5 | 89 | Every 10 years | 0.00 |
| Slovakia | 5 | 96 | Every 15 years | 0.00 |
| Slovenia | 5 | 94 | Every 10 years | 0.00 |
| Sweden | 5 | 97 | Every 20 years | 0.08 |
| Range | 5–7 | 87–99 | Every 5–20 years | 0–10.06 |
| Range (minus Latvia) | 5–7 | 87–99 | Every 5–20 years | 0–0.16 |
| Group 2: Europed | ||||
| Croatia | 7 | 93 | 1g | 0.00 |
| Czech Republic | 6 | 96 | – | 0.00 |
| Denmark | 4 | 94 | – | 0.01 |
| Hungary | 6 | 99 | – | 0.00 |
| Iceland | 5 | 91 | – | 0.00 |
| Ireland | 5 | 95 | – | 0.02 |
| Malta | 5 | 97 | – | 0.00 |
| The Netherlands | 6 | 95 | – | 0.04 |
| Poland | 6 | 98 | 1g | 0.00 |
| United Kingdom | 5 | 94 | – | 0.03 |
| Range | 4–7 | 91–99 | 0–0.04 |
aVaccination coverage in 2016 of infants receiving at least 3 doses of tetanus and diphtheria containing vaccine by 1 year of age: http://apps.who.int/gho/data/node.main.A827.
bIncidence rates were determined for each country by dividing the cumulative cases reported to the World Health Organization from 2001 through 2016 by the sum of the mid-year populations from 2001 through 2016. Diphtheria incidence data from North America group 1, Europe group 1, and Europe group 2 comprised approximately 6.93 billion person-years, 4.24 billion person-years, and 2.19 billion person-years, respectively.
cUS Childhood and Adult Vaccinations: https://www.cdc.gov/vaccines/vpd/dtap-tdap-td/public/index.html. Canada Adult Vaccinations: https://www.canada.ca/en/public-health/services/vaccination-adults.html. Canada Childhood Vaccinations: https://www.canada.ca/en/public-health/services/immunization/vaccine-preventable-diseases/tetanus/prevention.html. Mexico Adult Vaccinations: Gutierrez-Robledo et al [27]. Mexico Childhood Vaccinations: https://www.cdc.gov/vaccines/schedules/downloads/child/binational-schedule-pr.pdf.
eRecommend individuals aged >60 years receive booster vaccination every 5 years.
fIn 2012, France recommended adult booster vaccinations every 10 years [26] and, by 2014, recommended booster vaccinations every 20 years except that individuals aged >60 years still receive booster vaccinations every 10 years (https://vaccine-schedule.ecdc.europa.eu/).
gRecommend 1 booster vaccination at age 18–20 years. Dashed lines indicate that no routine adult booster vaccinations are recommended.
To determine if the comparisons between similar countries such as France and the United Kingdom are applicable to a broader population, we examined 13.4 billion person-years of incidence data from 31 countries. Among North American countries in group 1 that recommend adult booster vaccination every 10 years, the average incidence of diphtheria ranged from 0 to 0.04 diphtheria cases/million person-years (Table 2). Mexico reported no diphtheria cases since their last reported case in 1991 [27]. Canada had an incidence rate of 0.04 cases of diphtheria/million person-years, whereas only 4 cases were reported in the United States from 2001 through 2016, for an incidence rate of 0.001 cases/million person-years. The average incidence of diphtheria in Europe group 1 ranged from 0 to 10.06 cases/million person-years. This upper limit of 10.06 cases/million person-years occurred in Latvia, with the majority of reported cases occurring among unvaccinated adults [21]. This triggered a supplementary adult immunization program that was initiated in 1995. Excluding Latvia, the range of diphtheria cases ranged from 0 to 0.16/million person-years in countries that routinely vaccinate adults, which is comparable to countries that do not routinely vaccinate adults (0 to 0.04 diphtheria cases/million person-years).
Longitudinal incidence trends were plotted to determine if there was an increased incidence of diphtheria over time among countries that do not routinely vaccinate adults (Figure 2A). Group 1 countries (excluding Latvia) and group 2 countries had low rates of diphtheria that typically resided below 0.1 cases/million person-years. Since Latvia had a higher incidence rate of diphtheria compared with the other European countries (Table 2), it is represented by its own inset graph in Figure 2A. If waning immunity resulted in loss of protection, then an increase in outbreak size and disease incidence might occur over time among the countries in group 2. However, since the incidence of diphtheria has remained at ≤1 reported case/25 million person-years among these 10 countries, these data indicate that the risk of waning herd immunity in the absence of routine adult vaccination is low.
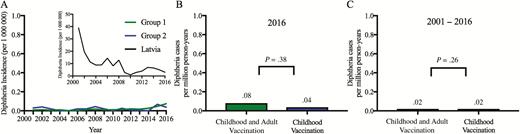
Incidence rates of diphtheria, 2001–2016. The longitudinal trends in incidence rates (per million person-years) were determined for group 1 countries that vaccinate adults against diphtheria every 5–20 years (excluding Latvia, see inset graph) and group 2 countries that do not routinely vaccinate adults for diphtheria (A). The diphtheria incidence data from group 1 (excluding Latvia) and group 2 were compared in a single year (2016) (B) and compared after pooling data from 2001 through 2016 (C) using a negative binomial regression model.
To determine if adult booster vaccination reduces the incidence of a disease as rare as diphtheria, the study population was divided into 2 groups for comparison based on their adult vaccination schedules (Figure 2B, 2C). In 2016, diphtheria occurred at a rate of 0.09 cases/million person-years (95% CI, .06 to .12) in group 1 countries, which was not significantly different from the rate of 0.04 cases/million person-years (95% CI, .01 to .10) among group 2 countries (P = .17, NBR). Exclusion of Latvia from this former group slightly reduced the incidence rate to 0.08 cases/million person-years (95% CI, .05 to .11) among countries that vaccinate adults. This was also not statistically different from countries that do not vaccinate adults (Figure 2B; P = .38, NBR). For comparisons in 2015, the incidence of diphtheria (including Latvia) was 0.06 cases/million person-years (95% CI, .04 to .08), which was not significantly different from 0.07 cases/million person-years (95% CI, .03 to .13) among countries that do not vaccinate adults (P = .38, NBR or P = .57, NBR if Latvia is excluded from the 2015 analysis). To reduce year-to-year variability in these comparisons, the pooled diphtheria incidence rate was determined from 2001 through 2016 (Figure 2C). Group 1 countries had a rate at 0.05 (95% CI, .04 to .05) diphtheria cases/million person-years, whereas group 2 countries had 0.02 (95% CI, .02 to .03) diphtheria cases/million person-years (P < .001). However, this comparison is skewed by Latvia. If Latvia is removed, the incidence of diphtheria drops from 0.05 to 0.02 (95% CI, .01 to .02) cases/million person-years and the difference in incidence rates between the 2 groups is nonsignificant (P = .26; group 1 vs group 2: RR = 2.46 and 95% CI, .54 to 11.23). Together, this indicates that after analyzing 13.4 billion person-years of data, there was no significant difference in the incidence rates of diphtheria reported among countries that do or do not routinely vaccinate adults.
DISCUSSION
In 2006, the WHO recommended only 1 additional booster vaccination for adults who completed their childhood vaccination series, preferably at the time of first pregnancy or during military service [33]. In 2017, the WHO modified their position on adult vaccinations [5–8] to indicate that those who have received their complete tetanus and diphtheria childhood vaccination series no longer require routine adult booster vaccinations. Several nations continue to recommend adult booster vaccinations, and it is unclear if this may be due to the lack of comparative evidence regarding disease risk in countries that do not routinely vaccinate their adult population. To address this question, we used multiple approaches to examine disease incidence among 31 countries that differed in their adult booster vaccination guidelines. Direct comparison of 2 large adjacent European countries with similar socioeconomic status and similar childhood vaccination programs (ie, France and the United Kingdom) showed no association between adult booster vaccination and reduction in disease incidence. Likewise, there was no difference in disease incidence trends from 2001 through 2016 among up to 31 countries from Europe and North America that do or do not recommend adult booster vaccinations. No significant increase in single-year incidence rates (ie, 2015 or 2016) or in cumulative incidence rates of disease (ie, 2001 through 2016) was observed among countries that do not routinely vaccinate adults. Together, this work supports the 2017 WHO guidelines [5–7] and the 2019 Summary on WHO Position Papers [8] that recommend DTP-containing vaccines only for children and adolescents.
In addition to routine/scheduled booster vaccinations, administration of tetanus- and diphtheria-containing vaccines may be recommended for certain types of international travel or as postexposure prophylaxis for tetanus-prone injuries in accordance with WHO recommendations or country-specific guidelines. This may also contribute to increased host immunity. Likewise, the introduction of new glycoconjugate vaccines that utilize tetanus toxoid or diphtheria toxoid as carrier proteins may also elicit antitoxin immunity [34]. However, the timing at which these glycoconjugate vaccines were introduced into the study populations makes it unlikely that they are responsible for the results observed here (see Supplementary Discussion).
Diphtheria continues to circulate within several low- and middle-income countries (eg, India, Nigeria, Yemen, among others [35]), and this poses a risk for importation of new cases. For example, in 1986, there was a cluster of 4 symptomatic diphtheria cases that involved unvaccinated children from the same family of recent immigrants from Bangladesh to the United Kingdom. However, extensive investigation of nearly 250 contacts resulted in the identification of no additional cases, indicating that local herd immunity was sufficient in reducing transmission [19]. Further support for herd immunity in the absence of routine adult booster vaccination may also be extrapolated from the low transmission rates in the United Kingdom, where reports of toxigenic diphtheria ranged from only 1 to 9 symptomatic cases per year from 1986 through 2008, resulting in an incidence rate of 0.14 cases/million in 1986 to 0.017 cases/million in 2004 [19]. It is noteworthy that there were 5 deaths associated with respiratory diphtheria in the United Kingdom from 1986 through 2008. However, all 5 fatalities occurred among unvaccinated individuals [19], indicating that potential waning of vaccine-mediated immunity among the vaccinated adult population was not a factor in these cases.
WHO reports do not provide age-stratified incidence data. However, this is unlikely to be a major factor for interpreting the tetanus data from the countries described here since 95%–97% of tetanus cases in industrialized nations occur among adults [24, 25]. Therefore, analysis of adult vaccination schedules is appropriate for a disease that is mainly observed among adults. Moreover, previous studies have found that essentially all tetanus patients who have received ≥3 vaccinations are expected to survive [20]. Therefore, the risk of fatal tetanus is low among those who have completed their 4- to 7-dose childhood vaccination series. In terms of diphtheria, our data show that among 10 industrialized countries that do not routinely vaccinate adults, 6 countries did not report a single case of diphtheria from 2001 through 2016. Among the 4 nonvaccinating countries in group 2 that reported at least 1 case of diphtheria, the largest outbreak occurred in the United Kingdom, with a total of only 6 cases reported to the WHO in 2002. Rare contemporary cases of diphtheria in industrialized nations mainly occur among unvaccinated/undervaccinated individuals. Yet, in the United Kingdom, this still represents a >99.9% reduction in disease incidence compared with the prevaccine era (Figure 1 in [19]), and this level of community protection is maintained in the absence of adult booster vaccination. Coupled with modern clinical care and antibiotics that further provide 99.8% survival among fully or partially vaccinated individuals [21], these studies together indicate that diphtheria can be effectively managed without requiring a routine adult booster vaccination program.
The main strength of this study is that multiple approaches were used to determine if routine adult booster vaccination altered rates of disease incidence. In addition, the main conclusions are based on >11 billion person-years of tetanus and diphtheria incidence data that have been obtained from the WHO Vaccine-Preventable Diseases Monitoring System, with high concordance by cross-reference to available reports by the US Centers for Disease Control and Prevention and the European Centre for Disease Prevention and Control (Supplementary Figure 1). This large dataset is critical for comparing rare diseases that occur at a frequency of < 1 case/million person-years (Figure 1 and Figure 2). In terms of limitations, the outcome measures provided here refer to specific North American and European countries and may not be applicable to countries with low vaccination coverage, substantial age-based gaps in coverage, or poor healthcare infrastructure, which is essential for ensuring high childhood vaccination coverage and for accurately determining the incidence rates for tetanus and diphtheria. Nevertheless, if WHO guidelines were adopted only in the United States (1 of at least 21 countries described here that implement adult booster vaccinations), the risk-to-benefit ratio of immunization would improve due to a concomitant decrease in vaccine-associated adverse events, including a reduction of approximately 13 200 medically attended local vaccine site reactions, approximately 800 cases of cellulitis, and up to 73 cases of ulcerated lesions that would be anticipated to occur when 15.2 million adult vaccinations are administered annually in the United States (see Supplementary Materials). Furthermore, we estimate that removing the recommendation of decennial adult booster vaccination would save approximately $1.03 billion annually in healthcare costs in the United States alone (range, $0.68 billion to $1.39 billion; Supplementary Table 1). It is possible that these cost savings could then be used to target vaccination programs to vulnerable populations of unvaccinated/undervaccinated people who currently account for the majority of tetanus and diphtheria cases [20, 21].
After examining >11 billion person-years of data, our findings indicate that there is no significant decline in tetanus or diphtheria incidence rates among countries that routinely vaccinate adults for either of these 2 rare diseases. These “legacy” vaccines against tetanus and diphtheria were developed before modern regulatory agencies existed. Based on the results provided here, these vaccines could potentially join at least 9 other vaccines (eg, measles, mumps, rubella, polio, hepatitis A virus, hepatitis B virus, Haemophilus influenzae B, rotavirus, and human papillomavirus) that do not require routine adult booster vaccination after the primary childhood series has been completed. Implementation of the WHO guidelines on adult tetanus and diphtheria vaccination would reduce the number of vaccine-associated adverse events and allow countries that are successful in implementing their childhood immunization schedules to focus financial resources on vulnerable populations such as pregnant women, recent immigrants from countries with poor vaccination coverage, and undervaccinated populations, such as elderly individuals with unknown or incomplete childhood vaccination schedules.
Supplementary Data
Supplementary materials are available at Clinical Infectious Diseases online. Consisting of data provided by the authors to benefit the reader, the posted materials are not copyedited and are the sole responsibility of the authors, so questions or comments should be addressed to the corresponding author.
Notes
Author contributions. All authors contributed to the concept and study design and had full access to the data included in the study. A. M. S. organized and analyzed the raw data and prepared the figures and tables. B. P. and L. G. performed the statistical analyses and critically reviewed the manuscript prior to submission. A. M. S. and M. K. S. wrote the manuscript. The corresponding author declares that all authors meet authorship criteria and that no others meeting the criteria have been omitted. M. K. S. had full access to all of the data in the study and takes responsibility for the integrity of the data and the accuracy of the data analysis.
Acknowledgments. The authors thank Ian Amanna for critical review of the manuscript and Jacob Slifka for assistance with review of US Centers for Disease Control and Prevention/European Centre for Disease Prevention and Control case reports and double-data entry. The complete dataset from this study is available upon request from the corresponding author.
Disclaimer. The funders of this research were not involved in the study design, data analysis, manuscript preparation, or decision to publish this work. The opinions, results, and conclusions reported in this article are those of the authors and independent from the funding sources.
Financial support. This work was supported in part by the National Institute of Allergy and Infectious Diseases (grant R01 AI132186 to M. K. S.) and the Oregon National Primate Research Center (grant 8P51 OD011092 to M. K. S.).
Potential conflicts of interest. The authors: No reported conflicts of interest. All authors have submitted the ICMJE Form for Disclosure of Potential Conflicts of Interest. Conflicts that the editors consider relevant to the content of the manuscript have been disclosed.
References

