


Abstract
Norovirus is a leading cause of acute gastroenteritis worldwide, yet there is limited information on homotypic or heterotypic protection following natural infection to guide vaccine development.
A total of 6020 stools collected from 299 Peruvian children between 2010 and 2014 were tested by norovirus real-time reverse-transcription polymerase chain reaction followed by sequence-based genotyping. Cox proportional hazards models were used to derive adjusted hazard ratios (HRs) of infection among children with vs without prior exposure.
Norovirus was detected in 1288 (21.3%) samples. GII.4 (26%), GII.6 (19%), and GI.3 (9%) viruses accounted for 54% of infections. Homotypic protection for GI.3 (HR, 0.35; P = .015), GI.7 (HR, 0.19; P = .022), GII.4 (HR, 0.39; P < .001), and GII.6 (HR, 0.52; P = .006) infections was observed. Hazard analysis showed that children with prior GII.4 infection exhibited heterotypic protection with a 48% reduction of subsequent GI.3 infection (HR, 0.52; P = .005). Prior exposure to GI.3, GII.2, and GII.17 infections enhanced susceptibility to subsequent infections with several other norovirus genotypes.
Children up to 2 years of age infected with GII.4 noroviruses demonstrated both homotypic and heterotypic protection to reinfection with other genotypes. These data support the need for ongoing vaccine development efforts with GII.4 as the main component and caution the inclusion of genotypes that may enhance susceptibility to infections.
(.)
Noroviruses are associated with approximately 18% of all cases of acute gastroenteritis globally [1]. In children, noroviruses cause 70 000–200 000 deaths per year worldwide, of which the majority occur in developing countries [2]. Noroviruses are a genetically diverse group of viruses with a genome that consists of single-stranded positive-sense RNA of 7.5 kb in length. The genome of human norovirus is organized into 3 open reading frames (ORFs) of which ORF2 encodes the major capsid protein (VP1) [3]. Based on sequence differences of the VP1 protein, noroviruses are classified into 10 genogroups (GI–GX) and 49 genotypes with most of the infections in humans caused by GI and GII viruses, of which GII.4 viruses are the most prevalent genotype worldwide [4].
Although norovirus infects people of all ages, children are most susceptible to infections during their first years of life and they can, depending upon their environmental and health conditions, be reinfected multiple times with different norovirus genotypes [5–8]. Early human volunteer studies showed a lack of cross-protective immunity between viruses from the 2 major genogroups (GI and GII), and in 1 study volunteers did not develop clinical symptoms when rechallenged with the same strain 6 months after first challenge, suggesting that clinical immunity exists [7]. Recent insights suggest that the high titer of the challenge virus may not have mimicked natural exposure conditions [9, 10]. Birth cohort studies provide an excellent opportunity to follow natural infections under real-life conditions including duration of virus shedding [9]. In this study, we genotyped norovirus-positive samples from a longitudinal birth cohort in a highly endemic region in Peru [11] to quantify homotypic and heterotypic protection to norovirus genotypes naturally acquired during the first 2 years of life.
MATERIALS AND METHODS
In 2009, the study of Etiology, Risk Factors, and Interactions of Enteric Infections and Malnutrition and the Consequences for Child Health (MAL-ED) was established in 8 countries that have a high incidence of diarrheal disease and malnutrition [12]. In Peru, the study site was located in 3 rural communities: Santa Clara de Nanay, Santo Tomas, and La Union [13]. From January 2010 to February 2014, 299 healthy newborns from communities in the Loreto province in Peru [13] were enrolled within the first 17 days of life and followed up to 24 months of age as a site of the MAL-ED study [12]. Enrollment was done using a well-defined recruitment protocol with stringent inclusion and exclusion criteria [11]. Mothers or caregivers of participating children provided written consent during enrollment and verbal consent at each follow-up visit. Stools were collected within 48 hours of a diarrheal episode, defined by a maternal report of 3 or more loose stools in 24 hours, or 1 loose stool with visible blood. Routine nondiarrheal stools were collected monthly from age 1 to 12 months and quarterly at 15, 18, 21, and 24 months.
A total of 6020 stool samples from 299 participants were collected of which 2192 samples were from diarrheal episodes and 3828 samples were routine nondiarrheal stools. All diarrheal samples and a 10% subset of routine nondiarrheal stool samples had previously been tested by TaqMan Array Card [14] as a component of the MAL-ED study. We tested the remaining nondiarrheal samples for norovirus by real-time reverse-transcription polymerase chain reaction (RT-PCR) (primers/probes: Cog1F, Cog1R, and ring1E probe for GI viruses; Cog2F, Cog2R, and ring 2 probe for GII viruses) and genotyped norovirus-positive samples (diarrheal and nondiarrheal cases) by a dual typing assay (MON432 and G1SKR for GI viruses; MON431 and G2SKR for GII viruses) followed by Sanger sequencing of the PCR products as described previously [15].
Viral nucleic acid was extracted on an automated KingFisher extractor (Thermo Fisher Scientific, Pittsburgh, Pennsylvania) from 10% clarified fecal suspensions prepared in phosphate-buffered saline using a MagMax-96 Viral RNA Isolation kit (Ambion, Foster City, California), according to the manufacturers’ instructions. Norovirus real-time RT-PCR was performed using the AgPath-ID 1-step RT-PCR kit (Applied Biosystems, Carlsbad, California) as published previously [15]. PCR products were visualized on a 2% agarose gel (Seakem-ME, Lonza, Allendale, New Jersey) containing Gel Red (Biotium, Fremont, California) and gel purified by an ExoSAP-IT (Affymetrix, Cleveland, Ohio) or QIAquick PCR purification kit (Qiagen) followed by Sanger sequencing (Eurofins MWG Operon, Louisville, Kentucky). Sequences were genotyped using online norovirus typing tools (https://www.rivm.nl/mpf/typingtool/norovirus/ (or https://norovirus.ng.philab.cdc.gov/) [16]. Genotypes were confirmed by phylogenetic analysis using norovirus reference sequence databases at the Centers for Disease Control and Prevention using MEGA X [17]. Maximum likelihood trees were computed with 1000 bootstrap replicates.
To generate estimates of overall prevalence and perform longitudinal analyses, we included all data from the MAL-ED Peru site in the analysis, resulting in an overall sample size of 6020 stools in statistical analyses from 299 distinct children. Survival analysis was conducted on data from 194 children (n = 4824 stools) who completed 2 years of surveillance. Kaplan-Meier survival analysis was conducted to estimate the time to the first GI/GII detection in samples from symptomatic and asymptomatic children. A Cox proportional hazards model was used to model the hazard of subsequent norovirus infections among children with vs without prior exposure for each genotype on the same genotype (homotypic protection) and all other genotypes (heterotypic protection) with >5% prevalence. Children entered the risk set at birth and were classified as unexposed until first recorded infection of interest, after which the time-varying exposure variable switched to “1” and they began contributing person-time to the “exposure” group. The model employed the Breslow method for ties and a robust variance estimate to account for within-child clustering at the level of the individual child, who contributed multiple observations to the risk set [18, 19]. The analysis was done allowing multiple failures per subject, and children were censored at the end of follow-up. We defined infections occurring within 30 days as markers of persistent infection and excluded them from analysis a priori based on current evidence and validated with sensitivity testing [20]. Final models were adjusted for duration of exclusive breastfeeding (days until first non–breast milk meal), and length-for-age z scores to represent nutritional status. An identical model was run for symptomatic GII.4 and GII.6 infections (the only genotypes with > 50 episodes of clinical episodes) to compare the protection generated from all infections vs that seen following symptomatic illness. We used the Holm method to correct for multiple comparisons. Recognizing that this is conservative, an exact binomial 1-sample test was also performed to determine if the number of the null hypothesis was likely to occur by chance alone and to compare this to the number of observed rejections for improved interpretation [21].
RESULTS
Overall, the prevalence of norovirus in diarrheal (n = 2192) and nondiarrheal (n = 3828) stool samples from 299 participants of the Peruvian birth cohort was 22% (n = 471) and 21% (n = 817), respectively. Two hundred fifty-six (86%) children had at least 1 norovirus infection throughout their 2 years of life and 109 (36%) children experienced >5 infections (Figure 1). Among norovirus-positive samples (n = 1288), 21.4% were positive for GI (n = 276), 73.7% (n = 949) were positive for GII, and 4.9% (n = 63) tested positive for both GI and GII (Table 1). In norovirus-positive diarrheal specimens, coinfections with Campylobacter and Giardia were the most commonly detected pathogens (Table 2). Among 194 children included in longitudinal analyses (n = 3001 nondiarrheal and 1823 diarrheal stool samples), the majority experienced a symptomatic norovirus infection prior to detection of the virus in routine nondiarrheal stools. The incidence of GI infections was low in children <5 months of age, rapidly increasing to 80% at 1 years of age. In contrast, symptomatic GII infections were detected in children as young as 2 months of age with nearly all children experiencing at least 1 symptomatic norovirus disease episode by their first birthday. At 2 years of age, asymptomatic infections were detected in 50% of children infected with GI viruses and 90% of the children with GII viruses (Figure 2).
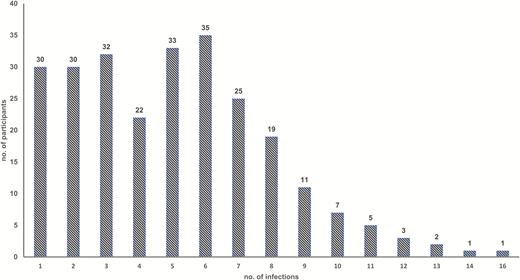
Number of norovirus infections per child in a Peruvian birth cohort during their first 2 years of life.
Prevalence and Distribution of Norovirus Infections in a Peruvian Birth Cohort, 2010–2014
| Characteristic of Samples | Full Sample | Subsample for Longitudinal Analyses |
|---|---|---|
| Total No. of participants | 299 | 194 |
| Total No. of samples | 6020 | 4824 |
| No. of diarrheal samples | 2192 | 1823 |
| No. of nondiarrheal samples | 3828 | 3001 |
| Total No. of norovirus-positive samples | 1288 | 1150 |
| Total No. of norovirus-positive diarrheal samples | 471 | 457 |
| Total No. of nondiarrheal norovirus-positive samples | 817 | 693 |
| GI-positive samples, no./No. (%) | 276/1288 (21.4) | 250/1150 (21.7) |
| GII-positive samples, no./No. (%) | 949/1288 (73.7) | 839/1150 (73.0) |
| GI and GII–positive samples, no./No. (%) | 63/1288 (4.9) | 61/1150 (5.3) |
Frequency of Coinfection With Other Enteric Pathogens in Norovirus-Positive Samples From Symptomatic Children in the Peruvian Birth Cohort
| Pathogen | No. (%) of Norovirus-Positive Diarrheal Samples Coinfected With Other Pathogens Detected | |
|---|---|---|
| GI-Positive Samples (n = 116) | GII-Positive Samples (n = 390) | |
| Giardia | 38 (32.8) | 101 (26.0) |
| Astrovirus | 11 (9.5) | 19 (4.9) |
| Adenovirus | 6 (5.2) | 13 (3.3) |
| Campylobacter | 35 (30.2) | 139 (35.7) |
| Shigella | 4 (3.5) | 7 (1.8) |
| EAEC | 29 (26.9) | 68 (18.3) |
| EPEC | 4 (3.7) | 14 (3.8) |
Abbreviations: EAEC, enteroaggregative Escherichia coli; EPEC, enteropathogenic Escherichia coli.
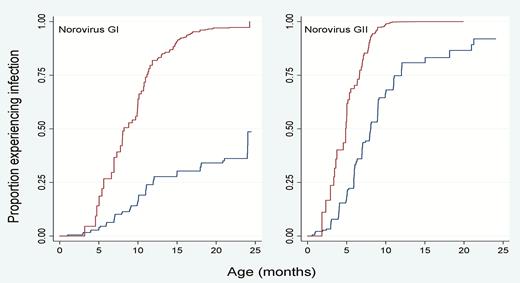
Kaplan-Meier survival analysis to estimate time to first GI and GII norovirus detection in symptomatic and asymptomatic children.
A total of 1127 (87.5%) samples were genotyped successfully and the remaining 161 samples had cycle threshold values of > 30. All 9 established GI genotypes and 16 different GII genotypes were identified in this cohort, with GII.4 (26%) and GII.6 (16.1%) viruses as the most frequently circulating genotypes (Figure 3). The majority of the genotypes (84%) were associated with 1 P-type (eg, GII.6[P7], whereas GI.3, GII.4 New Orleans, and GII.17 viruses were detected with several different P-types (eg, GII.17[P31], GII.17[P13], and GII.17[P17]). Three recently reported novel genotypes (GII.23, GII.24, and GII.27) and 1 tentative novel genotype (GII.NA1) were also identified [4, 22].
![GI and GII norovirus genotypes in children from a Peruvian birth cohort from 2010 to 2014. Other genotypes include genotypes each with a prevalence < 5% (GI.1, GI.2, GI.4, GI.6, GI.8, GI.9, GII.1, GII.3, GII.8, GII.14, GII.22, GII.24, GII.26, GII.27, and GII.NA1 [a not-yet-assigned GII genotype]) [4].](https://oup.silverchair-cdn.com/oup/backfile/Content_public/Journal/cid/72/2/10.1093_cid_ciaa019/3/m_ciaa019_fig3.jpeg?Expires=1749980795&Signature=f0rKZ9AjtuEaSFvoE5D5IpOWIqucExtyJUm9ZW5S2c6NwuSB-n~R6tJMBf~7uiHPELs5Q-eb8gEDbp8ej1WcFtvKwuzLmxOdFBpyFab8rlp0vMOkVKIW0jpMSwO1y9PasaC4kQTtPlXG8JkjeV3q~oaq7f8iB0AMVLq2PSiAp3wX2g2uVlRGEkKSTw2mHgmhzjy4jcuq4V5w9biMYVcUhQrZnJpphb9TN4-tp6-iNCWAgIHR-nLmqrLYJc1Hqrgwc53lt2Zixblh6TeidWRGEH241exHUdUuH4ehxv2K3neXJ40ZyDh-WItIbLIBjbBnKSi~8VZpFQB7E6ZrxMF3jg__&Key-Pair-Id=APKAIE5G5CRDK6RD3PGA)
GI and GII norovirus genotypes in children from a Peruvian birth cohort from 2010 to 2014. Other genotypes include genotypes each with a prevalence < 5% (GI.1, GI.2, GI.4, GI.6, GI.8, GI.9, GII.1, GII.3, GII.8, GII.14, GII.22, GII.24, GII.26, GII.27, and GII.NA1 [a not-yet-assigned GII genotype]) [4].
A total of 989 norovirus-positive samples from genotypes that were detected at > 5% frequency (GI.3, GI.5, GI.7, GII.2, GII.4, GII.6, GII.7, GII.17, GII.23) were included in longitudinal analyses of homotypic and heterotypic protection. To distinguish reinfection from persistent infection, 151 samples that had been collected within 30 days from a prior infection with the same genotype were excluded from the analysis. Overall, 27 infections with the same genotype that are separated by 30 days or more occurred including 11 GII.4; 8 GII.6; 2 of each GI.5, GII.2, and GII.23; and 1 of each GI.3 and GI.7 infections. Prior infections with GII.4 and GII.6 were associated with homotypic reductions in risk, or reduced hazard of future infection with the same genotype by 61% and 48%, respectively (Table 3; HR, 0.39, P < .001 for GII.4; HR, 0.52, P = .006 for GII.6). Prior infections with GI.3 and GI.7 trended toward demonstrating homotypic immunity with decreased hazards of infection of 65% and 81% but failed to retain significance after correction for multiple comparisons (HR, 0.35, P = .015 for GI.3; HR, 0.19, P = .022 for GI.7). Significant evidence of heterotypic protection was observed among children with prior GII.4 infections, who exhibited a 48% reduction in the hazard of subsequent GI.3 infection (HR, 0.52; P = .005) and a trend of a 59% reduction in the hazard of subsequent GII.2 infections (HR, 0.41; P = .016) that failed to reach significance after correction for multiple comparisons.
Adjusted Hazard Ratios Denoting Homotypic and Heterotypic Protection or Cross-reactivity Between Norovirus Genotypes Among 194 Children in Peru
| Prior Infection | Adjusted Hazard Ratio (95% CI) | |||||||
|---|---|---|---|---|---|---|---|---|
| GI.3 (n = 73) | GI.5 (n = 51) | GI.7 (n = 58) | GII.2 (n = 45) | GII.4 (n = 195) | GII.6 (n = 150) | GII.17 (n = 53) | GII.23 (n = 49) | |
| GI.3 | 0.35 a (.15–.82) | 0.64 (.28–1.48) | 0.60 (.27–1.34) | 0.89 (.37–2.37) | 1.57a (1.08–2.28) | 1.75b,c (1.18–2.59) | 0.73 (.32–1.67) | 0.18 (.03–1.23) |
| GI.5 | 1.47 (.80–2.71) | 0.89 (.31–2.51) | 0.89 (.44–1.82) | 0.67 (.22–2.07) | 1.17 (.76–1.80) | 0.81 (.42–1.57) | 1.29 (.66–2.53) | 1.30 (.42–4.07) |
| GI.7 | 1.17 (.72–1.90) | 0.90 (.44–1.81) | 0.19 a (.04–.79) | 0.85 (.33–2.33) | 1.10 (.76–1.60) | 1.06 (.71–1.57) | 0.94 (.44–2.00) | 1.09 (.48–2.48) |
| GII.2 | 1.36 (.79–2.33) | 0.27 (.07–1.07) | 0.53 (.21–1.29) | 0.74 (.30–1.86) | 1.16 (.78–1.72) | 1.33 (.88–2.01) | 3.42b,c (2.00–5.82) | 1.05 (.44–2.51) |
| GII.4 | 0.52b,c (.33–.82) | 1.03 (.52–2.03) | 0.74 (.44–1.24) | 0.41a (.20–.84) | 0.39 b,c (.27–.54) | 0.91 (.66–1.27) | 0.79 (.43–1.45) | 1.13 (.67–1.92) |
| GII.6 | 1.09 (.71–1.70) | 1.18 (.64–2.18) | 0.73 (.43–1.26) | 1.61 (.84–3.09) | 0.96 (.70–1.33) | 0.52 b,c (.32–.82) | 1.73a (1.03–2.91) | 2.19a (1.19–4.03) |
| GII.17 | 2.06b,c (1.29–3.30) | 0.61 (.17–1.23) | 0.77 (.39–1.52) | 0.94 (.39–1.26) | 0.71 (.43–1.17) | 1.06 (.69–1.61) | 0.38 (.12–1.20) | 0.91 (.32–2.58) |
| GII.23 | 0.76 (.41–1.41) | 1.22 (.61–2.44) | 0.72 (.32–1.62) | 0.43 (.14–1.29) | 0.83 (.54–1.27) | 1.03 (.72–1.47) | 0.90 (.42–1.95) | 1.14 (.49–2.65) |
Hazard ratios of being infected with the same genotype (highlighted with bold text) or a different genotype among children with vs without prior infection with genotypes are listed in the left-hand column. Values between 0 and 1 denote reduced risk of subsequent infection among the previously exposed; values > 1 denote increased risk of subsequent infection among the previously exposed. Hazard ratios included adjustment for length-for-age z score and the duration of exclusive breastfeeding.
Abbreviation: CI, confidence interval.
a P < .05 (significantly different from the null hypothesis that there is no relationship between prior and future infection).
b P < .01 (strong significant finding).
cHolds after Holm correction (P < .007).
Notably, children with prior GI.3 exposure had a 75% increased hazard of GII.6 infection (HR, 1.75; P = .005) and a tendency of a 57% increased hazard of subsequent GII.4 infections (HR, 1.57; P = .018) that failed to retain significance after correction for multiple comparisons. Similarly, prior GII.2 exposure was associated with a >3-fold higher subsequent incidence of GII.17 infection (HR, 3.42; P < .001), and prior GII.17 exposure was with increased subsequent GI.3 infections (HR, 2.06; P = .003). Prior GII.6 exposure trended toward an association with an augmentation in subsequent risk of infection of 73% to GII.17 (HR, 1.73; P = .037) and a >2-fold increase in risk of infection with GII.23 (HR, 2.19; P = .011); however, these associations failed to meet criteria for statistical significance. Sensitivity analysis was also done with time to new infection windows of 14 and 90 days, which did not significantly alter results (Supplementary Table 1). To determine the likelihood of impact of multiple comparisons on our findings, an estimated 3.2 rejections of the null hypothesis could be anticipated by chance in this set of comparisons, whereas 12 were observed; thus, the probability of a global null hypothesis in regard to history of norovirus infections not altering the subsequent risk of infection is P < .0001. To further confirm our observations, we also ran the model on Campylobacter data from the parent study [12] and found that there was no evidence of altered incidence of norovirus genotypes following infection (Supplementary Table 2), supporting that the observed associations we saw in norovirus may have biologic underpinnings.
We replicated the analyses on the impact of prior norovirus infections on the occurrence of subsequent symptomatic illness with 2 genotypes, GII.4 and GII.6, which had sufficient frequency for modeling of clinical episodes (Table 4), and demonstrated that the degree of protection against symptomatic infection was nearly identical to all (symptomatic and asymptomatic) GII.4 and GII.6 infections.
Adjusted Hazard Ratios for the Risk of Symptomatic Norovirus Diarrhea Caused by GII.4 and GII.6, After Prior Infection With 1 of 8 Genotypes, Among 194 Children With Complete Surveillance Data From Birth Until 24 Months of Age
| Genotype of Prior Infection | Adjusted HR (95% CI) for Symptomatic Infection | |
|---|---|---|
| GII.4 (n = 92) | GII.6 (n = 51) | |
| GI.3 | 1.43 (.85–2.40) | 1.12 (.50–2.51) |
| GI.5 | 0.76 (.30–1.89) | 0.78 (.27–2.25) |
| GI.7 | 1.19 (.68–2.10) | 1.45 (.80–2.61) |
| GII.2 | 1.32 (.75–2.30) | 1.07 (.48–2.40) |
| GII.4 | 0.29a (.18–.48) | 1.06 (.59–1.90) |
| GII.6 | 1.05 (.65–1.66) | 0.70 (.38–1.27) |
| GII.17 | 0.76 (.40–1.41) | 1.21 (.66–2.21) |
| GII.23 | 0.72 (.35–1.48) | 0.99 (.52–1.88) |
HRs include adjustment for length-for-age z score and the duration of exclusive breastfeeding.
Abbreviations: CI, confidence interval; HR, hazard ratio.
aHolds after Holm correction (P < .007).
DISCUSSION
This study is the first to provide estimates of homotypic and heterotypic protection following naturally acquired norovirus infection in a Peruvian birth cohort. This cohort had a high incidence of norovirus disease and provided an excellent opportunity to follow natural infections in children from birth to 2 years of age. Norovirus genotypes GI.3, GII.4, and GII.6 were associated with 54% of all infections, which is similar to the major genotypes in pediatric populations globally [23, 24]. We found >60% homotypic protection to the most frequently detected norovirus genotype GII.4 and heterotypic protection of 48% against GI.3, the third most prevalent genotype in this large study. Given the high prevalence of these infections, a GII.4 component has the potential to avert a large number of episodes of norovirus gastroenteritis.
In this cohort, 87% of the children experienced at least 1 (range, 1–17) norovirus infection and in addition to GI.3, GII.4, and GII.6 viruses, a wide range of genetically diverse norovirus genotypes co-circulated, including all known GI and almost all GII genotypes. High prevalence of norovirus in young children with relatively low prevalence in healthy controls has been described consistently in several Latin American countries [8, 11, 25–29], and all children in this cohort are secretor positive [29]. However, asymptomatic infections and prolonged virus shedding were common in this study population, which is consistent with reports from other birth cohort studies [20, 26, 30, 31]. Interestingly, we detected GII.4 Sydney viruses in samples that were collected in 2010, 2 years before this pandemic strain was first reported [32] This has been reported by others [33, 34] and in 1 of these reports, GII.4 Sydney strains were detected in stool samples from sporadic norovirus cases as early as 1994 [33], highlighting the importance of including typing of norovirus trains from sporadic cases of gastroenteritis in surveillance programs for early detection of emerging strains with pandemic potential.
We employed Kaplan-Meier and Cox proportional hazards regression models to provide robust estimates of homotypic and heterotypic protection following natural infections. Although typical duration of norovirus shedding is days to weeks [20], in young infants with an immature immune system, virus can sometimes be shed for months or longer [30]. We defined our cutoff for persistent infections to 30 days as suggested in a recent review of the literature on the effect of long-term shedding on norovirus risk [20]. Sensitivity analysis with the cutoff for persistent infections set at 14 and 90 days did not significantly alter the results.
Several previous studies have shown that children can be reinfected with norovirus multiple times during the first 5 years of life and that the majority of these reinfections occur with different norovirus genotypes or different GII.4 variants [5, 8, 9, 27, 35, 36]. However, due to study design, sample size, and/or methodology limitations, none of these studies performed survival analysis to estimate the level of protection against individual genotypes, which is key information required to assess the feasibility and composition of a norovirus vaccine in pediatric populations. The successful typing of a large number of the norovirus infections in this study allowed for estimates of homotypic and heterotypic protection and probabilities of reinfection following initial norovirus infection. While GII.4 showed both homotypic and heterotypic protection, GII.6 also exhibited homotypic protection of a 48% reduction in risk following a documented infection.
A notable finding of our study was the increased vulnerability seen to certain norovirus infections following infections with a different genotype, especially those involving GI.3, GII.6, and GII.17 strains. GII.17 infections enhanced the susceptibility to GI.3 infections by 2-fold. An augmentation of risk of infections with GII.17 strains following GII.2 and GII.6 infections was also observed. To our knowledge, this is the first time this phenomenon has been described for an enteropathogen other than bocavirus [36]. This is the first report of 1 norovirus infection positively influencing the subsequent risk of acquisition of other noroviruses, which merits further investigation. Biological plausibility of this observation is found in several recent studies of the repertoire of serological responses in the murine model [37]. Lindesmith et al recently profiled the antibody repertoire following immunization in humans and found that the immunoglobulin G response to norovirus vaccine is dominated by the boosting of a limited number of clonotypes. It is also notable that murine and bovine noroviruses have exhibited dual tropism, infecting not only epithelial cells, but dendritic cells and cells with monocyte morphologies, raising the possibility of antibody dependent enhancement-like mechanisms [37]. We further evaluated whether Campylobacter infection altered the subsequent risk of norovirus infection, but no effect was noted, suggesting that confounding was not a likely explanation underlying these findings. Clearly, these findings warrant further investigation as multicomponent norovirus vaccines are under development and enhancement has been reported even across genogroups [38].
Our study has several limitations. First, although we were able to detect coinfections of GI and GII noroviruses in 4.1% of the participants, the number of coinfections is likely higher because conventional RT-PCR assays used for genotyping are unable to detect coinfections with viruses of the same genogroup. Use of next-generation sequencing technology would assist in providing a more accurate picture of the number of mixed infections, highlighting the increased risk for recombination between different norovirus strain to occur in this population. Second, the age distribution of infections might be affected by the fact that routine sampling was performed monthly in year 1 but quarterly in year 2. Hence, some infections in the second year might be missed, leading to underestimated overall cumulative incidence that could skew the distribution to year 1 of the participants. The 30-day cutoff was previously suggested for studies done in controlled experiments using only healthy individuals [20] and thus might not represent the accurate cutoff for considering persistent infections in natural infections in malnourished children. The increase hazard of reinfection with different genotypes does not necessarily represent an increase in the severity of disease, as both symptomatic and asymptomatic infections were included.
In conclusion, children in this Peruvian birth cohort showed homotypic and heterotypic protection to GII.4 noroviruses, which supports the feasibility of current norovirus vaccine formulations that include GII.4. However, enhanced susceptibility observed following infection with several other genotypes merits further studies prior to inclusion of additional genotypes in a multivalent vaccine in communities with high norovirus diversity.
Supplementary Data
Supplementary materials are available at Clinical Infectious Diseases online. Consisting of data provided by the authors to benefit the reader, the posted materials are not copyedited and are the sole responsibility of the authors, so questions or comments should be addressed to the corresponding author.
Notes
Author contributions. J. V., P. C., and M. K. designed the study, interpreted the data, and wrote the manuscript. H. B. and P. C. tested and genotyped all stool samples. S. R. performed the hazard analyses. L. H. M. helped confirm the statistical analyses. P. P. Y., M. S. S., and M. P. O. critically reviewed the manuscript and read and approved the final version.
Acknowledgments. The authors thank the Etiology, Risk Factors and Interactions of Enteric Infections and Malnutrition and the Consequences for Child Health and Development (MAL-ED) study participants and their children for their collaboration, and Peter Teunis for critical review of the manuscript.
Disclaimer. The findings and conclusions in this article are those of the authors and do not necessarily represent the official position of the Centers for Disease Control and Prevention (CDC).
Financial support. The MAL-ED project was carried out as a collaborative project supported by the Bill & Melinda Gates Foundation, the Foundation for the National Institutes of Health (NIH), and the NIH Fogarty International Center. Additional funding was provided by the Bill & Melinda Gates Foundation (grant number OPP1066146 to M. N. K.); the Fisher Center for Environmental Infectious Diseases at the Johns Hopkins School of Medicine; and the intramural food safety program at the CDC (to P. C. and J. V.).
Potential conflicts of interest. The authors: No reported conflicts of interest. All authors have submitted the ICMJE Form for Disclosure of Potential Conflicts of Interest.
References
Author notes
P. C. and S. R. contributed equally to this work.

