


Abstract
Assessing the impact of coronavirus disease 2019 (COVID-19) on intensive care unit (ICU) providers’ perceptions of resource availability and evaluating the factors associated with emotional distress/burnout can inform interventions to promote provider well-being.
Between 23 April and 7 May 2020, we electronically administered a survey to physicians, nurses, respiratory therapists (RTs), and advanced practice providers (APPs) caring for COVID-19 patients in the United States. We conducted a multivariate regression to assess associations between concerns, a reported lack of resources, and 3 outcomes: a primary outcome of emotional distress/burnout and 2 secondary outcomes of (1) fear that the hospital is unable to keep providers safe; and (2) concern about transmitting COVID-19 to their families/communities.
We included 1651 respondents from all 50 states: 47% were nurses, 25% physicians, 17% RTs, and 11% APPs. Shortages of intensivists and ICU nurses were reported by 12% and 28% of providers, respectively. The largest supply restrictions reported were for powered air purifying respirators (56% reporting restricted availability). Provider concerns included worries about transmitting COVID-19 to their families/communities (66%), emotional distress/burnout (58%), and insufficient personal protective equipment (PPE; 40%). After adjustment, emotional distress/burnout was significantly associated with insufficient PPE access (adjusted relative risk [aRR], 1.43; 95% confidence interval [CI], 1.32–1.55), stigma from community (aRR, 1.32; 95% CI, 1.24–1.41), and poor communication with supervisors (aRR, 1.13; 95% CI, 1.06–1.21). Insufficient PPE access was the strongest predictor of feeling that the hospital is unable to keep providers safe and worries about transmitting infection to their families/communities.
Addressing insufficient PPE access, poor communication from supervisors, and community stigma may improve provider mental well-being during the COVID-19 pandemic.
(.)
The United States has been disproportionately impacted by the coronavirus disease 2019 (COVID-19) pandemic; despite having less than 4% of the world’s population, the United States accounts for 28% of COVID-19 infections and 25% of COVID-19–related deaths worldwide [1]. The pandemic has overwhelmed health-care systems, which are struggling to care for massive surges in numbers of critically ill patients. Maintaining a healthy workforce of health-care professionals (HCPs), including physicians, nurses, respiratory therapists (RTs), and advanced practice providers (APPs), is crucial to providing quality care for the growing volume of patients [2]. As US states start to relax social distancing guidelines, many regions are experiencing a resurgence of COVID-19 cases, placing renewed strain on HCPs and the health-care system [3].
Recent studies have found high prevalences of stress and burnout among HCPs on the front lines of the COVID-19 response, as they face a rapidly shifting work environment with increasing demands and heightened uncertainty [4–6]. Assessing HCPs’ perceptions of resource availability, emotional stressors, and job-related concerns during the pandemic can inform targeted interventions to support provider mental health and enable them to deliver high-quality care to patients [2]. We aimed to characterize intensive care unit (ICU) providers’ perceptions of personal protective equipment (PPE), COVID-19 testing, and resource availability during COVID-19, and to evaluate whether these factors are associated with HCPs’ emotional distress/burnout and concerns about safety and transmission of the virus to their families/communities.
METHODS
Study Design
This study followed the Strengthening the Reporting of Observational Studies in Epidemiology (STROBE) guidelines for the reporting of cross-sectional studies [7]. A research team of physicians, nurses, RTs, and APPs designed a 41-question online survey to elicit perspectives across domains, including resource availability, personnel shortages, and concerns during COVID-19. Prior to administration, the survey was pilot tested with 30 HCPs and refined based on participant feedback. The overall aim of the survey was to assess the impact of COVID-19 on HCPs globally; however, the present analysis is restricted to the United States, with the goal of assessing HCPs’ perceptions and concerns nationwide and by geographic region.
Ethical Approval
The study was approved by the University of Washington Institutional Review Board. Before survey initiation, respondents were informed that their responses were anonymous, and summary results would be shared with the scientific community. Responses were stored without participant identifiers using the Research Electronic Data Capture electronic data capture software [8].
Study Population and Recruitment
Our target population was physicians, physicians-in-training (residents and fellows), nurses, RTs, and APPs (nurse practitioners, physician assistants, and certified registered nurse anesthetists) self-reporting that they cared for COVID-19 patients in an ICU. The survey was administered between 23 April and 7 May 2020, to coincide with the initial pandemic peak in many US states. We distributed the survey via scientific member societies, email to personal contacts, and social media groups restricted to HCPs caring for COVID-19 patients on platforms including Facebook and Twitter.
Variable Categorization
The US states were grouped into 5 commonly used geographic regions: Northeast, Southwest, West, Southeast, and Midwest [9]. A list of states in each region is provided in the Supplementary Appendix. Using a 3-day rolling average of number of deaths per day, we categorized states by COVID-19 pandemic stage: (1) prepeak, (2) during peak, and (3) postpeak [10, 11]. We classified states into COVID-19 pandemic severity category at the midpoint of data collection using a 3-day rolling average of the number of new cases/100 000 persons, as: (1) <250 cases/day; (2) 250–750 cases/day; and (3) >750 cases/day (Supplementary Tables 1–3) [12].
Statistical Analysis
Descriptive statistics were used to report participant characteristics and survey responses. Our main outcome was HCP emotional distress/burnout in caring for COVID-19 patients, captured as a dichotomous variable. We assessed 2 secondary outcomes: (1) HCPs’ concerns that their hospital was unable to keep them safe; and (2) HCPs’ concern about transmitting COVID-19 to their families/communities (see Supplementary Appendix for the full survey). We conducted univariate and multivariate log-binomial regression with robust standard errors to assess those factors associated with the outcomes of interest. Exposures that were statistically significant in univariate regression were considered for inclusion in multivariate models. Those that did not improve the model fit using the likelihood ratio test were excluded. Analyses were conducted using R Software [13–15].
RESULTS
Participant Characteristics
Overall, 3182 participants completed part of the survey and 2706 met the inclusion criteria for the global survey. Of these, 61% (n = 1651) reported practicing in the United States and were included in the analysis (Figure 1; Supplementary Figure 1). The states with the highest number of respondents were Washington (n = 268), California (n = 176), Michigan (n = 146), Massachusetts (n = 120), and New York (n = 105), which were some of the hardest hit states in the beginning of the pandemic (Supplementary Tables S1 and S3). Of the participants, 47% were nurses, 25% were physicians or physicians-in-training, 17% were RTs, and 11% were APPs (Table 1). Most HCPs practiced in large, urban teaching hospitals (69%), and 74% were female. Half of HCPs reported having cared for 10–50 COVID-19 patients; 12% reported having cared for >50 COVID-19 patients (highest in the Northeast, at 24%). Overall, 26 states were surveyed during their COVID-19 pandemic peak, 13 postpeak, and 11 prepeak (Supplementary Table S1).
Health-care Professional Characteristics by Geographic Region
| Midwest | Northeast | Southeast | Southwest | West | Total | |
|---|---|---|---|---|---|---|
| n = 358 | n = 408 | n = 212 | n = 108 | n = 565 | N = 1651 | |
| Gender | ||||||
| Female | 284 (79%) | 298 (73%) | 152 (72%) | 79 (73%) | 413 (73%) | 1226 (74%) |
| Male | 72 (20%) | 108 (26%) | 58 (27%) | 27 (25%) | 147 (26%) | 412 (25%) |
| Nonbinary | 0 (0%) | 0 (0%) | 0 (0%) | 0 (0%) | 1 (0%) | 1 (0%) |
| Not disclosed | 2 (1%) | 2 (0%) | 2 (1%) | 2 (2%) | 4 (1%) | 12 (1%) |
| Years in clinical practice | ||||||
| Mean (SD) | 11.4 (9.40) | 12.4 (10.8) | 10.7 (9.38) | 8.78 (7.10) | 11.6 (8.44) | 11.4 (9.36) |
| Hospital setting | ||||||
| Rural, <100 beds | 8 (2%) | 7 (2%) | 4 (2%) | 4 (4%) | 10 (2%) | 33 (2%) |
| Rural, ≥100 beds | 20 (6%) | 19 (5%) | 13 (6%) | 9 (8%) | 25 (4%) | 86 (5%) |
| Urban, no teaching, <200 beds | 14 (4%) | 10 (2%) | 12 (6%) | 9 (8%) | 37 (7%) | 82 (5%) |
| Urban, no teaching, ≥200 beds | 36 (10%) | 18 (4%) | 32 (15%) | 26 (24%) | 129 (23%) | 241 (15%) |
| Urban, teaching, <200 beds | 20 (6%) | 15 (4%) | 10 (5%) | 6 (6%) | 24 (4%) | 75 (5%) |
| Urban, teaching, ≥200 beds | 260 (73%) | 338 (83%) | 141 (67%) | 54 (50%) | 340 (60%) | 1133 (69%) |
| Number of COVID-19 patients cared for | ||||||
| <10 | 121 (34%) | 97 (24%) | 106 (50%) | 43 (40%) | 280 (50%) | 647 (39%) |
| 10–50 | 183 (51%) | 214 (52%) | 89 (42%) | 60 (56%) | 259 (46%) | 805 (49%) |
| >50 | 54 (15%) | 97 (24%) | 17 (8%) | 5 (5%) | 26 (5%) | 199 (12%) |
| Professional title | ||||||
| ICU director | 7 (2%) | 21 (5%) | 13 (6%) | 3 (3%) | 15 (3%) | 59 (4%) |
| Attending physician | 41 (11%) | 84 (21%) | 35 (17%) | 11 (10%) | 81 (14%) | 252 (15%) |
| Physician in training | 11 (3%) | 46 (11%) | 15 (7%) | 1 (1%) | 32 (6%) | 105 (6%) |
| Nurse manager | 3 (1%) | 1 (0%) | 1 (0%) | 3 (3%) | 7 (1%) | 15 (1%) |
| Nurse | 158 (44%) | 145 (35%) | 98 (46%) | 55 (51%) | 307 (55%) | 763 (46%) |
| Advanced practice provider | 37 (10%) | 70 (17%) | 28 (13%) | 8 (7%) | 39 (7%) | 182 (11%) |
| Respiratory therapist | 101 (28%) | 41 (10%) | 22 (10%) | 27 (25%) | 84 (15%) | 275 (17%) |
| Specialization area, physicians only, n = 311 | ||||||
| Critical care medicine | 38 (79%) | 93 (89%) | 42 (88%) | 13 (93%) | 90 (94%) | 276 (89%) |
| Pulmonology | 23 (48%) | 70 (67%) | 29 (60%) | 4 (29%) | 66 (69%) | 192 (62%) |
| Internal medicine | 9 (19%) | 13 (12%) | 9 (19%) | 1 (7%) | 15 (16%) | 47 (15%) |
| Neurology | 8 (17%) | 16 (15%) | 8 (17%) | 1 (7%) | 2 (2%) | 35 (11%) |
| Specialization area, physicians-in-training only, n = 105 | ||||||
| Critical care medicine | 8 (73%) | 26 (57%) | 14 (93%) | 1 (100%) | 28 (88%) | 77 (73%) |
| Pulmonology | 6 (55%) | 14 (30%) | 13 (87%) | 1 (100%) | 21 (66%) | 55 (52%) |
| Internal medicine | 3 (27%) | 8 (17%) | 5 (33%) | 0 (0%) | 9 (28%) | 25 (24%) |
| Neurology | 2 (18%) | 9 (20%) | 1 (7%) | 0 (0%) | 0 (0%) | 12 (11%) |
| Specialization area, nurses only, n = 778 | ||||||
| Medical ICU | 114 (58%) | 103 (48%) | 63 (50%) | 42 (64%) | 231 (65%) | 553 (58%) |
| Cardiac ICU | 56 (28%) | 46 (21%) | 26 (20%) | 23 (35%) | 103 (29%) | 254 (26%) |
| Neuro ICU | 60 (30%) | 77 (36%) | 60 (47%) | 22 (33%) | 84 (24%) | 303 (32%) |
| Surgical ICU | 57 (29%) | 55 (25%) | 31 (24%) | 23 (35%) | 88 (25%) | 254 (26%) |
The number of respondents in each category vary slightly, as some responses are optional; multiple responses are possible per respondent regarding area of specialization, so most frequent subspecialties are listed. A full list of HCP specializations is available in the Supplementary Appendix. Years in clinical practice includes years in training. Physicians in training include residents and fellows.
Abbreviations: COVID-19, coronavirus disease 2019; HCP, health-care professional; ICU, intensive care unit; SD, standard deviation.
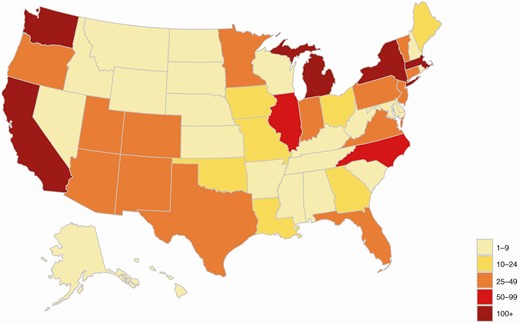
Number of respondents by US state.
Resource Availability
Across the geographic regions, 12% of HCPs reported a shortage of intensivists at their hospital, while a shortage of ICU nurses was more commonly reported (28%); 11% reported a shortage of ICU beds (Table 2). All 3 shortages were reported most often in the Northeast, largely driven by high shortages in New York, New Jersey, and Connecticut (Supplementary Figure 2–4). The availability of most PPE was high across regions; most HCPs reported gloves, surgical masks, and gowns were always available (71–97%; Table 2). Approximately half of respondents reported that face shields and eye protection were always available; 40% stated that availability was restricted for select HCPs or based on patient characteristics. One-third (33%) of HCPs reported that N95 masks were always available, while 59% stated availability was restricted. The largest restrictions reported were for powered air purifying respirators (PAPRs); just 15% of HCPs reported that they were always available, while 56% reported restricted availability. While supply shortages for most types of PPE were low (<10%), 29% of HCPs reported intermittent supply shortages of PAPRs. Overall, 27% of HCPs reported agreeing completely with their hospital’s PPE policy, and 46% agreed somewhat. Overall, 10% of HCPs reported complete disagreement with the PPE policy (highest in the Southwest, at 20%). Stratifying by occupation revealed that 50% of physicians agreed completely with the hospital PPE policy, compared with just 15% of nurses (Supplementary Table S4). Across regions, 38% of nurses disagreed somewhat or completely with the hospital PPE policy, compared to just 7% of physicians.
Health-care Professional Responses by Geographic Region
| Midwest | Northeast | Southeast | Southwest | West | Total | |
|---|---|---|---|---|---|---|
| n = 358 | n = 408 | n = 212 | n = 108 | n = 565 | N = 1651 | |
| Shortages reported | ||||||
| Intensivists | 32 (10%) | 81 (22%) | 26 (13%) | 10 (10%) | 40 (8%) | 189 (12%) |
| ICU nurses | 107 (32%) | 177 (48%) | 40 (20%) | 28 (27%) | 73 (14%) | 425 (28%) |
| ICU beds | 29 (10%) | 74 (23%) | 16 (9%) | 8 (10%) | 22 (5%) | 149 (11%) |
| PPE availability | ||||||
| Surgical mask | ||||||
| Always available | 253 (89%) | 133 (84%) | 76 (81%) | 536 (79%) | 171 (75%) | 1169 (81%) |
| Availability restricteda | 25 (9%) | 18 (11%) | 11 (12%) | 101 (15%) | 40 (18%) | 195 (13%) |
| Intermittent supply shortages | 5 (2%) | 8 (5%) | 7 (7%) | 44 (6%) | 17 (7%) | 81 (6%) |
| N95 mask | ||||||
| Always available | 100 (35%) | 63 (40%) | 40 (43%) | 195 (29%) | 82 (36%) | 480 (33%) |
| Availability restricteda | 177 (63%) | 85 (53%) | 48 (51%) | 415 (61%) | 125 (55%) | 850 (59%) |
| Intermittent supply shortages | 6 (2%) | 11 (7%) | 6 (6%) | 70 (10%) | 21 (9%) | 114 (8%) |
| Eye protection | ||||||
| Always available | 152 (54%) | 76 (48%) | 50 (53%) | 320 (47%) | 122 (54%) | 720 (50%) |
| Availability restricteda | 109 (39%) | 61 (38%) | 34 (36%) | 252 (37%) | 85 (37%) | 541 (37%) |
| Intermittent supply shortages | 22 (8%) | 22 (14%) | 10 (11%) | 109 (16%) | 21 (9%) | 184 (13%) |
| Face shield | ||||||
| Always available | 147 (52%) | 81 (51%) | 46 (49%) | 301 (44%) | 120 (53%) | 695 (48%) |
| Availability restricteda | 129 (46%) | 63 (40%) | 35 (37%) | 290 (43%) | 89 (39%) | 606 (42%) |
| Intermittent supply shortages | 7 (2%) | 15 (9%) | 13 (14%) | 89 (13%) | 19 (8%) | 143 (10%) |
| PAPRs | ||||||
| Always available | 48 (17%) | 21 (13%) | 10 (11%) | 98 (14%) | 40 (18%) | 217 (15%) |
| Availability restricteda | 169 (60%) | 83 (52%) | 54 (57%) | 391 (58%) | 117 (51%) | 814 (56%) |
| Intermittent supply shortages | 66 (23%) | 55 (35%) | 30 (32%) | 191 (28%) | 71 (31%) | 413 (29%) |
| Gowns | ||||||
| Always available | 274 (97%) | 150 (94%) | 92 (98%) | 664 (98%) | 219 (96%) | 1399 (97%) |
| Availability restricteda | 9 (3%) | 9 (6%) | 1 (1%) | 13 (2%) | 6 (3%) | 38 (3%) |
| Intermittent supply shortages | 0 (0%) | 0 (0%) | 1 (1%) | 3 (0%) | 3 (1%) | 7 (0%) |
| Gloves | ||||||
| Always available | 209 (74%) | 106 (67%) | 73 (78%) | 467 (69%) | 173 (76%) | 1028 (71%) |
| Availability restricteda | 66 (23%) | 38 (24%) | 15 (16%) | 170 (25%) | 47 (21%) | 336 (23%) |
| Intermittent supply shortages | 8 (3%) | 15 (9%) | 6 (6%) | 43 (6%) | 8 (4%) | 80 (6%) |
| Agreement with hospital’s PPE policy | ||||||
| Agree completely | 80 (25%) | 92 (26%) | 71 (37%) | 18 (19%) | 132 (27%) | 393 (27%) |
| Agree somewhat | 152 (47%) | 166 (47%) | 80 (42%) | 37 (38%) | 234 (47%) | 669 (46%) |
| Disagree somewhat | 58 (18%) | 59 (17%) | 29 (15%) | 23 (24%) | 79 (16%) | 248 (17%) |
| Disagree completely | 31 (10%) | 34 (10%) | 12 (6%) | 19 (20%) | 50 (10%) | 146 (10%) |
| COVID-19 testing availability | ||||||
| Testing available for patients | ||||||
| All patients | 87 (28%) | 157 (44%) | 66 (34%) | 19 (19%) | 206 (42%) | 535 (37%) |
| Select patients, based on symptoms/risk factors | 228 (72%) | 197 (56%) | 131 (66%) | 79 (81%) | 284 (58%) | 919 (63%) |
| No patients | 0 (0%) | 0 (0%) | 0 (0%) | 0 (0%) | 0 (0%) | 0 (0%) |
| Testing available for HCPs | ||||||
| All HCPs | 38 (13%) | 51 (15%) | 25 (14%) | 9 (9%) | 65 (14%) | 188 (13%) |
| Select HCPs, based on symptoms/risk factors | 246 (82%) | 280 (81%) | 133 (73%) | 69 (72%) | 383 (81%) | 1111 (79%) |
| No HCPs | 15 (5%) | 16 (5%) | 24 (13%) | 18 (19%) | 26 (5%) | 99 (7%) |
| HCP concerns | ||||||
| Insufficient access to PPE | 138 (39%) | 166 (41%) | 73 (34%) | 53 (49%) | 231 (41%) | 661 (40%) |
| Feel that hospital is unable to keep me safe | 92 (26%) | 109 (27%) | 42 (20%) | 41 (38%) | 140 (25%) | 424 (26%) |
| Poor communication from supervisors | 86 (24%) | 90 (22%) | 41 (19%) | 38 (35%) | 104 (18%) | 359 (22%) |
| Worries about own health | 196 (55%) | 204 (50%) | 98 (46%) | 61 (56%) | 254 (45%) | 813 (49%) |
| Worries about financial situation | 40 (11%) | 61 (15%) | 30 (14%) | 18 (17%) | 55 (10%) | 204 (12%) |
| Worries about transmitting infection to their family and community | 254 (71%) | 267 (65%) | 140 (66%) | 73 (68%) | 359 (64%) | 1093 (66%) |
| Social stigma from my community | 101 (28%) | 94 (23%) | 49 (23%) | 41 (38%) | 138 (24%) | 423 (26%) |
| Witnessing colleagues at hospital contract COVID-19 | 155 (43%) | 159 (39%) | 62 (29%) | 34 (31%) | 191 (34%) | 601 (36%) |
| Hearing about other providers contract COVID-19 from news | 171 (48%) | 186 (46%) | 82 (39%) | 42 (39%) | 258 (46%) | 739 (45%) |
| Emotional distress/burnout | 231 (65%) | 233 (57%) | 117 (55%) | 68 (63%) | 302 (53%) | 951 (58%) |
| HCP behavior outside hospital to protect family | ||||||
| Living separately from family | 36 (12%) | 46 (15%) | 14 (8%) | 12 (14%) | 38 (9%) | 146 (11%) |
| Completely isolated from family | 11 (4%) | 11 (3%) | 4 (2%) | 3 (4%) | 10 (2%) | 39 (3%) |
| Partially isolated from family | 42 (14%) | 65 (21%) | 22 (13%) | 13 (16%) | 85 (20%) | 227 (18%) |
| Not isolated but extra precautions | 168 (57%) | 158 (50%) | 108 (63%) | 46 (55%) | 243 (56%) | 723 (56%) |
| No changes compared to before pandemic | 37 (13%) | 35 (11%) | 23 (13%) | 9 (11%) | 58 (13%) | 162 (12%) |
Responses are regarding availability of personnel, supplies, COVID-19 testing, and concerns.
Abbreviations: COVID-19, coronavirus disease 2019; HCP, health-care professional; ICU, intensive care unit; PAPR, powered air purifying respirators; PPE, personal protective equipment.
aAvailability restricted for select provider or based on patient characteristics.
Overall, 37% of HCPs reported that COVID-19 testing was available for all patients (ranging from 19% in the Southwest to 44% in the Northeast), while 63% reported restricted availability based on patient characteristics. No HCPs reported a complete lack of patient testing. Compared to patient COVID-19 testing, reported restrictions were higher for HCP testing, with 13% reporting universal availability and 79% reporting testing restrictions based on HCPs’ symptoms/exposures. Overall, 7% of respondents stated testing was completely unavailable for HCPs (highest in the Southwest, at 18%). Self-reported testing availability differed substantially by provider type (Supplementary Table S5). While 54% of physicians and 69% of physicians-in-training reported patient COVID-19 testing was available to all patients, just 26% of nurses and 21% of RTs reported universal availability. Similarly, 27% and 20% of physicians and physicians-in-training reported that COVID-19 testing was available for all HCPs, while 6% of nurses and 7% of RTs reported universal availability.
HCPs’ Concerns
The most common HCP concerns were the transmission of COVID-19 infection to one’s family/community (66%), emotional distress/burnout (58%), and worries about one’s own health (49%), which were high across all regions (Table 2; Supplementary Figure 4). Overall, 40% of HCPs reported insufficient access to PPE, 26% felt that their hospital was unable to keep them safe, and 22% reported poor communication with supervisors; all 3 of these concerns were highest in the Southwest. Social stigma from the community was reported by 26% of HCPs (highest in the Southwest, at 38%). Overall, 12% of HCPs reported worries about their financial situation. Concerns were generally more common in nurses, RTs, and APPs, as compared to physicians and physicians-in-training (Figure 2; Supplementary Table S5). Emotional distress/burnout was highest among nurses (64%), APPs (56%), and RTs (55%), as compared to physicians and physicians-in-training (49% and 48%, respectively). Compared to physicians, nurses were more likely to report insufficient PPE (31% vs 47%, respectively), feeling the hospital is unable to keep them safe (14% vs 32%, respectively), poor communication with supervisors (12% vs 27%, respectively), and stigma from the community (11% vs 33%, respectively).
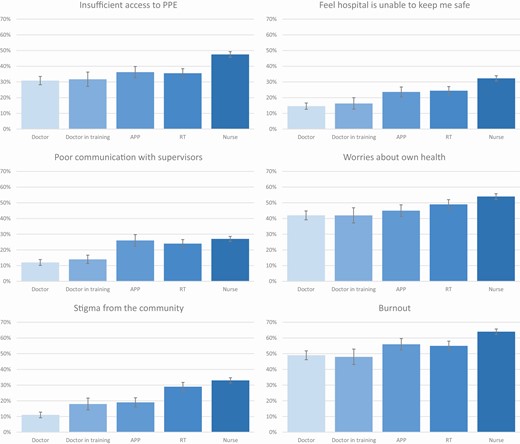
Self-reported concerns by health-care professional type. Abbreviations: APP, advanced practice providers; PPE, personal protective equipment; RT, respiratory therapist.
Factors Associated With Emotional Distress/Burnout
In a multivariate analysis, a higher likelihood of emotional distress/burnout was most strongly associated with reporting insufficient PPE access (adjusted relative risk [aRR], 1.43; 95% confidence interval [CI], 1.32–1.55) and social stigma from one’s community (aRR, 1.32; 95% CI, 1.24–1.41; Table 3). Poor communication with supervisors was also associated with a higher risk of emotional distress/burnout (aRR, 1.13; 95% CI, 1.06–1.21), as was worries about one’s financial situation (aRR, 1.09; 95% CI, 1.01–1.18). Compared to HCPs who cared for <10 COVID-19 patients, those caring for ≥10 COVID-19 patients had a higher risk of emotional distress/burnout (aRR, 1.14; 95% CI, 1.05–1.23). Perceived shortages of ICU nurses were associated with a higher risk of burnout, (aRR, 1.10; 95% CI, 1.03–1.18), while limited availability of PAPR was marginally associated with a higher risk of burnout (aRR, 1.12; 95% CI, .99–1.28). Emotional distress/burnout was not significantly associated with geographic region, COVID-19 testing availability, COVID-19 severity, or timing from the peak (Table 3; Supplementary Table S5). Although nurses and females had a higher risk of emotional distress/burnout in a univariate analysis, this association was no longer statistically significant after adjusting for other factors in a multivariate analysis. Similarly, intensivist shortages and a lack of ICU beds were not associated with emotional distress/burnout in a multivariate regression (aRR close to 1.0; data not shown).
Univariate and Multivariate Predictors of Concerns Among Health-care Professionals During Coronavirus Disease 2019
| RR (95% CI) | P value | aRR (95% CI) | P value | |
|---|---|---|---|---|
| HCP emotional distress/burnout | ||||
| Gender | ||||
| Male | Ref. | Ref. | ||
| Female | 1.25 (1.12–1.39) | <.01 | 1.09 (.98–1.21) | .10 |
| Region | ||||
| Northeast | Ref. | Ref. | ||
| Midwest | 1.13 (1.00–1.26) | .04 | 1.09 (1.00–1.20) | .06 |
| Southeast | .96 (.83–1.12) | .61 | 1.00 (.88–1.14) | .99 |
| Southwest | 1.10 (.93–1.30) | .26 | .96 (.83–1.11) | .59 |
| West | .93 (.83–1.05) | .24 | .97 (.88–1.08) | .57 |
| HCP type | ||||
| Attending physicians | Ref. | Ref. | ||
| Physicians in training | .96 (.76–1.21) | .74 | .90 (.73–1.10) | .30 |
| Nurse | 1.30 (1.15–1.48) | <.01 | 1.10 (.97–1.24) | .16 |
| APP | 1.14 (.96–1.36) | .13 | 1.04 (.89–1.21) | .62 |
| RT | 1.13 (.96–1.32) | .14 | 1.01 (.88–1.17) | .88 |
| HCP concerns | ||||
| Insufficient access to PPE | 2.10 (1.94–2.29) | <.01 | 1.43 (1.32–1.55) | <.01 |
| Poor communication from supervisors | 1.69 (1.57–1.81) | <.01 | 1.13 (1.06–1.21) | <.01 |
| Worries about financial situation | 1.54 (1.30–1.81) | <.01 | 1.09 (1.01–1.18) | .02 |
| Social stigma from community | 1.88 (1.65–2.14) | <.01 | 1.32 (1.24–1.41) | <.01 |
| Shortages reported | ||||
| Limited availability of PAPR | 1.30 (1.14–1.49) | <.01 | 1.12 (.99–1.28) | .07 |
| Lack of intensivists | 1.21 (1.10–1.34) | <.01 | … | |
| Lack of ICU nurses | 1.33 (1.16–1.52) | <.01 | 1.10 (1.03–1.18) | .01 |
| Lack of ICU beds | 1.24 (1.16–1.33) | <.01 | … | |
| Number of COVID-19 patients cared for | ||||
| <10 | Ref. | Ref. | ||
| ≥10 | 1.22 (1.11–1.33) | <.01 | 1.14 (1.05–1.23) | <.01 |
| Feel that hospital is unable to keep HCPs safe | ||||
| Gender | ||||
| Male | Ref. | Ref. | ||
| Female | 1.50 (1.20–1.87) | <.01 | 1.10 (.91–1.33) | .34 |
| Region | ||||
| Northeast | Ref. | Ref. | ||
| Midwest | .95 (.75–1.21) | .69 | 1.01 (.83–1.23) | .89 |
| Southeast | .74 (.54–1.02) | .07 | .89 (.69–1.14) | .35 |
| Southwest | 1.41 (1.05–1.88) | .02 | 1.05 (.83–1.34) | .66 |
| West | .92 (.74–1.15) | .48 | 1.09 (.90–1.32) | .4 |
| HCP type | ||||
| Attending physicians | Ref. | Ref. | ||
| Physicians in training | 1.12 (.67–1.87) | .67 | .86 (.56–1.32) | .50 |
| Nurse | 2.21 (1.66–2.95) | <.01 | 1.17 (.88–1.56) | .29 |
| APP | 1.62 (1.11–2.36) | .01 | 1.15 (.83–1.59) | .41 |
| RT | 1.67 (1.19–2.36) | <.01 | 1.18 (.87–1.60) | .3 |
| HCP concerns | ||||
| Insufficient access to PPE | 10.81 (8.20–14.24) | <.01 | 5.84 (4.36–7.82) | <.01 |
| Poor communication from supervisors | 3.83 (3.29–4.45) | <.01 | 1.76 (1.52–2.04) | <.01 |
| Worries about financial situation | 2.30 (1.84–2.88) | <.01 | 1.17 (1.01–1.36) | .04 |
| Social stigma from community | 2.55 (2.11–3.09) | <.01 | 1.23 (1.07–1.40) | <.01 |
| Shortages reported | ||||
| Limited availability of PAPR | 2.80 (1.92–4.09) | <.01 | 1.62 (1.14–2.30) | .01 |
| Lack of intensivists | 1.85 (1.55–2.22) | <.01 | … | |
| Lack of ICU nurses | 2.12 (1.75–2.57) | <.01 | 1.46 (1.27–1.67) | <.01 |
| Lack of ICU beds | 2.00 (1.70–2.36) | <.01 | … | |
| Number of COVID-19 patients cared for | ||||
| <10 | Ref. | … | ||
| ≥10 | 1.20 (1.01–1.43) | .04 | … | |
| Worries about transmitting COVID-19 to their families and communities | ||||
| Gender | ||||
| Male | Ref. | Ref. | ||
| Female | 1.05 (.96–1.14) | .28 | 1.01 (.94–1.09) | .79 |
| Region | ||||
| Northeast | Ref. | Ref. | ||
| Midwest | 1.09 (.99–1.20) | .09 | 1.08 (.99–1.16) | .08 |
| Southeast | 1.01 (.90–1.14) | .82 | 1.04 (.93–1.16) | .49 |
| Southwest | 1.04 (.90–1.21) | .60 | .95 (.84–1.08) | .45 |
| West | .98 (.89–1.07) | .63 | 1.01 (.93–1.11) | .76 |
| HCP type | ||||
| Attending physicians | Ref. | Ref. | ||
| Physicians in training | .95 (.81–1.11) | .49 | .90 (.78–1.04) | .15 |
| Nurse | .98 (.90–1.07) | .7 | .84 (.77–.91) | <.01 |
| APP | .89 (.78–1.02) | .10 | .83 (.74–.94) | <.01 |
| RT | .89 (.79–1.01) | .07 | .82 (.74–.92) | <.01 |
| HCP concerns | ||||
| Insufficient access to PPE | 1.84 (1.72–1.97) | <.01 | 1.48 (1.39–1.58) | <.01 |
| Poor communication from supervisors | 1.49 (1.41–1.58) | <.01 | 1.13 (1.07–1.19) | <.01 |
| Worries about financial situation | 1.43 (1.22–1.68) | <.01 | … | |
| Social stigma from community | 1.61 (1.42–1.82) | <.01 | 1.30 (1.23–1.38) | <.01 |
| Shortages reported | ||||
| Limited availability of PAPR | 1.10 (1.00–1.20) | .06 | … | |
| Lack of intensivists | 1.12 (1.03–1.22) | .01 | … | |
| Lack of ICU nurses | 1.17 (1.03–1.33) | .02 | 1.08 (1.01–1.15) | .02 |
| Lack of ICU beds | 1.05 (.98–1.12) | .15 | … | |
| Number of COVID-19 patients cared for | ||||
| <10 | Ref. | … | ||
| ≥10 | 1.12 (1.04–1.20) | <.01 | … |
PAPR was dichotomized as always available versus restricted availability or intermitted supply shortages.
Abbreviations: APP, advanced practice providers; aRR, adjusted relative risk; CI, confidence interval; COVID-19, coronavirus disease 2019; HCP, health-care professional; ICU, intensive care unit; PAPR, powered air purifying respirators; PPE, personal protective equipment; Ref., Reference; RR, relative risk; RT, respiratory therapist.
Factors Associated With Other Concerns
After adjustment for covariates, HCPs who reported insufficient access to PPE were 5.82 times more likely to feel that their hospital is unable to keep them safe (95% CI, 4.36–7.82; Table 3). Limited availability of PAPR (aRR, 1.62; 95% CI, 1.14–2.30), a lack of ICU nurses (aRR, 1.46; 95% CI, 1.27–1.67), poor communication with supervisors (aRR, 1.76; 95% CI, 1.52–2.04), and social stigma from the community (aRR, 1.23; 95% CI, 1.07–1.40) were also associated with HCPs feeling that their hospital is unable to keep them safe. Although females, nurses, APPs, and RTs had higher risks of reporting that their hospitals are unable to keep them safe in a univariate analysis, these associations were no longer statistically significant after adjustment in a multivariate analysis. Similarly, shortages of intensivists, a lack of ICU beds, and testing availability were not associated with the outcome in a multivariate regression (aRR close to 1.0; data not shown). Likewise, the COVID-19 testing availability, COVID-19 severity, or timing from the peak were not associated with the outcome (Supplementary Table S6).
Insufficient access to PPE was also the strongest predictor of HCPs’ worries about transmitting COVID-19 to their families/community (aRR, 1.48; 95% CI, 1.39–1.58). Poor communication from supervisors (aRR, 1.13; 95% CI, 1.07–1.19), social stigma from the community (aRR, 1.30; 95% CI, 1.23–1.38), and a lack of ICU nurses (aRR, 1.08; 95% CI, 1.01–1.15) were also associated with worries about transmitting infection to one’s family/community. Physicians were at a slightly higher risk of concern about transmission, as compared to nurses, APPs and RTs, while region and gender did not show significant associations.
Discussion
In this nationwide survey of HCPs caring for COVID-19 patients, we found substantial reported shortages of personnel and PPE, as well as high rates of emotional distress/burnout across geographic regions. Shortages of ICU nurses were more commonly reported than shortages of intensivists or ICU beds, and all 3 were highest in the Northeast. This is likely related to the higher reported volume of COVID-19 patients in the Northeast during the survey period. Significant numbers of respondents reported restricted availabilities of N95 masks, face shields, and eye protection, with the largest supply shortages and restrictions reported for PAPRs.
Perceptions about the availability of PPE and COVID-19 testing differed by HCP type. Nurses were more likely to report restrictions on N95 mask availability than physicians and physicians-in-training, and were more likely to report concerns about insufficient PPE and disagreement with hospital PPE policy. While most physicians reported that COVID-19 testing was available for all patients, less than a quarter of nurses and RTs reported universal availability. Our results are consistent with another US survey of ICU providers during COVID-19, conducted by the Society for Critical Care Medicine, which found that nurses were less likely to report their hospital was prepared to care for COVID-19 patients and more likely to express concerns about PPE shortages, compared to physicians [16]. This finding may indicate discrepancies in communication of hospital policies by HCP type. Additionally, nurses often spend more time at the bedside of sick patients and may feel shortages more acutely; they may also have higher levels of supervision as compared to physicians. However, the findings may also represent differences in hospital settings. Future research to investigate these discrepancies is needed, as they may have important implications for provider well-being and nurse/physician collaboration.
The most commonly reported HCP concerns include worries about transmitting infection to their families/communities and worries about their own health, consistent with a previous survey of ICU providers in the United States [6]. Concerns were generally more common in nurses, APPs, and RTs, compared to physicians or physicians-in-training. The prevalence of emotional distress/burnout in our study was similar to that of another HCP survey conducted during COVID-19, which reported 62% burnout in the United States (compared to 58% found in our study), which is higher than prepandemic levels of emotional distress/burnout in critical care HCPs (50%) [5, 17, 18].
Provider concerns are likely exacerbated by a reported lack of PPE, which was the strongest predictor of all 3 outcomes assessed: emotional distress/burnout, feeling that the hospital was unable to keep HCPs safe, and worries about COVID-19 transmission to their families/communities. HCPs who reported insufficient PPE were nearly 6 times more likely to feel that their hospitals could not keep them safe, which is a substantially large association; specifically, restricted availability of PAPR was a salient predictor. As the pandemic steadily continues in the United States, sustained and coordinated efforts to prioritize PPE for HCPs are critical to protecting the mental health and morale of frontline health-care workers. Additionally, more research is needed to understand the types of PAPR restrictions most associated with stressors among HCPs, as reporting restricted availability could either indicate that HCPs can obtain a PAPR after completing a request process or that their request is denied because it falls outside hospital guidelines for intended use. Future research is also needed to assess the types of hospital PPE policies most likely to elicit provider disagreement, including whether policies following Centers for Disease Control and Prevention guidelines are less likely to elicit disagreement.
Poor communication from supervisors was another modifiable risk factor of emotional distress/burnout and other concerns among HCPs. With unprecedented changes in workload, shifting responsibilities, and rapidly evolving hospital policies during COVID-19, supervisors may feel unsure about how to communicate difficult decisions with transparency. However, leadership serves a crucial role in creating an environment that supports the mental health of HCPs, through tangible support, such as the availability of PPE and mental health services, as well as through expressions of gratitude and appreciation [19]. Targeted training to improve supervisory support systems and promote clear communication may improve HCPs well-being during the pandemic. Stigma from one’s community was associated with a higher risk of HCP emotional distress/burnout and concerns, and was more commonly reported among nurses (33%), as compared to physicians (11%). Although HCPs may be perceived as “health-care heroes,” they can simultaneously experience distancing from their community due to fears that they are at high risk of having COVID-19 [20]. We find a lack of studies in the literature regarding HCPs perceptions of stigma and interventions to reduce stigma, suggesting more research is needed in this important area. Additionally, a shortage of ICU nurses was a stronger predictor of HCP concerns and burnout than a shortage of intensivists. Since nurses may be more likely to experience burnout, our findings highlight the importance of maintaining an emotionally healthy workforce of nurses to support high-quality care to patients during the pandemic.
Our findings that nurses and females have higher likelihoods of experiencing emotional distress and burnout is consistent with other studies conducted during COVID-19 [4, 5]. However, after adjustment in a multivariate regression, burnout was no longer associated with gender or occupation. This suggests that the higher likelihood of emotional distress/burnout among nurses and females may be largely mediated by concerns about insufficient access to PPE, poor communication with supervisors, and social stigma. Interventions targeted towards alleviating these concerns may reduce the higher burnout rates observed in these groups.
Our findings should be interpreted within the context of several limitations. The majority of respondents practiced in large, urban teaching hospitals, so our results may have limited generalizability to rural regions of the United States. Further, several states, including Washington, Massachusetts, and Michigan, were overrepresented in our sample. However, we conducted stratified analyses by geographic region and assessed variations across states. Further, the large sample size from the earliest and hardest hit states may provide important lessons learned to inform HCP mental well-being interventions nationally. In addition, our sampling strategy targeted survey distribution to critical care societies; therefore, most respondents specialized in critical care medicine, with lower representation from other specialties (eg, anesthesiology and surgery). Further, only 105 respondents in our sample were physicians-in-training. More studies are needed to assess differences in perspectives across specialties and training levels. Additionally, due to the cross-sectional nature of our study, we cannot determine the directionality of the relationships assessed or evaluate long-term trends or longitudinal predictors of concerns. Further, due to our sampling approach, we are unable to assess participation rates among persons who saw the survey, which may limit generalizability. Finally, the 2-week sampling period provides a snapshot of HCPs’ experiences, which are likely dynamically changing as the pandemic evolves. For example, we found that <15% of HCPs were worried about their financial situation; however, this proportion may increase over time as hospitals institute layoffs or furloughs.
Experts recommend understanding the specific sources of HCPs’ concerns to effectively target interventions, rather than teaching general approaches to stress reduction [2]. We assessed a broad range of HCP perceptions regarding shortages of PPE, personnel, ICU beds, and COVID-19 testing, and rigorously evaluated predictors of emotional distress/burnout and other concerns. Our analysis suggests that insufficient access to PPE is the strongest predictor of provider concerns and burnout. In addition, addressing poor communication from supervisors, nursing shortages, and social stigma may help mitigate concerns and improve HCP mental well-being during COVID-19 and future pandemics.
Supplementary Data
Supplementary materials are available at Clinical Infectious Diseases online. Consisting of data provided by the authors to benefit the reader, the posted materials are not copyedited and are the sole responsibility of the authors, so questions or comments should be addressed to the corresponding author.
Notes
Disclaimer. This study was approved by the University of Washington Institutional Review Board (STUDY00010095).
Potential conflicts of interest. J. R. C. reports grants from the National Institutes of Health, Cambia Health Foundation, and National Palliative Care Research Center, outside the submitted work. M. S. reports grants from the National Institutes of Health, outside the submitted work; and received support from National Institute of Mental Health (grant number K01MH115789). C. H. reports grants to her institution from the Federal Joint Committee, outside the submitted work; and has received funding from the Federal Joint Committee Innovation Funds (grant number FKZ 01VSF17010). C. J. C. is supported by National Institute of Neurological Disorders and Stroke (grant number NS099421). All other authors report no potential conflicts. All authors have submitted the ICMJE Form for Disclosure of Potential Conflicts of Interest. Conflicts that the editors consider relevant to the content of the manuscript have been disclosed.

