


Abstract
This study investigated adherence and associated factors among people with recent injection drug use (IDU) or current opioid agonist therapy (OAT) and compared once-daily to twice-daily hepatitis C virus (HCV) direct-acting antiviral (DAA) therapy.
SIMPLIFY and D3FEAT are international, multicenter studies that recruited participants with recent IDU (previous 6 months; SIMPLIFY, D3FEAT) or current OAT (D3FEAT) between March 2016 and February 2017 in 8 countries. Participants received sofosbuvir/velpatasvir (once daily; SIMPLIFY) or paritaprevir/ritonavir/ombitasvir, dasabuvir (twice daily) ± ribavirin (D3FEAT) for 12 weeks administered in electronic blister packs. We evaluated overall adherence (proportion of prescribed doses taken) and nonadherence (<90% adherent) between dosing patterns.
Of 190 participants, 184 (97%) completed treatment. Median adherence was 92%, with higher adherence among those receiving once-daily vs twice-daily therapy (94% vs 87%, P = .005). Overall, 40% of participants (n = 76) were nonadherent (<90% adherent). Recent stimulant injecting (odds ratio [OR], 2.48 [95% confidence interval {CI}, 1.28–4.82]), unstable housing (OR, 2.18 [95% CI, 1.01–4.70]), and twice-daily dosing (OR, 2.81 [95% CI, 1.47–5.36]) were associated with nonadherence. Adherence decreased during therapy. Sustained virologic response was high in nonadherent (89%) and adherent populations (95%, P = .174), with no difference in SVR between those who did and did not miss 7 consecutive doses (92% vs 93%, P = .897).
This study demonstrated high adherence to once- and twice-daily DAA therapy among people with recent IDU or currently receiving OAT. Nonadherence described did not impact treatment outcomes, suggesting forgiveness to nonadherence.
Although direct-acting antiviral (DAA) therapy is effective among people who inject drugs (PWID) [1], little is known about adherence, including factors associated with nonadherence and the impact of adherence on sustained virologic response (SVR). In many settings, there remains reluctance among some clinicians to provide hepatitis C virus (HCV) treatment for PWID on the basis that poor adherence may compromise treatment outcomes [2–4].
Studies from the interferon era have demonstrated that treatment completion and adherence are comparable between people with and without recent injection drug use (IDU) [5, 6]. In the DAA era, a small number of studies has demonstrated high adherence to DAA therapy among people with recent IDU [6–8] and people receiving opioid agonist therapy (OAT) [9–12]. The majority of studies evaluating adherence among people receiving OAT or people with recent IDU have used imprecise methods for measuring adherence, have heterogenous definitions of recent IDU, are often single-center, and are limited by small sample sizes. No study has compared once-daily and twice-daily DAA therapy.
SIMPLIFY and D3FEAT are 2 international, multicenter phase 4 trials of HCV DAA treatment that used electronic blister packs to assess adherence among people with recent (past 6 months) IDU or currently receiving OAT [13, 14]. The aims of this analysis were to evaluate adherence to DAA therapy and associated factors and to compare adherence between those receiving once-daily and twice-daily therapy.
METHODS
Study Design and Participants
In 2 international, multicenter, open-label phase 4 trials (SIMPLIFY [ClinicalTrials.gov: NCT02336139] and D3FEAT [ClinicalTrials.gov: NCT02498015]), participants were enrolled at 25 sites, in Australia (7 sites), Canada (6 sites), France (2 sites), New Zealand (2 sites), Norway (2 sites), Switzerland (4 sites), the United Kingdom (1 site), and the United States (1 site). These sites included 4 drug and alcohol clinics, 1 private practice, 17 hospital clinics, and 3 community clinics.
Participants were 18 years of age or older, had chronic HCV genotypes 1–6, were HCV treatment-naive, and had injected drugs in the past 6 months (self-reported at enrollment; SIMPLIFY and D3FEAT) or were currently receiving OAT (D3FEAT) (Figure 1). Participants with human immunodeficiency virus (HIV) infection or decompensated liver disease were excluded. All participants provided written informed consent before study procedures started.

Opioid agonist therapy (OAT) and injecting status of participants from SIMPLIFY and D3FEAT at enrollment.
Procedures
The study design of the SIMPLIFY and D3FEAT studies have previously been reported [13, 14]. In SIMPLIFY, patients received 1 co-formulated sofosbuvir/velpatasvir tablet once daily for 12 weeks. In D3FEAT, patients with HCV genotype 1a received 2 co-formulated paritaprevir/ritonavir/ombitasvir tablets once daily, and 1 dasabuvir tablet twice daily for 12 weeks. Participants with genotype 1a also received weight-based ribavirin twice daily.
Participants in D3FEAT received ribavirin in pill bottles. All other study drugs were dosed weekly in electronic blister packs (Information Mediary Corporation, Ottawa, Canada) that recorded the date and time each dose was removed. In SIMPLIFY, the blister packs contained 1 tablet per day in a single blister. In D3FEAT, the blister packs contained 3 tablets in individual blisters for the morning dose and 1 tablet in a single blister for the evening dose (Figure 2). Participants received AUS$10 (or equivalent) to return each blister pack. Adherence was also measured by counting remaining pills in the returned blister packs (clinical pill count) and through self-reported adherence questionnaires every 4 weeks.
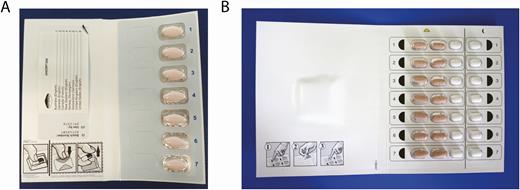
Blister packs used for dosing and adherence monitoring in DEFEAT; A and SIMPLIFY; B.
Participants completed a self-administered questionnaire on a tablet computer at enrollment, at treatment commencement, and every fourth week during treatment. The questionnaires collected information on demographics, drug and alcohol use, and injecting risk behaviors. Stable housing was defined as living in a rented or privately owned house or flat, with all other housing categories defined as unstable housing. Hazardous alcohol consumption was evaluated using the Alcohol Use Disorders Identification Test (AUDIT-C) [15].
Outcomes
The primary endpoint for this analysis was nonadherence to DAA therapy, defined as receiving the correct dosing on <90% of the intended days of treatment as measured by electronic blister pack. Correct dosing was at least 1 dose (1 tablet) per day in SIMPLIFY and at least 2 doses (4 tablets) per day in D3FEAT. Ribavirin dosing was not included in analyses. Where more than the expected number of doses was removed in 1 day, adherence was recorded as 100% for the day. In the case of damaged blister packs (n = 7) or participants removing pills without breaking the senor grid (n = 2), clinical pill count was used.
Overall adherence was a secondary endpoint, calculated by dividing the number of doses removed from the blister pack (to a maximum of 1 per day in SIMPLIFY and 2 per day in D3FEAT) by the number of expected doses (84 doses in SIMPLIFY and 168 for D3FEAT). Weekly adherence was calculated assuming that all pills removed in a week were taken correctly to a maximum of 100% adherence in each week. Overall weekly adherence was calculated as the mean of the adherence for each treatment week. Self-reported adherence to therapy was calculated by dividing the number of pills taken by the expected number of pills.
Statistical Analysis
Participants with <90% adherence (nonadherence) and ≥90% adherence were compared using Pearson χ 2 test. Logistic regression was used to assess predictors of nonadherence. Hypothesized predictors included age (stratified by median), sex, education, hazardous alcohol consumption, current OAT, past month IDU (any, heroin, cocaine, amphetamine, stimulant [cocaine or amphetamine]), frequency of IDU, and region of residence (North America, Australia/New Zealand, or Europe). All variables with P < .20 in the unadjusted analyses were considered for multivariate logistic regression models using a backward stepwise approach.
The impact of time on treatment was assessed using generalized estimating equation (GEE) analyses by including day of treatment as a factor in the model adjusted for age, sex, current OAT, heroin injecting, stimulant injecting, unstable housing, and hazardous alcohol consumption. As dosing pattern (once- vs twice-daily dosing) was determined to be a potential effect modifier, GEE analyses were done stratified by dosing pattern.
Statistically significant differences were assessed at P < .05; P values are 2-sided. All analyses were performed using the statistical package Stata version 14.1 (StataCorp, College Station, Texas).
RESULTS
Baseline Characteristics
One hundred ninety participants initiated DAA therapy (SIMPLIFY, n = 103; D3FEAT, n = 87). The baseline behavioral and demographic characteristics are shown in Table 1. The median age was 48 years, 74% were male, and 49% reported a high school education or greater.
Participant Characteristics at Baseline Overall and Stratified by Study
| Characteristic | Overall (N = 190) | SIMPLIFY (Once Daily) (n = 103) | D3FEAT (Twice Daily) (n = 87) | P Value |
|---|---|---|---|---|
| Age, y, median (IQR) | 48 (41–53) | 48 (41–53) | 48 (43–54) | .727 |
| Male sex | 141 (74) | 74 (72) | 67 (77) | .417 |
| High school or greater education | 93 (49) | 50 (49) | 41 (49) | .971 |
| Unstable housing | 37 (20) | 24 (23) | 13 (16) | .195 |
| Hazardous alcohol consumptiona | 97 (51) | 18 (17) | 10 (12) | .274 |
| OAT (current) | 158 (83) | 58 (56) | 62 (73) | .018 |
| OAT and recent IDU (past month) | < .001 | |||
| No OAT, no recent IDU | 21 (11) | 12 (12) | 9 (11) | |
| No OAT, recent IDU | 47 (25) | 33 (32) | 14 (17) | |
| OAT, no recent IDU | 52 (28) | 15 (15) | 37 (45) | |
| OAT, recent IDU | 68 (36) | 43 (42) | 23 (28) | |
| Study site distribution | .003 | |||
| Australia/New Zealand | 61 (32) | 43 (42) | 18 (21) | |
| North America | 78 (41) | 40 (39) | 38 (44) | |
| Europe | 51 (27) | 20 (19) | 31 (36) | |
| Any IDU in the past month | 115 (61) | 76 (74) | 39 (46) | < .001 |
| IDU ≥daily in the past monthb | 40 (35) | 27 (36) | 13 (33) | .815 |
| Drugs injected in the past monthb | ||||
| Heroin | 77 (67) | 55 (72) | 22 (59) | .167 |
| Cocaine | 21 (18) | 12 (16) | 9 (24) | .274 |
| Amphetamines | 42 (37) | 27 (36) | 15 (41) | .605 |
Data are presented as no. (%) unless otherwise indicated.
Abbreviations: IDU, injection drug use; IQR, interquartile range; OAT, opioid agonist therapy.
aAccording to the Alcohol Use Disorders Identification Test (AUDIT-C), with hazardous alcohol consumption defined as a score of ≥3 in women and ≥4 in men.
bAmong those who reported IDU in the past month.
At baseline, participants included those who had injected drugs in the past 6 months and were not on OAT (n = 63 [33%]), those with IDU in the past 6 months on OAT (n = 90 [47%]), and those without IDU in the past 6 months on OAT (n = 37 [19%]; D3FEAT only; Figure 1). Sixty-one percent (n = 115) had injected drugs in the past month. The drugs most commonly injected in the month prior to commencement of therapy were heroin and amphetamines (67% and 37%, respectively; Table 1). In the D3FEAT study, 90% (n = 78) were receiving ribavirin.
Differences between those receiving once-daily (SIMPLIFY) compared to twice-daily (D3FEAT) therapy are presented in Table 1. Participants receiving twice-daily therapy were more likely to be receiving OAT at baseline and less likely to have injected any drugs in the past month or be residing outside Australia/New Zealand. Among people with IDU in the past month, there was no significant difference in injecting frequency or the types of drugs injected between those receiving once- or twice-daily therapy. The only difference between participants who reported injecting in the past 6 months at enrollment (SIMPLIFY and D3FEAT) and those who did not (D3FEAT) was region of residence, with participants with current IDU being more likely to reside in Europe (Supplementary Table 1).
Treatment Completion and Adherence
One hundred eighty-four of 190 (97%) participants completed treatment as defined by attending the end-of-treatment study visit (Table 2). Reasons for not completing treatment were loss to follow-up (n = 3), incarceration (n = 1), physician-directed discontinuation (n = 1), and death due to overdose (n = 1).
Measures of Treatment Completion and Adherence Stratified by Dosing Pattern
| Variable | Overall (N = 190) | Once Daily (n = 103) | Twice Daily (n = 87) |
|---|---|---|---|
| Treatment completion | 184 (97) | 100 (97) | 84 (97) |
| No. of days nonadherent to therapy | |||
| None (100% adherent) | 19 (10) | 12 (12) | 7 (8) |
| 1–4 (95% to <100% adherent) | 56 (29) | 36 (35) | 20 (23) |
| 5–8 (90% to <95% adherent) | 35 (18) | 20 (19) | 15 (17) |
| 9–17 (80% to <90% adherent) | 34 (18) | 17 (17) | 17 (20) |
| ≥18 (<80% adherent) | 46 (24) | 18 (17) | 28 (32) |
| Overall adherence, % (95% CI) | |||
| Patient report | 99 (97–100) | 99 (98–100) | 99 (96–100) |
| Blister pack, weekly | 98 (94–100) | 98 (94–100) | 98 (93–99) |
| Blister pack, daily | 92 (81–98) | 94 (88–98) | 88 (75–96) |
| Longest episode of nonadherence, days | |||
| 1 | 80 (42) | 44 (43) | 36 (41) |
| 2 | 39 (21) | 19 (18) | 20 (23) |
| 3 | 8 (4) | 3 (3) | 5 (6) |
| 4 | 11 (6) | 9 (9) | 2 (2) |
| 5 | 5 (3) | 2 (2) | 3 (3) |
| 6 | 3 (2) | 3 (3) | 0 (0) |
| ≥7 | 25 (13) | 11 (11) | 14 (16) |
Data are presented as no. (%) unless otherwise indicated.
Abbreviation: CI, confidence interval.
Overall adherence, as measured by blister pack, was 92% (interquartile range [IQR], 81%–98%; Table 2 and Figure 3) and was higher among those receiving once-daily compared to twice-daily therapy (94% vs 87%, P = .005; Figure 4). Adherence was higher when measured by self-report (99% [IQR, 97%–100%]) and weekly-assessed blister pack adherence (98% [IQR 94%–100%]). Patient-reported reasons for nonadherence by blister pack assessment were available in 175 instances over the course of therapy and included “forgot” (n = 104 [59%]), “inaccessible at time of dose” (n = 31 [18%]), “side effects” (n = 17 [10%]), “lost” (n = 10 [6%]), and “other” (n = 13 [7%]).
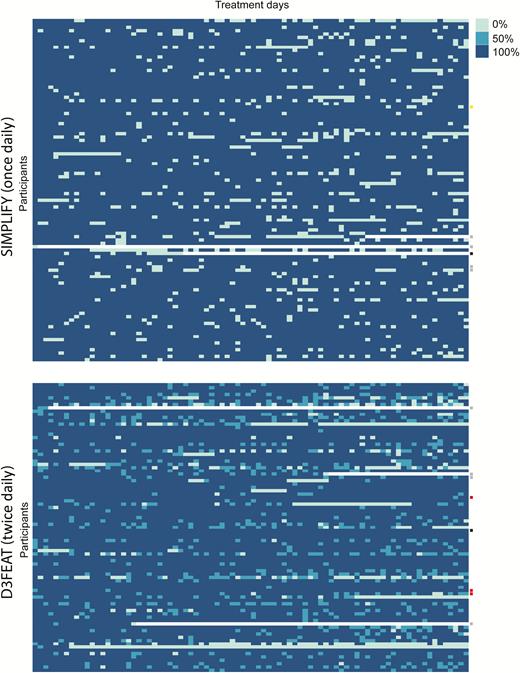
Daily adherence to therapy in SIMPLIFY and D3FEAT, measured by weekly administered electronic blister packs. Each row represents an individual patient and each column represents 1 day of therapy. Dark blue boxes represent 100% of prescribed doses received, medium blue represents 50% of daily doses received (in D3FEAT only), and light blue boxes represent no dose received. White boxes represent early discontinuation of treatment. Failure to achieve sustained virologic response due to virologic failure (red), reinfection (yellow), loss to follow-up (gray), and death (black) is denoted on the right.
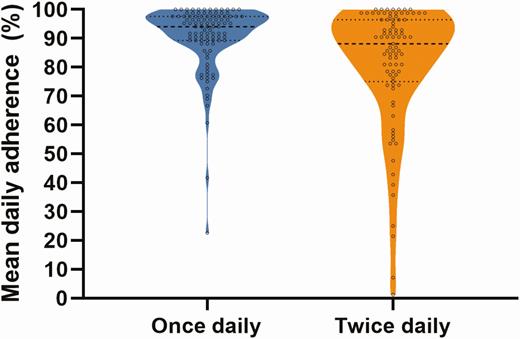
Violin plot of adherence to hepatitis C virus direct-acting antiviral treatment among people receiving once-daily therapy (blue) and twice-daily therapy (orange).
By daily blister pack measurement, 90% (n = 171) of participants did not take all prescribed doses on at least 1 day of treatment and 48% of participants did not take all prescribed doses on between 1 and 8 days of treatment. Episodes of nonadherence lasted for no more than 1 consecutive day in 42% of participants. Twenty-five participants (13%) had an episode of nonadherence for ≥7 consecutive days.
Baseline Predictors of Nonadherence
The proportion of participants with <90% blister pack adherence (nonadherence) stratified by key behavioral and demographic characteristics is shown in Table 3. In adjusted analyses, factors independently associated with nonadherence included unstable housing (adjusted odds ratio [aOR], 2.18 [95% confidence interval {CI}, 1.01–4.70]), stimulant injecting in the past month (aOR, 2.48 [95% CI, 1.28–4.82]), and twice-daily dosing (aOR, 2.81 [95% CI, 1.47–5.36]).
Logistic Regression of Factors Associated With Nonadherence (<90%)
| Characteristic | DAA Adherence of ≥90% (n = 114) | DAA Adherence of <90% (n = 76) | Unadjusted OR (95% CI) | P Value | Adjusted OR (95% CI) | P Value |
|---|---|---|---|---|---|---|
| Age, y | ||||||
| <48 | 53 (55) | 44 (45) | 1.00 | … | ||
| ≥48 | 61 (66) | 32 (34) | 0.63 (.35–1.13) | .124 | … | |
| Sex | ||||||
| Male | 81 (57) | 60 (43) | 1.00 | … | ||
| Female | 33 (67) | 16 (33) | 0.65 (.33–1.30) | .225 | … | |
| Education | ||||||
| Less than high school | 60 (63) | 36 (38) | 1.00 | … | ||
| High school or greater | 53 (58) | 38 (42) | 0.97 (.85–1.10) | .606 | … | |
| Housing | ||||||
| Stable | 96 (64) | 53 (36) | 1.00 | … | ||
| Unstable | 17 (46) | 20 (54) | 2.13 (1.03–4.41) | .042 | 2.18 (1.01–4.70) | .046 |
| Hazardous alcohol consumption | ||||||
| No | 95 (59) | 65 (41) | 1.00 | … | ||
| Yes | 19 (68) | 9 (32) | 0.69 (.29–1.63) | .398 | … | |
| Current OAT | ||||||
| No | 44 (65) | 24 (35) | 1.00 | … | ||
| Yes | 69 (58) | 51 (43) | 1.36 (.73–2.51) | .333 | … | |
| IDU (past month)a | ||||||
| No | 51 (70) | 22 (30) | 1.00 | … | ||
| Yes | 63 (55) | 52 (45) | 1.91 (1.03–3.56) | .040 | … | |
| Frequency of IDU (past month)a | ||||||
| Never | 51 (70) | 22 (30) | 1.00 | … | ||
| Less than daily | 40 (53) | 35 (47) | 2.03 (1.03–3.98) | .040 | … | |
| Daily or greater | 23 (58) | 17 (43) | 1.71 (.77–3.82) | .188 | … | |
| Any injecting during treatment | ||||||
| No | 42 (68) | 20 (32) | 1.00 | … | ||
| Yes | 72 (58) | 52 (42) | 1.52 (.80–2.88) | .203 | … | |
| Heroin injecting (past month) | ||||||
| No | 65 (61) | 41 (39) | 1.00 | … | ||
| Yes | 48 (59) | 34 (41) | 1.12 (.62–2.02) | .699 | … | |
| Cocaine injecting (past month) | ||||||
| No | 102 (62) | 62 (38) | 1.00 | … | ||
| Yes | 11 (50) | 11 (50) | 1.65 (.67–4.02) | .275 | … | |
| Amphetamine injecting (past month) | ||||||
| No | 92 (66) | 48 (34) | 1.00 | … | ||
| Yes | 21 (46) | 25 (54) | 2.28 (1.16–4.49) | .017 | … | |
| Cocaine/amphetamine injecting (past month) | ||||||
| No | 82 (66) | 42 (34) | 1.00 | … | ||
| Yes | 31 (48) | 33 (52) | 2.08 (1.12–3.85) | .020 | 2.48 (1.28–4.82) | .007 |
| Fibrosis stage | ||||||
| F0–F1 | 77 (61) | 50 (39) | 1.00 | … | ||
| F2–F3 | 23 (59) | 16 (41) | 1.07 (.52–2.22) | .853 | … | |
| F4 | 10 (59) | 7 (41) | 1.08 (.39–3.02) | .886 | … | |
| Dosing pattern | ||||||
| Once daily | 71 (69) | 32 (31) | 1.00 | … | ||
| Twice daily | 43 (49) | 44 (51) | 2.27 (1.26–4.11) | .007 | 2.81 (1.47–5.36) | .002 |
Data are presented as no. (%) unless otherwise indicated.
Abbreviations: CI, confidence interval; DAA, direct-acting antiviral; IDU, injection drug use; OAT, opioid agonist therapy; OR, odds ratio.
aNot included in adjusted analysis due to collinearity with drug type.
In a sensitivity analysis excluding participants from D3FEAT who did not report injecting in the past 6 months at enrollment, factors independently associated with nonadherence included stimulant injecting in the past month (aOR, 2.32 [95% CI, 1.16–4.65]) and twice-daily dosing (aOR, 3.26 [95% CI, 1.57–6.79]; Supplementary Table 2).
Change in Adherence Over the Course of Therapy
The change in adherence over the course of therapy stratified by dosing pattern is shown in Figure 5. In GEE analyses, later treatment period was associated with increased odds of nonadherence (per week; aOR, 1.08 [95% CI, 1.06–1.09]). When models were stratified by prescribed dosing pattern, this effect remained for both once-daily dosing (per week; aOR, 1.08 [95% CI, 1.06–1.11]) and twice-daily dosing (per week; aOR, 1.08 [95% CI, 1.06–1.10]).
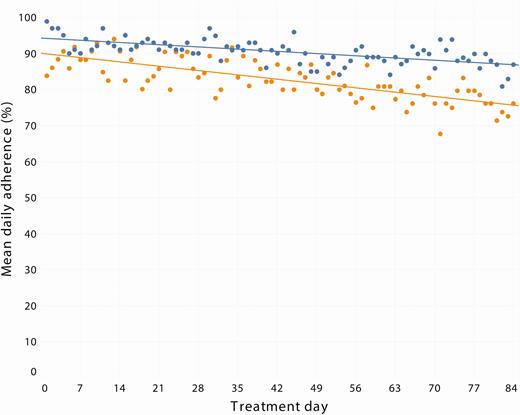
Mean daily adherence over the course of therapy among those receiving once-daily (blue) and twice-daily (orange) dosing.
Impact of DAA Adherence on SVR
SVR by intent-to-treat was 93% (176 of 190). Among participants who did not achieve SVR, the reasons for not achieving SVR included virologic failure (n = 3), reinfection (n = 1), loss to follow-up during treatment (n = 6), loss to follow-up following treatment (n = 2), and death (n = 2). All 3 participants with virologic failure were receiving twice-daily paritaprevir/ritonavir/ombitasvir, dasabuvir (individual daily blister pack adherence was 99%, 98%, and 86%).
SVR was lower among those not adherent to therapy, although not significant (89% vs 95%, P = .174) and similar when those who were lost to follow-up were excluded (99% vs 97%, P = .579). There was no difference in SVR between those with and without any missed doses (92% vs 95%, P = .711) or among those who did and did not miss at least 7 consecutive doses (92% vs 93%, P = .897). Of the 25 participants with an episode of nonadherence for at least 7 consecutive days, 21 (84%) completed treatment with no virologic failures. Eleven participants had an overall adherence of <50%, among whom 6 achieved SVR with no virologic failures; the remaining 5 participants were lost to follow-up.
DISCUSSION
This study evaluated adherence to HCV DAA therapy and associated factors and compared adherence between those receiving sofosbuvir/velpatasvir (once daily) and paritaprevir/ritonavir/ombitasvir, dasabuvir with or without ribavirin (twice daily) therapy in people with IDU in the past 6 months or receiving OAT. High adherence to therapy was observed, although adherence declined during treatment. Adherence was lower among people receiving twice-daily therapy. Unstable housing, stimulant injecting, and receiving twice-daily therapy were associated with nonadherence. Adherence, missed doses during therapy, and extended nonadherent episodes (≥7 days) did not impact SVR, suggesting forgiveness to nonadherence with these 2 regimens. These data are important to inform clinical guidelines, clinical management, and health policy, particularly in settings where restrictions for the reimbursement of DAA therapy for PWID are in place.
The high median adherence (92%) observed in this study is consistent with other studies among people with recent IDU and people receiving OAT [7, 8, 16–21]. Previous studies have been limited by their adherence assessment methodologies (self-report or clinical pill count) and by small sample sizes. In this study, adherence to once-daily therapy was higher compared to twice-daily therapy (94% vs 87%). This finding is novel in the context of HCV DAA therapy, consistent with studies of HIV therapy demonstrating higher adherence to once-daily regimens [22–25]. These data highlight the importance of simplified dosing to optimize adherence among PWID and people receiving OAT.
A decline in adherence was observed during treatment, consistent with previous studies [19, 21]. The use of electronic blister packs for adherence monitoring was a major strength of this study, allowing for detailed and accurate adherence measurement over time, providing a more precise estimate of the effect of time on nonadherence. It is interesting that similar declines in adherence were observed irrespective of dosing pattern (once daily vs twice daily). While there has been an interest in exploring shorter durations of DAA therapy, it is not clear whether there would be a similar “forgiveness” to nonadherence with shorter durations of therapy. Further research is needed to evaluate the impact of nonadherence on SVR in the context of short-duration DAA therapy.
In addition to dosing pattern, recent stimulant injecting and unstable housing were associated with nonadherence. Although studies have demonstrated that recent IDU is associated with reduced adherence, most studies have lacked the power to evaluate the effect of specific types of drugs on adherence [5, 6, 19, 21]. The association between stimulant use and adherence may be of concern given the increasing prevalence of stimulant use reported in many countries globally [26]. Unstable housing was also independently associated with nonadherence. While homelessness has been shown to be associated with treatment failure [27], our finding of an association between unstable housing and nonadherence is novel and consistent with a systematic review demonstrating poorer adherence to HIV therapy among unstably housed populations [28]. Despite these factors impacting adherence, there was no significant impact on treatment outcome.
The limited impact of adherence on SVR was an encouraging finding. Among those who did not achieve an SVR, the primary reason for treatment failure was loss to follow-up during or following treatment. Of the 3 people who completed therapy and had virologic failure, adherence was high (99%, 98%, and 86%). Among those with adherence <50% (n = 11), 6 achieved SVR with no recorded virologic failures. This included successful therapy among a participant with adherence of only 25%. Despite the observed nonadherence and risk factors for nonadherence, these data highlight that the 2 HCV DAA regimens examined in this study have a considerable degree of forgiveness to nonadherence and support the inclusion this population in HCV treatment programs.
This study had some limitations. Although the method of adherence monitoring was precise, the blister packs required accurate and correct usage. For example, when more than the expected number of pills was removed on a given day, adherence was restricted to 100%. If the additional pills removed were taken correctly on subsequent days, then the adherence recorded would underestimate the participant’s true adherence. Alternatively, weekly adherence, which assumes that all pills removed in a given week were taken correctly, likely overestimates a participant’s true adherence. Therefore, a participant’s true adherence likely lies somewhere between daily- and weekly-assessed blister pack adherence. Despite these concerns, blister pack measurement of adherence remains a more robust method of measuring adherence compared to clinical pill count or self-report [29].
Another limitation is that data for this analysis were combined from 2 separate clinical trials with different inclusion criteria (SIMPLIFY: IDU in the past 6 months; D3FEAT: IDU in the past 6 months or receiving OAT); however, D3FEAT still recruited a high proportion of people with IDU in the past 6 months. In sensitivity analyses excluding the participants from D3FEAT who did not report injecting in the past 6 months at enrollment, stimulant injecting in the past month and twice-daily therapy remained associated with nonadherence. Furthermore, characteristics of the study populations were similar, likely due to the use of the same recruitment network for study enrollment, and any remaining differences were controlled for in adjusted analyses. Last, participants from D3FEAT who were receiving twice-daily therapy represented a less marginalized population, despite having poorer adherence.
The results of this study cannot necessarily be generalized to all populations of PWID and people receiving OAT. While the international nature of these data enhances the generalizability, participants likely represent a somewhat selected population who were engaged with health services and were not coinfected with HIV. Furthermore, participants were treated in clinics that may have been more experienced in HCV treatment in these populations and the lack of randomization could have resulted in unmeasured confounding due to, for example, the decision by study sites to include or exclude particular patients in the trials.
Last, adherence to therapy was likely enhanced by weekly contact with healthcare providers to return used blister packs and obtain subsequent doses, and the blister pack itself may have indirectly acted as an adherence support tool. Furthermore, although the incentive received for the return of the blister pack was not linked to the measured adherence, this incentive may have indirectly encouraged greater adherence. Despite these limitations, these data present a robust analysis of treatment adherence in a high-risk population of people with IDU in the past 6 months and people receiving OAT.
Overall, adherence was high in this study. Different patterns of nonadherence did not impact SVR, suggesting a degree of forgiveness to nonadherence with the regimens of once-daily sofosbuvir/velpatasvir and twice-daily paritaprevir/ritonavir/ombitasvir, dasabuvir with or without ribavirin. Further research is needed to evaluate the impact of adherence on SVR in the context of shorter durations of DAA therapy. Taken together, these data support DAA therapy among people with recent IDU and people receiving OAT. These data are important to inform clinical guidelines and improve clinical management of HCV infection among people with recent IDU. Moreover, these data provide key information to support the removal of restrictions for the reimbursement of HCV DAA therapy for people with recent drug or alcohol use that are still in place in some settings globally [30, 31].
Supplementary Data
Supplementary materials are available at Clinical Infectious Diseases online. Consisting of data provided by the authors to benefit the reader, the posted materials are not copyedited and are the sole responsibility of the authors, so questions or comments should be addressed to the corresponding author.
Notes
Acknowledgments. The authors thank the study participants for their contribution to research, as well as current and past researchers and staff. They acknowledge the following members of the study group: Protocol Steering Committee—Jason Grebely (chair, University of New South Wales [UNSW] Sydney, Sydney, Australia), Gregory Dore (UNSW Sydney, Sydney, Australia), Philippa Marks (UNSW Sydney, Sydney, Australia), Olav Dalgard (Akershus University Hospital, Oslo, Norway), Philip Bruggmann (Arud Centres for Addiction Medicine, Zurich, Switzerland), Catherine Stedman (Christchurch Hospital, Christchurch, New Zealand), Karine Lacombe (Hôpital Saint-Antoine, Paris, France), Jeff Powis (South Riverdale Community Health Centre, Toronto, Canada), Margaret Hellard (Alfred Hospital, Melbourne, Australia), Sione Crawford (Hepatitis Victoria, Melbourne, Australia), Tracy Swan (International Network on Hepatitis in Substance Users, New York, New York), Jude Byrne (Australian Injecting & Illicit Drug Users League, Canberra, Australia), and Melanie Lacalamita (Poliklinik fur Infektiologie, Inselspital, Bern, Switzerland). Coordinating Centre—Amanda Erratt (study coordinator), Evan Cunningham (associate lecturer), Behzad Hajarizadeh (lecturer), Jason Grebely (coprincipal investigator), Gregory Dore (coprincipal investigator), Pip Marks (clinical trials manager), Ineke Shaw (systems manager), Sharmila Siriragavan (data manager), Janaki Amin (statistician), Sophie Quiene (clinical project coordinator), and Kathy Petoumenos (biostatistics and databases program). Site Principal Investigators—Philip Bruggmann (Arud Centres for Addiction Medicine, Zurich, Switzerland), Patrick Schmid (Kantonsspital St Gallen, St Gallen, Switzerland), Erika Castro (Centre Hospitalier Universitaire Vaudois, Lausanne, Switzerland), Alberto Moriggia (Fondazione Epatocentro Ticino, Lugano, Switzerland), Karine Lacombe (Hôpital Saint-Antoine, Paris, France), Jean-Pierre Daulouede (Csapa Bizia, Bayonne, France), Olav Dalgard (Akershus University Hospital, Oslo, Norway), Brian Conway (Vancouver Infectious Diseases Center, Vancouver, Canada), Christopher Fraser (Cool Aid Community Health Centre, Victoria, Canada), Jeff Powis (South Riverdale Community Health Centre, Toronto, Canada), Jordan Feld (Toronto General Hospital, Toronto, Canada), Julie Bruneau (Centre Hôspitalier de l’Université de Montréal, Montréal, Canada), Curtis Cooper (Ottawa Hospital, Ottawa, Canada), Ed Gane (Auckland Hospital, Auckland, New Zealand), Catherine Stedman (Christchurch Hospital, Christchurch, New Zealand), Gail Matthews (St Vincent’s Hospital, Sydney Australia), Adrian Dunlop (Newcastle Pharmacotherapy Service, Newcastle, Australia), Margaret Hellard (Alfred Hospital, Melbourne, Australia), Ian Kronborg (Footscray Hospital, Footscray, Australia), David Shaw (Royal Adelaide Hospital, Adelaide, Australia), Alain Litwin and Brianna Norton (Montefiore Medical Centre, New York, New York; Division of General Internal Medicine, Department of Medicine, Albert Einstein College of Medicine, New York, New York), Maria Christine Thurnheer (Poliklinik fur Infektiologie, Inselspital, Bern, Switzerland), Martin Weltman (Nepean Hospital, Kingswood, Australia), Philip Read (Kirby Institute, UNSW Sydney, Sydney, Australia; Kirketon Road Centre, Sydney, Australia), and John Dillon (Ninewells Hospital, Dundee, United Kingdom). Site Coordinators—Tina Horschik (Arud Centres for Addiction Medicine, Zurich, Switzerland), Simone Kessler and Cornelia Knapp (Kantonsspital St Gallen, St Gallen, Switzerland), Lorenza Oprandi (Centre Hospitalier Universitaire Vaudois, Lausanne, Switzerland), Paola Messina and Marzia Pantic (Fondazione Epatocentro Ticino, Lugano, Switzerland), Manuela Le Cam (Hôpital Saint-Antoine, Paris, France), Cecilia Maitre (Csapa Bizia, Bayonne, France), Jessica Andreassen, Ingunn Melkeraaen, and Merete Moen Tollefsen (Akershus University Hospital, Oslo, Norway), Hannah Pagarigan (Vancouver Infectious Diseases Center, Vancouver, Canada), Rozalyn Milne (Cool Aid Community Health Centre, Victoria, Canada), Kate Mason (South Riverdale Community Health Centre, Toronto, Canada), Diana Kaznowski and Lily Zou (Toronto General Hospital, Toronto, Canada), Rachel Bouchard and Barbara Kotsoros (Centre Hôspitalier de l’Université de Montréal, Montréal, Canada), Miriam Muir and Jessica Milloy (Ottawa Hospital, Ottawa, Canada), Victoria Oliver (Auckland Hospital, Auckland, New Zealand), Tracy Noonan (Christchurch Hospital, Christchurch, New Zealand), Alison Sevehon (St Vincent’s Hospital, Sydney, Australia), Susan Hazelwood and Michelle Hall (Newcastle Pharmacotherapy Service, Newcastle, Australia), Michelle Hagenauer (Alfred Hospital, Melbourne, Australia), Rachel Liddle (Footscray Hospital, Footscray, Australia), Catherine Ferguson (Royal Adelaide Hospital, Adelaide, Australia), Linda Agyemang, Hiral Patel, and Irene Soloway (Montefiore Medical Centre, New York, New York), Orlando Cerocchi (Toronto General Hospital, Toronto, Canada), Melanie Lacalamita (Poliklinik fur Infektiologie, Inselspital, Bern, Switzerland), Vincenzo Fragomeli (Nepean Hospital, Kingswood, Australia), Rosie Gilliver, Rebecca Lothian (Kirby Institute, UNSW Sydney, Sydney, Australia; Kirketon Road Centre, Sydney, Australia), Shirley Cleary and Linda Johnston (Ninewells Hospital, Dundee, United Kingdom), and Sarah Middleton (Auckland City Hospital, Auckland, New Zealand). The authors also thank Ronald D’Amico, Barbara McGovern, Jonathan Anderson, Ze Zhong, Fiona Keane, Fernando Tatsch, and others at AbbVie and Diana Brainard, John McHutchison, and others at Gilead Sciences for their support.
Financial support. This work was supported by funding from AbbVie and Gilead Sciences. The Kirby Institute, which sponsored this study, is funded by the Australian Government Department of Health and Ageing.
Disclaimer. The sponsors had no role in the analysis and interpretation of the study results. The views expressed in this publication do not necessarily represent the position of the Australian Government.
Potential conflicts of interest. J. G. reports grants and personal fees from AbbVie, Cepheid, Gilead Sciences (Gilead), and Merck. O. D. reports grants from Gilead during this study and grants from Gilead, Merck, and AbbVie and advisory board fees from AbbVie and MSD, outside the submitted work. P. B. reports grants and personal fees from AbbVie, Bristol-Myers Squibb (BMS), Gilead, Mundipharma, and Merck Sharp & Dohme (MSD). M. H. reports grants from Gilead, BMS, and AbbVie. J. B. reports consultant fees from Gilead and Merck. A. H. L. reports grants and personal fees from Gilead and Merck, and personal fees from AbbVie. G. V. M. reports grants and personal fees from Gilead and grants and personal fees from AbbVie. J. P. reports grants and personal fees from Janssen and Genentech. C. C. reports grants and personal fees from Gilead, Merck, and AbbVie. J. J. F. reports grants and personal fees from AbbVie, Merck, Gilead, Roche, Wako/Fujifilm, and Janssen; personal fees from Contravir; and grants from Abbott and Enanta. C. F. reports grants and nonfinancial support from the Kirby Institute, AbbVie, and Gilead during this study and grants from Gilead, ViiV Healthcare, AbbVie, and Merck, outside the submitted work. G. J. D. reports grants, personal fees, and nonfinancial support from AbbVie, Merck, BMS, and Roche; grants and personal fees from Janssen; personal fees and nonfinancial support from Gilead; and personal fees from GlaxoSmithKline and Abbott Diagnostics. P. R. reports fees for educational talks from Gilead, MSD, and AbbVie, and is on the advisory board for MSD. B. C. reports grants, personal fees, and nonfinancial support from Gilead, Merck, AbbVie, Indivior, and ViiV. E. G. reports personal fees from being a clinical advisor for Gilead, Merck, Janssen, and AbbVie, and speaker’s fees from Gilead and AbbVie. J. F. D. reports grants from AbbVie during the course of the study, and grants and personal fees from Gilead, MSD, Janssen, and AbbVie, outside the submitted work. B. H. reports grants from AbbVie and Gilead. D. S. reports clinical trial nurse support from the Kirby Institute, during the study. K. L. reports advisory board fees and travel grants from AbbVie, MSD, and Gilead. All other authors report no potential conflicts of interest. All authors have submitted the ICMJE Form for Disclosure of Potential Conflicts of Interest. Conflicts that the editors consider relevant to the content of the manuscript have been disclosed.
References

