


Abstract
Integrase strand-transfer inhibitor (INSTI)-based antiretroviral therapy (ART) is recommended for human immunodeficiency virus (HIV) management. Although studies have suggested associations between INSTIs and weight gain, women living with HIV (WLHIV) have been underrepresented in research. We evaluated the effect of switching or adding INSTIs among WLHIV.
Women enrolled in the Women’s Interagency HIV Study (WIHS) from 2006–2017 who switched to or added an INSTI to ART (SWAD group) were compared to women on non-INSTI ART (STAY group). Body weight, body mass index (BMI), percentage body fat (PBF), and waist, hip, arm, and thigh circumferences were measured 6–12 months before and 6–18 months after the INSTI switch/add in SWAD participants, with comparable measurement time points in STAY participants. Linear regression models compared changes over time by SWAD/STAY group, adjusted for age, race, WIHS site, education, income, smoking status, and baseline ART regimen.
We followed 1118 women (234 SWAD and 884 STAY) for a mean of 2.0 years (+/− 0.1 standard deviation [SD]; mean age 48.8 years, SD +/− 8.8); 61% were Black. On average, compared to the STAY group, the SWAD group experienced mean greater increases of 2.1 kg in body weight, 0.8 kg/m2 in BMI, 1.4% in PBF, and 2.0, 1.9, 0.6, and 1.0 cm in waist, hip, arm, and thigh circumference, respectively (all P values < .05). No differences in magnitudes of these changes were observed by INSTI type.
In WLHIV, a switch to INSTI was associated with significant increases in body weight, body circumferences, and fat percentages, compared to non-INSTI ART. The metabolic and other health effects of these changes deserve further investigation.
In women living with human immunodeficiency virus, the use of integrase strand transfer inhibitors (INSTI) was associated with weight and body measurement increases, compared to other regimens. Research is needed for the management of weight gain associated with INSTI use.
Obesity is an urgent public health problem in the United States, with an increasing prevalence, particularly in women [1]. Obesity contributes to adverse health outcomes, including cardiovascular disease, diabetes, and hypertension [1]. With antiretroviral therapy (ART), persons living with human immunodeficiency virus (HIV; PLHIV) are living longer and experiencing lower rates of acquired immunodeficiency syndrome (AIDS)-related wasting syndromes [2, 3]. In fact, PLHIV are increasingly overweight or obese either at diagnosis or during HIV treatment [4, 5], a finding that may be more pronounced in women living with HIV (WLHIV) [6].
Integrase strand-transfer inhibitors (INSTIs) are recommended first-line treatments [7] for treatment-naive PLHIV, due to their virologic efficacy and improved tolerability, as compared to other regimens [8]. Although INSTIs have a low pill burden, good safety profile, and limited drug-drug interactions, there are growing concerns regarding side effects, particularly in WLHIV [8]. Previous studies have shown that adults who switch from non-INSTI ART to INSTI ART have significant increases in body weight and body mass index (BMI), with changes more pronounced in women [9–11]. However, these studies were limited by small sample sizes, predominately male populations, and the use of only absolute weight gain and BMI rather than other weight-related indicators that correlate with cardiometabolic risk [9–11].
Additional weight-related indicators are important in the evaluation of adiposity and weight changes. BMI is unable to differentiate between fat and fat-free mass, and may not accurately reflect body fat [12], while percentage body fat (PBF) is a more accurate measure of overall adipose tissue. Furthermore, BMI cannot detect nonuniform weight gain, such as central fat gain; this differentiation is important, given the association between central weight gain and metabolic syndrome, insulin resistance, and cardiovascular disease [13, 14]. Central body fat gain and increased visceral adiposity have been reported in association with contemporary ART [6, 15–17], further highlighting the importance of using additional body measurements in conjunction with BMI when assessing weight.
We compared changes in body weight, BMI, PBF, and body circumference measures (waist, hip, thigh, and arm) between WLHIV who switched to or added an INSTI to ART with women who remained on non-INSTI ART. We hypothesized that women switching to or adding an INSTI to ART (SWAD group) would have greater increases in weight gain, BMI, PBF, and body circumference measurements (BCMs), compared to women who remained on non-INSTI ART (STAY group).
METHODS
Study Population
We utilized data already collected from WLHIV in the previously described Women’s Interagency HIV Study (WIHS) [18, 19], the largest longitudinal cohort study of WLHIV and at-risk women without HIV in the United States. WIHS participants undergo study visits every 6 months, with clinical and medication history assessments through standardized, interviewer-administered surveys, physical examinations, and specimen collection, depending on the visit cycle. The 10 sites include: San Francisco, California; Los Angeles, California; Chicago, Illinois; Brooklyn, New York; Bronx, New York; Washington, DC; Chapel Hill, North Carolina; Miami, Florida; Birmingham, Alabama/Jackson, Mississippi (combined site); and Atlanta, Georgia.
All WLHIV enrolled in WIHS were assessed for eligibility (Figure 1). The criteria for SWAD included WLHIV: (1) with 5 consecutive WIHS visits who self-reported ART use and had HIV RNA levels <1000 copies/ml; 2) who switched from non-INSTI ART, which could have included a nucleoside reverse transcriptase inhibitor (NRTI) backbone plus either adding a non-nucleoside reverse transcriptase inhibitor (NNRTI), protease inhibitor (PI), or entry inhibitor to an INSTI or adding an INSTI to ART; and 3) remained on same INSTI drug for 2 study visits following the switch/addition. Women who started INSTI-based regimens when ART naive were excluded to eliminate the possibility of a “return to health” weight gain. Criteria for the control (STAY) group included WLHIV with 5 consecutive visits who self-reported ART use, had HIV RNA levels <1000 copies/ml, and remained on an NRTI backbone, NNRTI, PI, and/or entry inhibitors. We chose <1000 copies/mL as a cut-off for inclusion to identify women who were adherent to ART for the duration of follow-up yet allow for transient low-level viremia [20, 21], similar to a previous clinical cohort analysis [10]. Visits from pregnant women were excluded from both groups, due to fluctuations in outcome variables associated with pregnancy. The study visit in which INSTI use was first reported was considered the switch/add visit. The analysis included 5 consecutive visits: 2 visits immediately preceding the switch/add visit (preswitch/add), the switch/add visit, and 2 visits immediately after the switch/add visit (postswitch/add). STAY and SWAD study visits reflected similar time periods, with a median year of 2014 (range 2006–2015) for both groups.
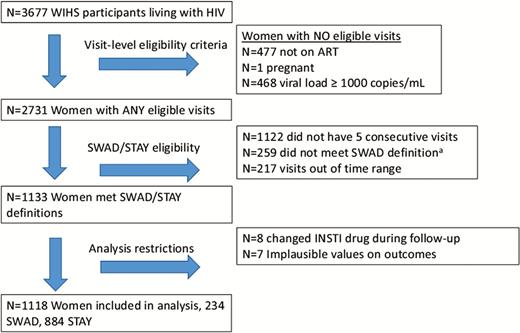
Study schema. a259 switched to or added an integrase strand transfer inhibitor (INSTI) but did not have 3 postswitch visits with consecutive INSTI use. Abbreviations: ART, antiretroviral therapy; HIV, human immunodeficiency virus; STAY, women who remained on non-INSTI ART during follow-up; SWAD, women who switched to or added an INSTI to ART; WIHS, Women’s Interagency HIV Study.
All study participants provided written informed consent. The WIHS study protocol was approved by Institutional Review Boards at all participating sites. This analysis was reviewed and approved by the WIHS Executive Committee; only de-identified data were used.
Data Collection
Data collected from WIHS visits occurring from 2006 to 2017 were used, since INSTIs were first approved for HIV treatment by the Food and Drug Administration in 2007. During visits, outcome variables were measured in a standard method by trained staff and included participants’ body weight (kilogram, kg), height (meters, m), BMI (calculated as weight/height2), PBF (%), and BCMs (cm). PBF was calculated using a bioelectrical impedance analysis (BIA): [(BF/ weight_kg)*100] = (%). BIA is a noninvasive, highly reproducible, and inexpensive bedside method of evaluation of PBF [22, 23] that is more accessible than either total body dual-energy x-ray absorptiometry or abdominal computed tomography, both of which require experienced technicians [22]. BIA was measured using standard procedures [22]. Each BCM was taken at least twice, and a third measure was taken if there was a >0.7 cm difference between the first 2 measurements; values were averaged for each visit. Self-reported data on ART use were obtained at each visit.
Statistical Analysis
Baseline demographic and clinical characteristics for the SWAD and STAY groups were compared using Chi square or Fisher’s exact tests for categorical variables and 2-sample t-tests or Wilcoxon rank sum tests for continuous variables.
Primary outcomes included changes in body weight, BMI, PBF, and BCMs. A change was defined as the difference in the preswitch/add visit outcome and the postswitch/add visit outcome (post-pre), or comparable visits in the control group. For time-varying variables, preswitch/add or comparable values were calculated as a mean of Visits 1 and 2, and were subsequently referred to as the baseline values. Similarly, time-varying variables were averaged for postswitch/add visits (Visits 4 and 5). Data from 7 participants were excluded because extreme changes in outcome variables suggested inaccurate data. Separate linear regression models compared changes over time (post-pre) in each outcome by STAY/SWAD group. We additionally performed separate linear regression analyses for the body weight outcome, stratified by the following selected baseline clinical characteristics: age (<50 or ≥50 years), self-reported race/ethnicity (White/other, non-Hispanic; Black, non-Hispanic; or Hispanic), BMI (<30 or ≥30 kg/m2), HIV viral load (below limit of detection or detectable), CD4 cell count (<350 or ≥350 cells/mm3), preswitch/add ART regimen (NNRTI or PI), and, only for the SWAD group, INSTI type (dolutegravir, raltegravir, or elvitegravir). The HIV viral load assay limit of detection changed during follow-up (see Table 3 footnote.) All models were adjusted for baseline age, race, WIHS site, education, income, smoking status, and ART regimen anchor drug (NNRTI vs PI). Fit was assessed through residual plots. Analyses were performed using SAS software, version 9.4 (SAS Institute, Cary, NC).
Model-Adjusted Changes Over Time in Weight, Stratified by Clinical Characteristics
| Clinical Characteristica | Mean (95% CI) Change in Weight in SWAD,b kg | Mean (95% CI) Change in Weight in STAY,b kg | Difference Between Means, SWAD-STAY (95% CI)b |
|---|---|---|---|
| Baseline age, years | |||
| Age <50, n = 595 | 2.4 (1.1–3.7) | 0.7 (−.2 to 1.5) | 1.7 (.3–3.1)* |
| Age ≥50, n = 523 | 2.3 (1.0–3.5) | −0.3 (−1.1 to .6) | 2.5(1.3–3.8)*** |
| Race/ethnicity | |||
| White/other, non-Hispanic, n = 172 | 1.8 (−.1 to 3.7) | 0.2 (−1.1 to 1.5) | 1.6 (−.6 to 3.7) |
| Black, non-Hispanic, n = 680 | 3.0 (1.8–4.2) | 0.6 (−.7 to 1.3) | 2.4 (1.1–3.7)*** |
| Hispanic, n = 266 | 1.8 (.1–3.5) | −0.6 (−2.0 to .7) | 2.4 (.7–4.1)** |
| Baseline BMI,b kg/m2 | |||
| BMI <30, n = 584 | 2.7 (1.8–3.7) | 0.4 (−.2 to 1.1) | 2.3 (1.3–3.3)**** |
| BMI ≥30, n = 507 | 2.1 (.5–3.8) | 0.4 (−.7 to 1.5) | 1.7 (.1–3.4)* |
| Baseline viral load,c copies/ml | |||
| Detectable, n = 208 | 1.0 (−1.1 to 3.0) | 0.3 (−1.3 to 2.0) | 0.6 (−1.5 to 2.7) |
| Undetectable, n = 910 | 2.7 (1.7–3.8) | 0.1 (−.5 to .8) | 2.6 (1.5–3.6)**** |
| Baseline CD4, cells/mm3 | |||
| CD4 <350, n = 153 | 1.6 (−1.1 to 4.4) | −0.1 (−1.7 to 1.5) | 1.7 (−1.1 to 4.6) |
| CD4 ≥350, n = 957 | 2.4 (1.5–3.4) | 0.3 (−.3 to .9) | 2.1 (1.1–3.1)**** |
| Baseline ART regimend | |||
| NNRTI, n = 526 | 3.1 (1.4–4.8) | 0.5 (−.4 to 1.3) | 2.7 (1.0–4.3)** |
| PI, n = 543 | 2.1 (1.0–3.2) | 0.04 (−.8 to .9) | 2.1 (.9–3.3)*** |
| INSTI type, SWAD group only | |||
| Dolutegravir, n = 97 | 1.7 (−.3 to 3.7) | … | … |
| Raltegravir, n = 85 | 1.3 (−2.0 to 4.5) | … | … |
| Elvitegravir, n = 52 | 2.7 (−.7 to 6.1) | … | … |
*P < .05, **P < .01, ***P < .001, ****P < .0001.Abbreviations: ART, antiretroviral therapy; BMI, body mass index; CI, confidence interval; INSTI, integrase strand transfer inhibitor; NNRTI, non-nucleotide reverse transcriptase inhibitor; PI, protease inhibitor; STAY, women who remained on non-INSTI ART during follow-up; SWAD, women who switched to or added an INSTI to ART.
a Clinical characteristics from the first visit were included during the follow-up period.
b From models adjusted for age (except age-stratified models), site, race/ethnicity (expect race/ethnicity-stratified models), income, smoking status, education, and baseline ART (except regimen-stratified models).
c The limits of detection for viral load assays were ≤80 copies/mL for 70 participants (8%), ≤48 copies/mL for 187 (21%), and ≤20 copies/mL for 653 (72%). Those with detectable viral loads were above the limit of detection but had <1000 copies/mL.
d Categories are mutually exclusive; women who received both an NNRTI and PI at baseline were not included in either group.
RESULTS
Participant Demographic and Clinical Characteristics
This study included 1118 WIHS participants (234 SWAD and 884 STAY) with a mean of 2.0 years (standard deviation [SD] 0.1) of follow-up time (Figure 1). The majority of women self-identified as African American (non-Hispanic; 61%), reported having a high school education or less (67%), had an annual income below $12 000 (51%), and reported current health insurance (97%; Table 1). The mean age was 49 years (SD 8.8) and the mean CD4 count was 669 cells/mm3 (SD 294).
Baseline Demographic and Clinical Characteristics
| Variable, n (%), mean (SD), or median (Q1, Q3) | Cohort, n = 1118 | SWAD, n = 234 | STAY, n = 884 | P Valuea |
|---|---|---|---|---|
| Age, years | 48.8 (8.8) | 49.8 (8.9) | 48.6 (8.7) | .06 |
| Race/ethnicity | … | … | … | .09 |
| African American (non-Hispanic) | 680 (60.8) | 140 (59.8) | 540 (61.1) | … |
| White & Other | 172 (15.4) | 46 (19.7) | 126 (14.3) | |
| Hispanic | 266 (23.8) | 48 (20.5) | 218 (24.7) | |
| Education ≤ high school | 741 (66.6) | 146 (62.7) | 595 (67.7) | .15 |
| Income ≤$12 000/year | 555 (51.2) | 114 (49.4) | 441 (51.6) | .54 |
| Has health insurance | 1079 (97.0) | 228 (97.9) | 851 (96.8) | .41 |
| Alcohol consumption, n = 1110 | … | … | … | .56 |
| Abstainer | 706 (63.6) | 149 (64.2) | 557 (63.4) | |
| 0–7 drinks/week | 324 (29.2) | 70 (30.2) | 254 (28.9) | |
| >7 drinks/week | 80 (7.2) | 13 (5.6) | 67 (7.6) | |
| Current smoker | 382 (34.4) | 68 (29.3) | 314 (35.8) | .07 |
| Time since ART initiation, years | 10.9 (5.8, 14.2) | 11.5 (6.2, 14.7) | 10.8 (5.6, 14.1) | .9 |
| Mean CD4 count, cells/mm3 | 669 (294) | 688 (295) | 664 (294) | .27 |
| Baseline viral load <200 copies/ml | 1068 (95.5) | 218 (93.2) | 850 (96.2) | .05 |
| Baseline ART regimen contains | ||||
| Non-nucleoside reverse transcriptase inhibitor | 555 (49.6) | 83 (35.5) | 472 (53.4) | <.0001 |
| Protease inhibitor | 572 (51.2) | 161 (68.8) | 411 (46.5) | <.0001 |
| Abacavir | 215 (19.2) | 64 (27.4) | 151 (17.1) | .0004 |
| Tenofovir disoproxyl fumarate | 864 (77.3) | 152 (65.0) | 712 (80.5) | <.0001 |
Bolded values in Table 1 signify statistical significance at P <.05. Age, mean CD4 count, and baseline viral load are reported as mean (SD); race/ethnicity, education, income, health insurance, alcohol consumption, current smoker, baseline ART regimen are reported as n (%); and time since ART initiation is median, Q1, Q3.
Abbreviations: Abbreviations: ART, antiretroviral therapy; INSTI, integrase strand transfer inhibitor; Q1, first quartile; Q3, third quartile; SD, standard deviation; STAY, women who remained on non-INSTI ART during follow-up; SWAD, women who switched to or added an INSTI to ART.
aThe statistical comparison between STAY and SWAD groups was conducted using Chi square tests for categorical variables and 2-sided, 2-sample t-tests for continuous variables.
There were no significant differences between SWAD and STAY groups with regard to baseline sociodemographic characteristics, CD4 cell counts, HIV viral loads, weights, or body measurements. However, compared to the STAY group at baseline, SWAD women were more likely to be on a PI-based regimen (69% vs 47%; P < .0001) and to receive abacavir (27% vs 17%; P = .0004), but were less likely to receive tenofovir disoproxyl fumarate (TDF; 65% vs 81%; P < .0001; Table 1). Among STAY women, 97% (857) had no change to their anchor drug class during follow-up, while 3% (22) switched to/added either an NNRTI or a PI. Among SWAD women, 42% (97) switched to/added dolutegravir, 23% (52) switched to/added elvitegravir, and 36% (85) switched to/added raltegravir. In the SWAD group, 15% (36) added abacavir, 8% (18) added TDF, and 12% (29) added tenofovir alafenamide; in the STAY group, 1.1% (10) added abacavir, 1.7% (15) added TDF, and 8.7% (77) added tenofovir alafenamide.
Change in Body Weight and Body Mass Index
The SWAD group experienced a mean increase in body weight of 2.4 kg (95% confidence interval [CI] 1.5–3.3), versus an increase of 0.2 kg (95% CI −0.4 to 0.8) in STAY. The SWAD group experienced a 2.1 kg greater estimated increase in weight over time, compared to the STAY group (P < .0001; Table 2). Further characterizing the change in weight, in the SWAD group, 34% (78) experienced body weight loss or no change in weight, 44% (102) had a <7% increase in weight, and 22% (52) had a ≥7% increase in weight (considered a clinically significant, treatment-induced effect) [24–26]. In the STAY group, 49% (423) had weight loss or no change in weight, 37% (326) had a <7% increase in weight, and 14% (124) had a ≥7% increase in weight (P < .0001).
Outcome Variables at Baseline and Model-Adjusted Changes Over Time
| Outcome Variable | Baseline Mean (SD) in SWAD | Baseline Mean (SD) in STAY | Mean (95% CI) Change in SWADa | Mean (95% CI) Change in STAYa | Difference Between Means, SWAD-STAY (95% CI)a |
|---|---|---|---|---|---|
| Weight, kg | 80.2 (25.7) | 80.8 (23.0) | 2.4 (1.5–3.3) | 0.2 (−.4 to .8) | 2.1 (1.2–3.1)*** |
| BMI, kg/m2 | 30.6 (8.9) | 30.9 (8.2) | 0.9 (.5–1.2) | 0.1 (−.1 to .3) | 0.8 (.4–1.1)*** |
| Body fat (%)b | 33.9 (11.5) | 35.0 (11.6) | 1.7 (.9–2.5) | 0.3 (−.2 to .9) | 1.4 (.5–2.2)* |
| Body circumference measurements, cm | |||||
| Waist | 99.2 (17.1) | 99.6 (16.2) | 2.4 (1.5–3.4) | 0.4 (−.2 to 1.0) | 2.0 (1.0–3.0)*** |
| Hip | 104.5 (15.5) | 106.3 (14.9) | 1.4 (.6–2.3) | −0.4 (−1.0 to .1) | 1.9 (1.0–2.7)*** |
| Arm | 32.8 (6.6) | 33.0 (6.4) | 0.7 (.4–1.0) | 0.1 (−.1 to .3) | 0.6 (.2–.9)** |
| Thigh | 53.1 (10.6) | 54.1 (9.9) | 0.9 (.3–1.4) | −0.1, (−.5 to .2) | 1.0 (.4–1.6)* |
| Waist to hip ratio | 0.95 (0.09) | 0.94 (0.08) | 0.011 (.003–.019) | 0.009 (.004–.014) | 0.002 (−.006 to .010) |
*P < .01, **P < .001, ***P < .0001.Abbreviations: ART, antiretroviral therapy; BMI, body mass index; CI, confidence interval; INSTI, integrase strand transfer inhibitor; SD, standard deviation; STAY, women who remained on non-INSTI ART during follow-up; SWAD, women who switched to or added an INSTI to ART.
aFrom models adjusted for age, site, race/ethnicity, income, smoking status, education, and baseline ART.
bUsing a bioelectrical impedance analysis: [(body fat/weight_kg)*100] = (%).
During follow-up, the SWAD group had an estimated mean change in BMI of 0.9 kg/m2 (95% CI 0.5–1.2), versus a change of 0.1 kg/m2 (95% CI −0.1 to 0.3) in the STAY group. The SWAD women experienced a 0.8 kg/m2 greater estimated increase in BMI over time, compared to the STAY women (P < .001; Table 2).
Change in Percentage Body Fat and Body Circumference Measurements
The SWAD group had an estimated mean change in PBF of 1.7% (95% CI 0.9–2.5), versus a change of 0.3% (95% CI −0.02 to 0.9) in the STAY group. The SWAD women experienced a 1.4% greater estimated increase in PBF over time, compared to the STAY women (P < .01; Table 2).
The SWAD group had 2.0 cm (P < .0001), 1.9 cm (P < .0001), 0.6 cm (P < .001), and 1.0 cm (P < .01) greater estimated increases over time in waist, hip, arm, and thigh circumferences, respectively, compared to the STAY group (Table 2). There was no difference in the waist-to-hip ratio changes between groups.
Subgroup Analyses for Weight Outcome
Given the observed greater increases in both anthropometric and body composition adiposity outcomes for the SWAD group, compared to the STAY group, we analyzed changes in body weight during follow-up in both the SWAD and STAY groups after stratification by baseline clinical characteristics (Table 3). In the SWAD group, women of minority races/ethnicities, CD4+ lymphocyte counts ≥350, and undetectable HIV viral loads experienced significantly greater increases in weight during follow-up than women in the STAY group. In addition, there was greater magnitude in weight gain for women in the SWAD group who were ≥50 years and had a BMI <30 kg/m2, compared to women in the STAY group (Table 3). When the SWAD women were stratified by INSTI drug, trends for weight gain for each drug were similar to those observed overall.
DISCUSSION
In this longitudinal study of WLHIV on ART, a switch to or addition of an INSTI to suppressive ART was associated with significant increases in body weight, body mass index, percentage body fat, and body circumference measurements, compared to measurements in women remaining on non-INSTI ART. Among women on INSTIs, nearly one-fifth experienced clinically significant body weight increases. To our knowledge, this is among the largest studies evaluating changes in adiposity, measured using both anthropometry and body composition following INSTI use, and the only study conducted specifically in women. This analysis, demonstrating pronounced increases in weight and body measurements after INSTI use among a large sample of geographically diverse US WLHIV, addresses an important gap in the literature. Moreover, women, who comprise the majority of individuals living with HIV worldwide [27], may be at particular risks for both obesity and INSTI-associated weight gain.
Previous studies have reported associations between INSTI use and weight gain and have suggested sex differences, with effects being more pronounced in women. Menard et al [9] observed a mean weight gain of 3 kg after an average of 276 days of follow-up in 462 patients (35% women) receiving dolutegravir-based ART; increases in weight were only statistically significant for women, and were more pronounced for women receiving dolutegravir/abacavir/lamivudine. This analysis was limited by the lack of a comparison group not receiving INSTIs. Norwood et al [10] examined 495 patients (~15% women) from a single center in the Southeastern United States who either remained on efavirenz/TDF/emtricitabine or switched to an INSTI- or PI-based ART regimen. The INSTI group had a mean increase in weight of 2.9 kg, compared to an increase of 0.9 kg in those who did not switch and an increase of 0.7 kg in the PI group; those who switched to dolutegravir/abacavir/lamivudine experienced the greatest increases in weight [10]. Bourgi et al [11] found ART-naive individuals (~15% women) to have significantly greater weight gains on dolutegravir-based ART, compared to NNRTI or elvitegravir-based ART. Finally, Bhagwat et al [6] found that ART-naive participants in the raltegravir arm of a clinical trial demonstrated greater increases in waist circumference than those in the PI arms, with findings more pronounced in female and Black participants. Given these findings, this may indicate that INSTIs have differential effects in women. Our analysis, which examined women already receiving suppressive ART and included a non-INSTI comparison group, adds to this literature by emphasizing the association between INSTIs and weight gain in women. Moreover, this study investigated WLHIV with suppressed viral loads; therefore, we suspect the findings are the result of a class effect of INSTI-based treatment itself, rather than a return to a health phenomenon of weight gain in naive people initiating ART.
Adverse effects of weight gain and obesity, including increased risks and worsening of cardiovascular disease, hypertension, diabetes mellitus, stroke, and death [28], may be compounded for women. During midlife, women gain approximately 0.7 kg (1.5 pounds) per year, independent of initial body weight or race/ethnicity. This increase in body weight is believed to be multifactorial, potentially involving hormonal changes [29, 30] and may have been compounded by additional 2 kg weight gains seen within 18 months after INSTI use in our study. Given that INSTIs are first-line therapy in the United States and European nations, it is anticipated that more women will be started on or switched to INSTIs in the future. The public health implications of usual, aging-related weight gain, compounded by the potential of INSTI-associated weight gain, is critically important to recognize, as WLHIV are living longer with ART and as INSTI use increases globally.
Our analysis was strengthened by demonstrating congruent findings across multiple anthropometric and body composition adiposity measures, including body weight, BMI, PBF, and regional circumference measurements. The gains in both peripheral and central circumference measures suggest that this phenomenon differs from HIV-associated lipodystrophy syndromes, which usually manifest as peripheral lipoatrophy, central lipohypertrophy, or a combination of both. Importantly, this analysis suggests pronounced increases in waist circumference among women using INSTIs. Since central obesity is among the criteria for a metabolic syndrome diagnosis, increases in waist circumference after INSTI initiation may place WLHIV at greater risk for developing a metabolic syndrome [31–34].
In concordance with prior studies [6, 35, 36], we found that weight gain following a switch to INSTIs was more prominent in women of minority races/ethnicities and older ages. However, we saw no differences by INSTI drug type. While previous studies have evaluated only a single INSTI drug [6, 9, 10], our findings suggest weight gain may be a class effect of INSTIs. It is important to note that newer INSTIs (bictegravir and cabotegravir) were not included in this work. Mechanisms to explain INSTI-associated changes are unknown. A theory is that weight gain may be linked to higher INSTI drug exposure, as increased dolutegravir plasma drug levels have been associated with neuropsychiatric effects [37]. Hormone-mediated effects leading to weight gain have been explored in medication classes, such as antipsychotics [38], but similar mechanisms have not been explored for INSTIs. Another explanation is an improved appetite and increased caloric intake secondary to decreased gastrointestinal discomfort with INSTIs, or increased viral suppression with INSTIs. Further research is needed in this area to identify the individual-level factors predictive of INSTI-associated weight gain.
Our study had several limitations. First, we included up to 18 months of follow-up after the switch to or addition of INSTI, limiting our ability to characterize longer-term consequences of INSTI use on weight. We intentionally selected a shorter follow-up period to isolate the effect of the INSTI and avoid potential confounders, such as aging or the addition of non-HIV medications. Future studies are in progress to characterize the long-term impacts of INSTI use. Second, our STAY and SWAD groups were different in terms of baseline ART regimens, with SWAD women more likely to have been on PIs and abacavir. While data on reasons for switching to INSTIs were not collected, we suspect that women on PIs and/or abacavir may have switched to INSTI regimens to reduce the pill burden. Third, our findings cannot be generalized to men or younger women living with HIV. Analyses comparing large cohorts of men and women are needed to investigate sex differences in the effects of INSTIs on adiposity measures. We did not report the association between INSTI use and other clinical outcomes (ie, blood pressure and glycemic control); these analyses are ongoing. Finally, though we observed a consistent association between INSTI use and weight-related outcomes when adjusting for potential confounders, unmeasured confounders could have affected our results (ie, those that may have affected regimen choice), and the relationships may not be causal. The inclusion of weight outcomes in future randomized, controlled trials of INSTIs is warranted.
In conclusion, a switch to or addition of INSTIs to HIV medication regimens was associated with significant increases in body weight, BMI, PBF, and regional body circumference measurements among WLHIV, compared to those remaining on non-INSTI ART. INSTIs have otherwise revolutionized HIV treatment. However, these observed increases in adiposity over a short follow-up period are concerning, as they may be indicators of an underappreciated health impact of increasing INSTI use among individuals living with HIV, particularly in women, and this may have an important effect on the future acceptability of INSTI-based regimens. Given the long-term impact of obesity on risks of cardiovascular disease and death [39, 40], further research is urgently needed to determine the risk factors, cardiometabolic effects, and mechanisms of INSTI-associated weight gain seen in our study.
Supplementary Data
Supplementary materials are available at Clinical Infectious Diseases online. Consisting of data provided by the authors to benefit the reader, the posted materials are not copyedited and are the sole responsibility of the authors, so questions or comments should be addressed to the corresponding author.
Notes
Author contributions. C. D. L. and A. N. S. conceived and designed the experiments. C. C. M., C. D. A., A. M. K., C. D. L., A. N. S. and N. A. S. analyzed the data. C. C. M., C. D. A., C. D. L., A. M. K., A. N. S. and N. A. S. contributed reagents, materials, and analysis tools. A. M. K., C. D. L., A. N. S., C. C. M., C. D. A., and N. A. S. wrote the abstract and paper. C. D. L., A. N. S., C. C. M., C. D. A., N. A. S., I. O., S. D. W., D. G., A. S., A. A. A., A. L. F., M. A., J. C., S. K., and H. B. contributed feedback to the abstract and paper. Data in this manuscript were collected by the Women’s Interagency Human Immunodeficiency Virus Study (WIHS). The WIHS branches (and principal investigators) are University of Alabama at Birmingham-University of Mississippi combined site (UAB-MS) WIHS (Mirjam-Colette Kempf and Deborah Konkle-Parker); Atlanta WIHS (Ighovwerha Ofotokun, Anandi Sheth, and Gina Wingood); Bronx WIHS (Kathryn Anastos and Anjali Sharma); Brooklyn WIHS (Deborah Gustafson and Tracey Wilson); Chicago WIHS (Mardge Cohen and Audrey French); Metropolitan Washington WIHS (Seble Kassaye and Daniel Merenstein); Miami WIHS (Maria Alcaide, Margaret Fischl, and Deborah Jones); University of North Carolina WIHS (Adaora Adimora); Connie Wofsy Women’s Human Immunodeficiency Virus Study, Northern California (Bradley Aouizerat and Phyllis Tien); WIHS Data Management and Analysis Center (Stephen Gange and Elizabeth Golub); and Southern California WIHS (Joel Milam).
Acknowledgments. The authors thank the Women’s Interagency Human Immunodeficiency Virus Study (WIHS) participants who contributed time and data to this study; the WIHS for their support and data utilization; and the WIHS site coinvestigators who assisted with feedback in preparation of the abstract, as well as served as site liaisons for data collaboration.
Disclaimer. The contents of this publication are solely the responsibility of the authors and do not represent the official views of the National Institutes of Health.
Financial support. This work was supported by the Women’s Interagency Human Immunodeficiency Virus Study (WIHS), via the UAB-MS WIHS (grant number U01-AI-103401), Atlanta WIHS (grant number U01-AI-103408), Bronx WIHS (grant number U01-AI-035004), Brooklyn WIHS (grant number U01-AI-031834), Chicago WIHS (grant number U01-AI-034993), Metropolitan Washington WIHS (grant number U01-AI-034994), Miami WIHS (grant number U01-AI-103397), University of North Carolina WIHS (grant number U01-AI-103390), Connie Wofsy Women’s Human Immunodeficiency Virus Study, Northern California (grant number U01-AI-034989) WIHS Data Management and Analysis Center (grant number U01-AI-042590), Southern California WIHS (grant number U01-HD-032632; WIHS I – WIHS IV), University of California at San Francisco Clinical and Translational Science Award (CTSA) (grant number UL1-TR000004), Atlanta CTSA (grant number UL1-TR000454), University of North Carolina Center for AIDS Research (CFAR) (grant number P30-AI-050410), and UAB CFAR (grant number P30-AI-027767). The WIHS is funded primarily by the National Institute of Allergy and Infectious Diseases, with additional funding from the Eunice Kennedy Shriver National Institute of Child Health and Human Development, the National Cancer Institute, the National Institute on Drug Abuse, and the National Institute on Mental Health. Targeted supplemental funding for specific projects is also provided by the National Institute of Dental and Craniofacial Research, the National Institute on Alcohol Abuse and Alcoholism, the National Institute on Deafness and Other Communication Disorders, and the National Institutes of Health Office of Research on Women’s Health. This work was also supported by grant number K23 AI114407 to A. N. S. funded by the NIH, National Institute of Allergy and Infectious Diseases (NIAID); grant number K23 AI124913 funded by the NIH, NIAID to C. D. L.; grant number K23 AR061993 to A. S. funded by NIH/National Institute of Arthritis and Musculoskeletal and Skin Diseases (NIAMS); grant numbers UL1 TR002378 and TL1 TR002382 to N. A. S. funded by NIH/National Center for Advancing Translational Science (NCATS); grant number R01 MH095683 to S. D. W. funded by NIH/National Institute of Mental Health (NIMH); and Emory CFAR (grant number P30AI050409).
Potential conflicts of interest. A. N. S. received grant funding from Gilead. N. A. S. received grant funding from the National Center for Advancing Translational Sciences of the National Institutes of Health. A. A. A. received personal fees from Merck, Gilead, and Viiv and grants from Gilead. H. B. received grants from Glaxo Smith Klein. All other authors report no potential conflicts. All authors have submitted the ICMJE Form for Disclosure of Potential Conflicts of Interest. Conflicts that the editors consider relevant to the content of the manuscript have been disclosed.
References
Author notes
Present affiliation: University of Texas Southwestern School of Medicine Dallas.

