


Abstract
Interferon-γ (IFN-γ) plays an important role in the control of Leishmania infection. Blockade of IFN-γ signaling in mice increases lesion size and parasite load. In endemic areas of Leishmaniasis, only a fraction of the population develop the disease. This suggest that host genetics may play a role in this response. We investigated whether single nucleotide polymorphisms (SNPs) in IFNG may be associated with elevated or decrease risk in the development of cutaneous leishmaniasis (CL).
We assessed 9 SNP and cytosine-adenine (CA) repeats in IFNG by nucleotide sequencing in 647 patients with CL caused by Leishmania guyanensis and 629 controls. Circulating plasma IFN-γ levels were also assayed in 400 patients with CL and 400 controls.
The rs2069705TT genotype is associated with elevated risk of developing CL compared with the rs2069705CC genotype (OR, 1.7; 95% CI, 1.3–2.4; P = .0008). There is a 70% chance that this genotype raises the risk of developing CL. In a dominant model, carriers of the rs2069705T allele compared with the rs2069705CC genotype showed a 50% (range, 20–100%) increased risk of developing CL (OR, 1.5; 95% CI, 1.2–2.0; P = .0004). Haplotype analysis showed 1 haplotype (H1) associated with low levels of IFN-γ presented an increased risk of 60% of developing CL (OR, 1.6; 95% CI, 1.3–1.9; P = 5 × 10⁻⁵) compared with non-H1.
IFNG variant rs2069705 seems to be a genetic modifier of clinical outcome of Leishmania infection; individuals with the H1 haplotype, associated with low levels of IFN-γ, have a 60% risk of developing CL.
(.)
Leishmaniasis affects more than 12 million people worldwide and remains a major health problem in the tropical and subtropical regions of Asia, the Middle East, sub-Saharan Africa, and South America [1]. Leishmania is transmitted by sand flies and displays a wide spectrum of clinical manifestations in humans, ranging from asymptomatic, spontaneously healing skin lesions, to more chronic cutaneous leishmaniasis (CL) or mucocutaneous lesions. Leishmania also causes the life-threatening visceral leishmaniasis (VL), which can be fatal in the absence of treatment or at a rate of 5–15% even with treatment.
Interferon-γ (IFN-γ) plays an important role in the control of Leishmania infection. Blockade of IFN-γ signaling in mice increases lesion size and parasite load [2]. IFNG knockout mice are susceptible to Leishmania major, Leishmania donovani, and Leishmania braziliensis infections [2–4]. In human, circulating levels of IFN-γ are higher in asymptomatic and cured subjects than in patients with active VL [5]. An intralesional cytokine study of biopsy specimens from patients with CL caused by Leishmania guyanensis infection distinguished patients into 3 categories: Patients with a predominance of T-helper (Th) 2 cytokines (interleukin [IL]-4 and IL-13) developed lesions earlier than patients with a predominance of Th1 cytokines, while patients with similar Th1 and Th2 cytokines showed lesions intermediate to Th1 and Th2 patients [6]. In patients infected with L. braziliensis, high expressions of IFN-γ and IL-10 are observed in late lesions compared with earlier lesions [7]. Optimal levels of tumor necrosis factor (TNF) ɑ and IFN-γ are cited to control the parasite and lesions healing while high levels IFN-γ are correlated with the severe forms of leishmaniasis [7–9].
In areas of endemic Leishmaniasis, only a proportion of individuals exposed to the Leishmania-carrying Phlebotomine sand flies develop disease, demonstrating that the host genetic background plays an important role in the clinical manifestation of the disease. Furthermore, the clinical outcome of Leishmaniasis also depends on other factors, the Phlebotomine vector, Leishmania spp, the environment, and the host immune response.
Genetic polymorphisms present in IFNG are suggested to influence levels of the cytokine [10, 11]. The gene is located on chromosome 12q14.1. Several polymorphisms in IFNG seem to correlate with levels of the cytokine. The following single nucleotide polymorphisms (SNPs)—+874 A/T (rs2430561), +1987 A/G (rs1861494), +3234 C/T (rs2069718), and the microsatellite cytosine-adenine (CA) repeats +875 CA(n) (rs35314021)—are suggested to influence the transcription of IFNG [10–13].
In light of the importance of IFN-γ in the clinical outcome for Leishmania infection, we investigated 9 SNPs and a CA repeat spanning over 7 kb of the IFNG gene (Figure 1A) to search for genotypes associated with development of CL caused by L. guyanensis.
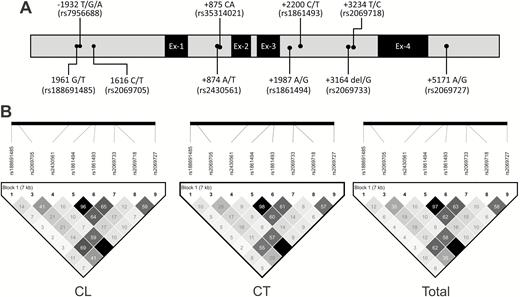
The distribution of polymorphisms and position in the IFNG gene (A) and linkage disequilibrium structure among the different polymorphisms of the IFNG gene (B). Abbreviations: CL, cutaneous leishmaniasis; CT, control; IFNG, interferon-γ.
METHODS
Study Population
This case-control study consisted of 647 patients with CL and 629 control subjects. The study was conducted in the peri-rural areas of Manaus, the capital city of the Amazonas state where L. guyanensis is endemic. The patients with CL were followed at the Fundação de Medicina Tropical Doutor Heitor Vieira Dourado (FMT-HVD), the referral center for treatment of tropical diseases. The healthy controls with no history of CL and devoid of any scars suggestive of CL were from the same endemic areas and shared environments similar to the patients with CL. Most of the participants are agricultural or farming workers. All of the participants in the study provided written inform consent. The study was approved by the Research Ethics Committee of the FMT-HVD and granted under the file number CAAE 09995212.0.0000.0005.
The study population had similar gender distribution. Of the 647 patients with CL, 480 (74.2%) were male (mean ± SD age: 34.82 ± 13.75 years) and 167 (25.8%) were female (37.99 ± 15.69 years), while in control subjects, 461 (73.2%) were male (42.78 ± 17.07 years) and 168 (26.8%) were female (41.74 ± 17.25 years). However, the mean age differed between the patients with CL (35.62 ± 14.32 years) and controls (42.50 ± 17.11 years); the population of control subjects was significantly older than the patient population (P < .0001).
Biological Material
Peripheral blood was collected by venipuncture into ethylenediaminetetraacetic acid (EDTA)–containing Vacutainer tubes (Becton Dickinson) for DNA extraction and cytokine assay. In all patients with CL, a biopsy of the lesion was performed for the identification of Leishmania species. The collection of plasma from patients and controls for cytokine analysis was from January 2013 to March 2016.
Identification of Leishmania species
The diagnosis of CL was performed by direct microscope examination of Giemsa-stained specimens for the presence of Leishmania parasites from lesion scars. DNA was prepared from lesion biopsy specimens of all patients with CL. Leishmania vianna–specific polymerase chain reaction (PCR) with discrimination between L. braziliensis and L. guyanensis was performed as elsewhere [14, 15], and by nucleotide sequencing of a fragment of the HSP70 and miniexon genes.
DNA Purification and Polymerase Chain Reaction of IFNG
The genomic DNA was extracted by the proteinase K and the salting-out method. Different fragments of the IFNG gene were amplified by PCR. The primers and size of amplified products are shown in Supplementary Table 1. The positions of the primers were according to the IFNG reference gene sequence (GenBank ID: NG_015840). The PCR conditions were as follows: 0.4 μM of each primer, 0.2 μM of each deoxyribonucleotides, 1.5 mM of MgCl2, 1 U of Taq polymerase, and 50 ng of DNA in a final volume of 25 μL containing 500 mmol/L KCl and 100 mmol/L Tris-HCl of the Taq polymerase buffer. Polymerase chain reaction purification was performed with 20% polyethylene glycol as described previously [16, 17].
Single Nucleotide Polymorphism Genotyping
Nucleotide sequencing was performed using the BigDye Terminator v3.1 Cycle Sequencing (Applied Biosystems) with the same primers used in the PCR reaction. For the nucleotide sequencing of the promoter region, internal primers were used—forward 5′-AATTCCTAGCACTTTATGAGG-3′ and reverse 5′-AGTCTTGCTCTGTCACCCA-3′—to have higher nucleotide sequencing coverage. The sequencing was performed using POP-7TM and ABI 3130XL DNA sequencers. Sequences were initially analyzed using the Sequencing Analysis software (Applied biosystem [Thermo Fisher Scientific, São Paulo, Brazil]); only the high-quality sequences were used for SNP analyses. Geneious software (Biomatters, v6.0.5) was used to obtain the contigs and compare with the IFNG reference sequence (GenBank ID: NG_015840).
Haplotype Analysis
The haplotype analysis was performed using the Haploview software (v.4.2) excluding the microsatellite alleles, to determine the haplotype frequencies and the linkage disequilibrium (LD). The degree of pairwise correlation between nucleotides was analyzed by LD structure, considering r2 values greater than 0.8 as strong while those less than 0.1 as being in negative LD. A second haplotype analysis was performed with the PHASE algorithm including the microsatellite alleles. In the PHASE, the SNPs were evaluated over 10 000 interactions to determine the haplotype of each individual.
IFN-γ Cytokine Levels
Plasma samples were kept frozen at −80oC until measurement of cytokine levels. The levels of IFN-γ were determined using the multiplex cytokine commercial kit Bio-PlexPro-Human Cytokine GrpI Panel 27-Plex (Bio-Rad) according to the manufacturer’s instructions in the Bio-Plex 200 Protein Array System (Luminex Corporation).
Statistical Analysis
The Mann–Whitney and χ 2 tests were used to compare age and sex among patients with CL and control subjects, respectively. The genotype and allele were determined by direct gene counting. Hardy-Weinberg equilibrium (HWE) was investigated by comparing the observed genotypes with those expected under HWE. Statistical analysis was performed using logistic regression analysis through the website http://ihg.gsf.de/cgi-bin/hw/hwa1.pl, and all P values were translated into the Shannon information [s-value = −log2(P)] to provide evidence against the null hypothesis. Comparison between groups used a 2-tailed χ 2 test. Comparisons of the effect of each SNP on IFN-γ levels were performed using SNP Assoc and the R software version 3.5.1 package ggplot 2.
RESULTS
IFNG Polymorphisms Are Associated With Cutaneous Leishmaniasis
The following IFNG genetic polymorphisms were evaluated in 647 patients with CL and 629 control subjects: rs188691485 G/T, rs7956688 T/G/A, rs2069705 C/T, rs2430561 A/T, rs35314021 CA, rs1861494 A/G, rs1861493 C/T, rs2069733 del/G, rs2069718 T/C, and rs2069727 A/G. All of the SNPs were in HWE in both groups (Table 1). The distribution of genotypes and alleles of the IFNG polymorphisms that differ between patients with CL and control subjects is shown in Table 1, while SNPs with similar distribution in both groups are shown in Supplementary Table 2.
Distribution of Genotypes and Alleles Frequencies of the Single Nucleotide Polymorphisms of IFNG Between Patients With Cutaneous Leishmaniasis and Control Subjects
| SNP | CL | Controls | Comparison | OR (95% CI) | P | s-Value [s = −log2 (P)] |
|---|---|---|---|---|---|---|
| rs2069705 | n = 630 | n = 615 | ||||
| C/C | 199 (31.6) | 254 (41.3) | TT vs CC | 1.7 (1.3–2.4) | .0008 | 10 |
| C/T | 303 (48.1) | 267 (43.4) | CT vs CC | 1.5 (1.1–1.9) | .0033 | 8 |
| T/T | 128 (20.3) | 94 (15.3) | TT+CT vs CC | 1.5 (1.2–2.0) | .0004 | 11 |
| C | 701 (55.6) | 775 (63.0) | T vs C | 1.4 (1.2–1.6) | .0002 | 12 |
| T | 559 (44.4) | 455 (37.0) | … | … | ||
| rs2430561 | n = 647 | n = 624 | ||||
| A/A | 324 (50.1) | 350 (56.1) | … | … | ||
| A/T | 265 (41.0) | 228 (36.5) | TT+AT vs AA | 1.3 (1.0–1.6) | .0317 | 5 |
| T/T | 58 (8.9) | 46 (7.4) | T vs A | 1.2 (1.0–1.2) | .0319 | 5 |
| A | 913 (70.6) | 928 (74.4) | … | … | ||
| T | 381 (29.4) | 320 (25.6) | … | … | ||
| rs1861494 | n = 626 | n = 616 | ||||
| A/A | 369 (58.9) | 365 (59.3) | … | … | ||
| A/G | 232 (37.1) | 211 (34.2) | AA+AG vs GG | 1.7 (1.0–2.8) | .0479 | 4 |
| G/G | 25 (4.0) | 40 (6.5) | AG vs GG | 1.8 (1.0–3.0) | 0.0362 | 5 |
| A | 970 (77.5) | 941 (76.4) | … | … | ||
| G | 282 (22.5) | 291 (23.6) | … | … | ||
| rs1861493 | n = 626 | n = 616 | ||||
| C/C | 25 (4.0) | 40 (6.5) | … | … | ||
| C/T | 225 (35.9) | 207 (33.6) | TT+CT vs CC | 1.7 (1.0–2.8) | .0479 | 4 |
| T/T | 376 (60.1) | 369 (59.9) | CT vs CC | 1.7 (1.0–3.0) | .0405 | 5 |
| C | 275 (22.0) | 287 (23.3) | … | … | ||
| T | 977 (78.0) | 945 (76.7) | … | … | ||
| rs2069718 | n = 626 | n = 616 | ||||
| T/T | 230 (36.7) | 270 (43.8) | … | … | ||
| T/C | 292 (46.7) | 262 (42.6) | TC vs TT | 1.3 (1.0–1.7) | .0296 | 5 |
| C/C | 104 (16.6) | 84 (13.6) | TT vs CC | 0.7 (0.5–0.9) | .0292 | 5 |
| T | 752 (60.1) | 802 (65.1) | C vs T | 1.2 (1.0–1.5) | .0095 | 7 |
| C | 500 (39.9) | 430 (34.9) | … | … |
Abbreviations: CI, confidence interval; CL, cutaneous leishmaniasis; IFNG, interferon-γ gene; OR, odds ratio; SNP, single nucleotide polymorphism.
The rs2069705 T/T genotype was higher in patients with CL (20.3%) compared with control subjects (15.3%). Individuals with the rs2069705 T/T genotype have a 70% increased risk of developing CL, with 95% confidence limits ranging from 30% to 140% when compared with individuals with rs2069705 C/C (odds ratio [OR], 1.7; 95% confidence interval [CI], 1.3–2.4; P = .0008; s-value = 10). In the dominant model, carriers of the rs2069705 T allele (T/T+C/T) when compared with the rs2069705C/C genotype revealed that carriers of the T allele have a 50% elevated risk of developing CL (OR, 1.5; 95% CI, 1.2–2.0; P = .0004; s-value = 11). Likewise, the rs2069705 T allele was predominant in patients with CL (44%) compared with controls (37%), suggesting an association with the development of CL (OR, 1.4; 95% CI, 1.2–1.6; P = .0002; s-value = 12). The rs1861494 A, rs1861493 T, and rs2069718 C alleles are associated with increased risk of CL development. The rs2069718T/T genotype was common among the control subjects (43.8%) compared with the patients with CL (36.7%). The rs2069718T/T genotype confers a 30% reduction in risk of developing of CL, with a 95% confidence limit ranging from 50% to 10% (OR, 0.7; 95% CI, 0.5–0.9; P = .0292).
The distribution of rs35314021 CA repeats differs among patients with CL and control subjects (Fisher’s exact = 29.917; P = .0270) (Supplementary Table 3). Seven alleles are present in the population, ranging from 11 to 17 CA repeats. The 13/13 genotype is associated with a 40% decreased risk of developing CL (OR, 0.6; 95% CI, 0.4–0.9; P = .0141), while the 12/13 genotype is associated with a 60% increased risk of developing CL (OR, 1.4; 95% CI, 1.1–1.8; P = .007).
Linkage Disequilibrium and Haplotypes of IFNG
Haploview haplotype analysis, excluding the CA repeats, revealed 9 haplotypes, denoted as H1 to H9 (Table 2). Linkage disequilibrium is observed among the SNPs located in intron-3: rs1861494, rs1861493, and rs2069733. The intron-3 rs2069718 showed LD with the SNPs rs2069705 situated in the promoter region and rs2430561 in intron-1. The SNPs rs2430561 and rs2069727 (3′-untranslated region [UTR]) are also in LD (Figure 1B).
Distribution of the IFNG Haplotypes in the Study Population
| N (frequency) | ||||||||||||||
|---|---|---|---|---|---|---|---|---|---|---|---|---|---|---|
| Hap. | −1961 | −1932 | −1616 | +874 | +1987 | +2200 | +3164 | +3234 | +5171 | CL | Control | χ 2 | P | s-Value [s = −log2(P)] |
| 1 | G | G | T | T | A | T | G | C | G | 322 (27.7) | 220 (19.6) | 20.532 | .00005 | 14 |
| 2 | G | G | C | A | A | T | G | T | A | 178 (15.3) | 185 (16.5) | 0.61 | .4348 | 1 |
| 3 | G | G | C | A | G | C | del | T | A | 173 (14.9) | 174 (15.6) | 0.218 | .6402 | 0.6 |
| 4 | T | G | C | A | A | T | G | T | A | 170 (14.6) | 171 (15.3) | 0.198 | .6565 | 0.6 |
| 5 | G | G | T | A | A | T | G | C | A | 121 (10.4) | 110 (9.8) | 0.234 | .6289 | 0.7 |
| 6 | G | G | C | A | G | C | G | T | A | 64 (5.5) | 81 (7.2) | 2.705 | .1001 | 3 |
| 7 | G | A | T | A | A | T | G | T | A | 67 (5.7) | 72 (6.5) | 0.528 | .4677 | 4 |
| 8 | G | G | C | T | A | T | G | C | G | 16 (1.4) | 41 (3.7) | 12.443 | .0004 | 11 |
| 9 | G | A | C | A | A | T | G | T | A | 20 (1.7) | 33 (2.9) | 3.529 | .0603 | 4 |
Haplotype 1 vs non–haplotype 1 (OR, 1.6; 95% CI, 1.3–1.9). Haplotype 8 vs non–haplotype 8 (OR, 0.4; 95% CI, 0.2–0.7). Abbreviations: CI, confidence interval; CL, cutaneous leishmaniasis; Hap., haplotype; IFNG, interferon-γ gene; OR, odds ratio.
The distribution of haplotypes differs between patients with CL and control subjects as shown in Table 2 (Fisher’s exact = 19.697; P = .0115). There was an excess of haplotype 1 (H1) G/G/T/T/A/T/G/C/G in patients with CL (27.7%) compared with controls (19.6%). There is a 70% chance that this haplotype may increase the risk of developing CL when compared with non-H1 carriers (OR, 1.7; 95% CI, 1.2–2.2; P = 5 × 10⁻⁵; s-value = 14). Individuals with H8 G/G/C/T/A/T/G/C/G have a 60% reduction in the risk of developing CL when compared with non-H8 (OR, 0.4; 95% CI, 0.2–0.8; P = 4 × 10⁻⁴).
Haplotype construction including the CA repeats by the PHASE algorithm as shown in Supplementary Table 4 revealed that the haplotype G/G/T/T/12/A/T/G/C/G is associated with the development of CL (P < .0001). The haplotypes G/G/C/A/13/G/C/G/T/A, G/A/T/A/14/A/T/G/T/A and G/G/C/T/12/A/T/G/C/G were prevalent among control subjects (Supplementary Table 4). Of note, the haplotype G/G/T/T/12/A/T/G/C/G is the same as H1 by Haploview and differs only with the inclusion of the CA repeats.
Comparison of IFN-γ Levels With Single Nucleotide Polymorphisms Associated With Cutaneous Leishmaniasis
Of the SNPs was associated with the development of CL, only rs2430561 (+874) segregated with circulating levels of IFN-γ adjusted for age and sex, both in patients with CL (Figure 2A) and total subjects (patients with CL + controls) (Figure 2C) but not in control subjects (Figure 2B). Higher IFN-γ levels among the total subjects segregated with the rs2430561A/A genotype (mean ± SEM: 21.50 ± 0.88 pg/mL) compared with the A/T genotype (mean ± SEM: 18.42 ± 0.87 pg/mL). In patients with CL, mean circulating IFN-γ levels were 26.5 ± 1.6 and 20.8 ± 1.5 pg/mL among the AA and AT genotypes, respectively. Notably, higher levels of IFN-γ (Mann–Whitney test, P < .0001) were observed among patients with CL (mean ± SEM: 28.7 ± 2.5 pg/mL) when compared with controls (mean ± SEM: 16.4 ± 0.59 pg/mL).


Distribution. of IFN-γ levels in patients with CL (A), control subjects (B), and total subjects (C) according to genotypes and haplotypes. Abbreviations: CL, cutaneous leishmaniasis; IFN-γ, interferon-γ
Analysis of the influence of the haplotypes on circulating IFN-γ levels revealed that subjects homozygous for H1 presented lower levels of IFN-γ in comparison to non-H1 individuals as depicted in Figure 2 (patients with CL, P = .02; controls, P = .026; and total, P = .012). Among individuals homozygous for H1, mean circulating levels were 19.57 ± 1.2, 14.62 ± 0.73, and 17.44 ± 0.76 pg/mL among patients with CL and control and total subjects, respectively. Among the non-H1 individuals, mean levels were 24.21 ± 1.3, 17.12 ± 0.67, and 20.35 ± 0.71 pg/mL in patients with CL and control and total subjects, respectively.
DISCUSSION
IFN-γ plays an important role in the activation of macrophages to produce reactive oxygen species and nitric oxide for the elimination of L. guyanensis during infection [18–21]. However, high levels of IFN-γ can also be detrimental in Leishmaniasis [7–9]. Low levels of IFN-γ were observed in biopsy specimens from lesions and peripheral blood mononuclear cells of patients with CL caused by L. guyanensis [22, 23]. Several studies demonstrated that the levels of IFN-γ are associated with genetic polymorphisms present in IFNG [10, 11]. The SNPs +874 A/T (rs2430561) and +875 CA(n) (rs35314021) are associated with levels of IFN-γ. The +874 T allele as well as the +875 12CA repeats have been shown to associate with high levels of IFN-γ [12, 13].
Different genetic association studies have focused mainly on the SNP IFNG rs2430561 A/T in protozoan infectious diseases, and controversial results have been reported. Several studies found no association of the rs2430561 A/T SNP in malaria [24–26], tegumentary Leishmaniasis, and VL [27–29]. In contrast, the rs2430561 A/T SNP has been associated with susceptibility to Trypanosoma cruzi infection [30] and with protection against L. major infection [31]. In this study, the rs2430561 T allele is associated with the development of CL.
In the Iranian population, the rs2430561 T/T genotype was prevalent among asymptomatic and subjects cured of L. major infection, and was associated with reduced risk of developing CL [31]. In a study with 78 patients from Rio de Janeiro, Brazil, with CL caused by L. braziliensis, the rs2430561 T/T genotype was prevalent among healthy controls and conferred a 33% reduced risk of developing CL, with a 95% confidence limit ranging from a 68% decrease to a 41% increase and a P value of 0.3 [27]. In contrast to these 2 studies, our data showed a higher frequency of the rs2430561 T/T genotype among patients with CL compared with control subjects and suggest that the rs2430561 T allele may be associated with the development of CL.
The rs2430561 A/A genotype correlated with low circulating levels of IFN-γ in patients with vivax malaria [32]. Another 2 studies in the Brazilian Amazon population reported that the rs2430561 A/A genotype is associated with higher levels of IFN-γ in patients with vivax malaria and leprosy [24, 33]. Our data also showed that higher IFN-γ levels were associated with rs2430561 A/A genotype when compared with the rs2430561 A/T genotype in patients with CL (Figure 2A).
Conflicting results were also observed with rs2069705 (−1616 C/T) in Plasmodium falciparum malaria. In the Indian population, no association was observed with this SNP [25], while in Saudi Arabia, the rs2069705 T/T genotype was associated with higher levels of IFN-γ and susceptibility to severe malaria [34]. In The Gambia, the rs2069705 C allele was associated with the development of severe malaria [35]. In this study, the rs2069705 T/T genotype was associated with the development of CL caused by L. guyanensis and carriers of the T/T genotype have a 70% increased risk of developing CL compared with those with the CC genotype. Furthermore, an s-value of 10 provided more evidence against a null hypothesis.
The SNP rs2069718 located in intron-3 is suggested to be an intronic enhancer (transcription factor II D [TFIID], hepatocyte nuclear factor 3 [HNF3] and glucocorticoid receptor beta [GR-β]), while the rs2069727 in the 3`UTR region is a binding site for 2 transcription factors (GR-β and XBP-1) [25]. The rs2069718 C allele was associated with the development of CL (OR, 1.2; 95% CI, 1.0–1.5; P = .0095) in this study. Interestingly, in the presence of the C variant, the binding site for TFIID, HNF3, and GR-β is abolished [25].
Different SNPs of IFNG were investigated in VL in Brazil. The SNPs rs2069727, rs2069718, rs2069716, and rs1861493 of IFNG showed a lack of association with VL caused by Leishmania infantum [29]. The rs1861493 T allele was associated with susceptibility to CL in our study. The rs2069718 C/C genotype has been reported to segregate with low levels of IFN-γ [10]. The rs2069718 C allele was associated with the development of CL in this study but was not associated with cytokine levels. The rs2069718 C allele confers an increased risk of 20% of developing CL with a 95% CI ranging from 0% to 50%. This large risk CI suggests that we need to increase our sample size to observe whether there is a compelling evidence for a nonzero effect.
The study of different SNPs of IFNG is important to reveal the degree of interaction among the SNPs of the IFNG locus. To our knowledge, there are few studies of this nature on infectious disease. In this study, 10 polymorphisms covering the whole gene were evaluated. Of the 5 SNPs that showed an association with the development of CL, only the SNP rs2069705 revealed compelling evidence for a nonzero effect as shown by its narrow CI and its s-value. Using the Haploview software excluding the repeat alleles, 9 haplotypes were revealed in our population, designated as H1 to H9. H1 (−1961G/–1932G/–1616T/+874T/+1987A/+2200T/+3164G/+3234C/+5171G) is associated with the development of CL. Interestingly, H1 is associated with low levels of IFN-γ. A plausible explanation of this association is that carriers of this haplotype seem to produce insufficient levels of IFN-γ, which is important for clearance of the parasite.
To keep in check the parasite Leishmania, the classical activation of macrophages by IFN-γ is necessary [36]. IFN-γ activates macrophages through the signal transducer and activator of transcription 1 to eliminate the phagocytosed parasites [37]. Activation of macrophages increased the expression of reactive oxygen species and nitric oxide in the phagolysosomes to create the respiratory burst for the elimination of intracellular parasites [38]. IFN-γ stimuli lead to the production of the inflammatory cytokines TNF and IL-1, chemokines, and major histocompatibility complex molecules for the presentation of antigens to lymphocyte T cells, hereby amplifying the immune response [39].
To the best of our knowledge, this is the first study showing a range of 10 polymorphisms covering the whole IFNG gene depicting one haplotype that is associated with the development of CL caused by L. guyanensis and low levels of IFN-γ. Carriers of this haplotype have a 60% increased risk of developing CL in endemic areas of L. guyanensis. The haplotypic structure seems to indicate a linkage with the regulation of the IFNG gene. Further studies in other endemic areas of Leishmaniasis will be of interest to confirm this association.
Supplementary Data
Supplementary materials are available at Clinical Infectious Diseases online. Consisting of data provided by the authors to benefit the reader, the posted materials are not copyedited and are the sole responsibility of the authors, so questions or comments should be addressed to the corresponding author.
Notes
Author contributions. R. R. and S. T. conceived and designed the experiments; G. A. V. d. S., V. C. S., T. G. M., and J. d. E. S. J. performed the experiments; M. L. G. d. S. and A. C. T. recruited patients at FMT-HVD; G. A. V. d. S., T. G. M., and J. d. E. S. J. recruited healthy controls from the endemic areas; G. A. V. d. S., V. C. S., J. d. E. S. J., and F. G. N. analyzed the data; G. A. V. d. S., S. T., F. G. N., and R. R. wrote the manuscript.
Acknowledgments. The authors thank all patients and individuals from the endemic areas who were willing to participate in this study. We also thank Felipe Jule de Araujo, Luan Diego Oliveira, and Suzana Kanawati Pinheiro for field work.
Financial support. This work was supported by the Brazilian Council for Scientific and Technological Development (CNPq) (grant number 404181/2012-0) to R. R. and the Fundação de Amparo a Pesquisa do Estado do Amazonas to R. R. (grant number 06201954/2015).
Potential conflicts of interest. The authors report no potential conflicts of interest. All authors have submitted the ICMJE Form for Disclosure of Potential Conflicts of Interest. Conflicts that the editors consider relevant to the content of the manuscript have been disclosed.

