


Abstract
Enterovirus 71 (EV71) is a major causative agent of hand, foot, and mouth disease (HFMD), associated with severe manifestations of the disease. Pediatric immunization with inactivated EV71 vaccine was initiated in 2016 in the Asia-Pacific region, including China. We analyzed a time series of HFMD cases attributable to EV71, coxsackievirus A16 (CA16), and other enteroviruses in Chengdu, a major transmission center in China, to assess early impacts of immunization.
Reported HFMD cases were obtained from China’s notifiable disease surveillance system. We compared observed postvaccination incidence rates during 2017–2018 with counterfactual predictions made from a negative binomial regression and a random forest model fitted to prevaccine years (2011–2015). We fit a change point model to the full time series to evaluate whether the trend of EV71 HFMD changed following vaccination.
Between 2011 and 2018, 279 352 HFMD cases were reported in the study region. The average incidence rate of EV71 HFMD in 2017–2018 was 60% (95% prediction interval [PI], 41%–72%) lower than predicted in the absence of immunization, corresponding to an estimated 6911 (95% PI, 3246–11 542) EV71 cases averted over 2 years. There were 52% (95% PI, 42%–60%) fewer severe HFMD cases than predicted. However, the incidence rate of non-CA16 and non-EV71 HFMD was elevated in 2018. We identified a significant decline in the trend of EV71 HFMD 4 months into the postvaccine period.
We provide the first real-world evidence that programmatic vaccination against EV71 is effective against childhood HFMD and present an approach to detect early vaccine impact or intended consequences from surveillance data.
Enterovirus 71 (EV71) is a major causative agent of hand, foot, and mouth disease (HFMD), associated with severe manifestations of the illness. HFMD causes substantial burden in the Asia-Pacific region, including China, which reported >20 million cases between 2008 and 2018 [1]. Between 2004 and 2013, HFMD had the highest incidence of any infectious disease in China and was the leading cause of death for children <5 years old among all 39 notifiable infectious diseases [2, 3]. The most prevalent enterovirus serotypes causing HFMD in China are EV71 and coxsackievirus A16 (CA16), with EV71 implicated in 70% of severe cases and 92% of deaths [4–7]. In China, EV71 cost an estimated US$180–$330 million in 2016 [8], and caused >3000 deaths between 2008 and 2017 [7].
In December 2015, a monovalent, inactivated whole-virus vaccine against EV71 developed by the Institute of Medical Biology, Chinese Academy of Medical Sciences (CAMS), was licensed in China [9, 10]. Another was licensed in January 2016 by Sinovac Biotech Co, Ltd (Beijing) [11], and a third in late 2016 by Vigoo Biological Co, Ltd (Beijing) [12]. In phase 3 clinical trials among healthy children aged 6–35 months, vaccine efficacy exceeded 90% against EV71-associated HFMD after 1 dose and 98.8% after 2 doses for all 3 licensed vaccines [10, 11, 13]. In 2016, the vaccine was gradually made available for a fee at healthcare centers in China, targeting children 6–59 months of age. For best efficacy, 2 doses are encouraged, 1 month apart, starting at 6 months of age.
Despite promising clinical trials, the real-world impact of China’s vaccination program remains unknown. In 2017–2018, after vaccine introduction, Beijing and Chengdu reported outbreaks of all-cause HFMD [14, 15]. Infection with EV71 or CA16 is thought to confer lifelong serotype-specific immunity [4], as well as transient (~7 weeks) cross-serotype protection [16]. Given that the vaccine is not expected to confer cross-immunity [2, 16], increases in HFMD incidence due to nonvaccine serotypes post–vaccine introduction may indicate serotype replacement [17, 18].
Here, we estimate the effect of EV71 vaccine introduction on reported incidence of HFMD due to EV71 and non-EV71 serotypes in Chengdu, an urban prefecture in Sichuan Province with incidence that is consistently among the highest in southwest China [19]. The introduction of the EV71 vaccine in 2016, combined with high-quality surveillance data, make Chengdu a vital setting in which to study early evidence of the impact of EV71 vaccination and its potential benefits in major Asian population centers with similarly high EV71 burdens.
METHODS
Epidemiologic and Covariate Data
The study region of Chengdu Prefecture in southwest China contains >15 million people in an area of 14 380 km2, making it the fifth most populous Chinese metropolitan region [20]. HFMD cases in China are highly seasonal, with transmission beginning in urban centers and spreading to the urban–rural interface [21]. As Chengdu is surrounded by rural prefectures, the transmission dynamics of HFMD there have implications for Sichuan Province [19].
HFMD cases in Chengdu reported between 1 January 2011 and 31 December 2018 were obtained from China’s National Infectious Disease Reporting System (NIDRS), a passive electronic surveillance system covering almost all Chinese healthcare facilities [22]. Upon diagnosis, all HFMD cases are required to be reported to NIDRS within 24 hours.
HFMD cases were defined as a patient presenting with papular or vesicular rash on the hands, feet, mouth, or buttocks [23]. The distinctness of clinical features of HFMD and differences in the epidemiology, seasonality, and progression of the differential diagnoses limit concerns of clinical misdiagnosis [24, 25]. To identify the proportion of serotypes in circulation, serotypes were determined by reverse-transcription polymerase chain reaction (RT-PCR), real-time RT-PCR, or virus isolation for 9879 of 279 352 (3.5%) patients who met the HFMD case definition [23]. Serotype determination was more common during certain years, at certain facilities, and for severe cases.
Year-end, age-stratified population data were obtained for 2011–2017 [20] and projected for 2018 based on prior years’ population using splines. Data on the number of doses given at healthcare facilities in Chengdu were collected by the Sichuan Center for Disease Control and Prevention immunization information system, which tracks daily vaccinations provided at each inoculation point throughout the province and their manufacturer. The majority (~80%) of vaccines administered in Chengdu were produced by CAMS, with the remaining by Sinovac (Supplementary Figure 1).
Statistical Analysis
Construction of Time Series Adjusted for Probability of Serotype Testing
Because a nonrandom subset of cases underwent serotype determination, we constructed adjusted time series for HFMD cases caused by EV71, CA16, and other (non-EV71 and non-CA16) enteroviruses via inverse probability weighting. First, we regressed a binary indicator for receiving laboratory testing against month of diagnosis, case severity (binary, defined as suffering cardiopulmonary or neurological complications [4, 26]), age group (0–4 years, 5–9 years, ≥10 years), sex, and a linear trend on year stratified by severity (Supplementary Text 1). We weighted each tested case by the inverse of its model-predicted probability of being tested to reflect the total underlying number of cases with the same etiology. Predicted probabilities closely matched the observed data (Supplementary Figure 1.1). We compiled the adjusted monthly time series of EV71, CA16, and other HFMD cases by summing these weights, representing the most probable serotype-specific case counts.
Establishing Counterfactual Expectations and Estimating Vaccine Impact
We took parametric and nonparametric approaches to estimate the incidence of HFMD due to EV71, CA16, and other etiologies as well as severe HFMD incidence expected in the absence of vaccination. In both approaches, we fit 4 separate predictive models to the adjusted time series of serotype-specific and severe cases from the prevaccine period (2011–2015), and used the fitted models to predict incidence rates in the postvaccine period (2017–2018). Following others’ work [27–29], we considered 2016 a transitional period and excluded it from analysis.
Candidate predictive generalized linear models (GLMs) assumed a negative binomial distribution (Supplementary Text 2) and included an offset for yearly population, as well as combinations of terms for age-specific fixed effects; seasonality (monthly fixed effects or 6- and/or 12-month harmonic terms); population immunity (all-cause or serotype-specific incidence in the prior year); biennial periodicity (24-month harmonic term); and yearly trend (linear or cubic spline). We applied blocked cross-validation within the prevaccine period, selecting the model for each outcome with the lowest out-of-sample mean squared error across holdout years (Supplementary Text 3) [30, 31]. We compared model-predicted, expected rates in the postvaccine period to observed rates and calculated incidence rate ratios (IRRs) as the sum of the observed cases over the sum of the expected cases. We calculated 95% prediction intervals (PIs) via 1 000 000 Monte Carlo simulations using parameter estimates from the fitted models. We propagated uncertainty year by year for models that included an autoregressive term capturing last year’s incidence, using the distribution of simulated incidence in the prior year as inputs to predictions in the current year.
To reduce concerns surrounding GLM misspecification, we performed a sensitivity analysis using random forest regression (“ranger” package in R, version 3.5.1), a nonparametric machine-learning algorithm, to predict monthly serotype-specific HFMD rates, using the same candidate covariates we did for the GLMs [32]. Predictions from each tree were averaged to generate an ensemble estimate. We adapted bootstrap sampling routine to randomly exclude a year of prevaccine data during training of each tree to ensure generalizability to unobserved years [33]. The 95% PIs were calculated from the .025 and 0.975 quantiles of the estimated conditional distribution of the response variable [34].
As an alternative approach to estimating vaccine impact, we fit a change point model to the full time series to determine whether vaccine introduction preceded a significant change in the epidemiologic trend. Unlike interrupted time-series analysis, change point methods do not preassume the point at which changes in incidence occur but rather assess whether changes in incidence trends follow, and are thus likely attributable to, vaccine implementation [35, 36]. To identify the most likely change point, we fit negative binomial GLMs for EV71 HFMD incidence, incorporating harmonic terms for seasonal and biennial periodicities, as well as pre– and post–change point yearly linear trends (Supplementary Text 2). We assessed each month in the full time series as a candidate change point, and selected the model with the highest log-likelihood. We generated counterfactual predictions of post–change point incidence rates by assuming a continuation of pre–change point trends. PIs were estimated as before.
RESULTS
Descriptive Analysis
Between 1 January 2011 and 31 December 2018, 279 352 HFMD cases were reported in Chengdu Prefecture, resulting in 19 deaths (0.2%) and 2430 severe cases (0.9%) (see Table 1 and Supplementary Table 1 for yearly breakdown). The median age was 5 years (range, 0–84 years), and 58% of cases were male. Of 9879 (3.5%) tested cases, 2503 (20.8%) were positive for EV71 and 1859 (18.8%) were positive for CA16. Among cases with known etiology, EV71 was associated with 48% of severe cases and 85% of deaths. Across Chengdu, immunizations began in June 2016, with the rate of vaccination increasing monthly until stabilizing in July 2017 (Supplementary Figure 1). Over this period, 880 673 doses were administered, corresponding to a coverage of 54.3% of the eligible 811 700 children if all vaccinated children received 2 doses.
Distribution of Hand, Foot, and Mouth Disease Incidence by Sex, Age, Severity, and Serotype in Chengdu, China, 2011–2018
| Characteristic | All Cases | Cases With Known Serotypes (N = 9879) | ||
|---|---|---|---|---|
| EV71 | CA16 | Other Enteroviruses | ||
| Total, No. (%) | 279 352 (100) | 2053 (20.8) | 1859 (18.8) | 5967 (60.4) |
| Male sex, No. (%) | 162 757 (58.3) | 1231 (20.3) | 1134 (18.8) | 3670 (60.8) |
| Age, y, median (range) | 5 (0–84) | 7 (0–36) | 6 (0–35) | 5 (0–38) |
| Severe, No. (%) | 2430 (0.88) | 639 (46.6) | 115 (8.4) | 616 (45.0) |
| Deaths, No. (%) | 19 (< 0.01) | 12 (85.7) | 0 (0) | 2 (14.3) |
Abbreviations: CA16, coxsackievirus A16; EV71, enterovirus 71.
The adjusted time series of monthly incidence of EV71, CA16, and other enteroviruses exhibits seasonal peaks following 6-, 12-, and 24-month periodicities (Figure 1). Prior to 2016, EV71 and CA16 alternated years as the most prevalent known serotype, with the proportion of EV71 cases declining post–vaccine introduction and the proportion of CA16 cases remaining stable (Figure 1). Annual oscillations are less clear for the proportion of non-CA16 and non-EV71 cases. The peak incidence rate of EV71, observed in 2016, was followed by a substantial decline, and 2018 recorded both the fewest annual cases of EV71 in the study period and the highest annual cases of non-CA16 and non-EV71 HFMD.
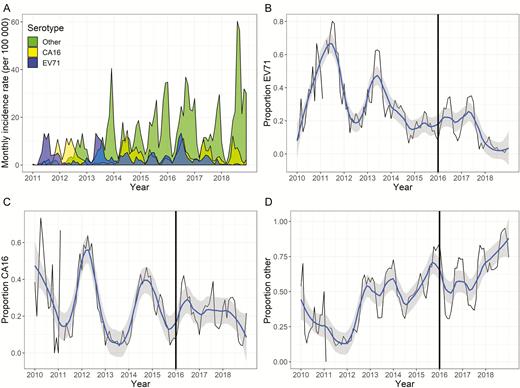
A, Monthly incidence rate per 100 000 of adjusted serotypes for hand, foot, and mouth disease (HFMD) in Chengdu, China, 2011–2018. Adjustment involved calculating a weighted sum of cases for each serotype determination, where weights were equal to the inverse probability of having been tested. The monthly observed (black line) and smoothed (blue line, with 95% confidence interval in gray) proportion of enterovirus 71 (EV71) cases that make up all HMFD cases (B), the proportion of coxsackievirus A16 (CA16) cases that make up all HMFD cases (C), and the proportion of non-CA16 and non-EV71 cases that make up all HMFD cases (D) are shown. The black vertical line in B–D represents year of vaccine introduction. Abbreviations: CA 16, coxsackievirus A16; EV71, enterovirus 71.
Estimated Vaccine Impacts on EV71 HFMD and Severe HFMD
During the 2 years following EV71 immunization in Chengdu (2017–2018), EV71 incidence rates were lower than expected based on predictions from GLM and random forest models fit to prevaccine data, as well as the best change point model. The IRR of observed EV71 HFMD over the expected incidence based on the best predictive GLM was 0.40 (95% PI, .28–.59) (Table 2; Figure 2). A cumulative total of 6911 (95% PI, 3246–11 542) fewer EV71 cases were reported than expected over 2017–2018, with 5664 (95% PI, 2186–11 059) averted cases in 2018. The random forest model yielded similar results, estimating a total of 8314 (95% PI, −1942 to 25 427; IRR, 0.36 [95% PI, .15–1.73]) fewer EV71 cases reported than expected over 2017–2018, with 4622 (95% PI, 182–12 266) averted cases in 2018 (Supplementary Table 2; Supplementary Figure 2).
Observed Enterovirus 71, Coxsackievirus A16, and Other Etiology Hand, Foot, and Mouth Disease Case Counts, Expected Cases Under Generalized Linear Models, and Incidence Rate Ratios for the Postvaccine Period 2017–2018 in Chengdu, China
| Cases | Cases in 2017 | Cases in 2018 | Combined Cases, 2017–2018 | ||||||
|---|---|---|---|---|---|---|---|---|---|
| Observed | Averted (95% PI)b | IRR (95% PI) | Observed | Averted (95% PI) | IRR (95% PI) | Observed | Averted (95% PI) | IRR (95% PI) | |
| EV71a | 4198 | 1247 (−1851 to 60 080) | 0.77 (.07–1.79) | 400 | 5664 (2186–11 059) | 0.07 (.03–.15) | 4598 | 6911 (3246–11 542) | 0.40 (.28–.59) |
| CA16a | 8465 | −4262 (−7816 to 5433) | 2.01 (.61–13.04) | 6702 | 7706 (−4766 to 47 579) | 0.47 (.12–3.46) | 15 167 | 3444 (−11 439 to 45 394) | 0.81 (.25–4.06) |
| Othera | 26 647 | −8725 (−21 529 to 19 624) | 1.49 (.58–5.21) | 41 658 | −25 574 (−36 727 to −3938) | 2.59 (1.10–8.45) | 68 304 | −34 299 (−54 132 to 3188) | 2.01 (.96–4.82) |
| Severe cases | 175 | 36 (−18 to 100) | 0.83 (.64–1.11) | 90 | 250 (170–342) | 0.26 (.21–.35) | 265 | 286 (188–396) | 0.48 (.40–.58) |
| Total | 39 310 | −11 740 (−27 519 to 20 247) | 1.43 (.66–3.33) | 48 757 | −11 804 (−33 404 to 33 675) | 1.32 (.59–3.18) | 88 069 | −23 944 (−55 494 to 35 214) | 1.37 (.71–2.70) |
Abbreviations: CA16, coxsackievirus A16; EV17, enterovirus 71; IRR, incidence rate ratio; PI, prediction interval.
aAdjusted by inverse probability of testing. See Supplementary Text 1.
bPrediction intervals calculated via 1 000 000 Monte Carlo simulation draws using fitted model parameters.

Results of analyses examining trends from 2011 to 2018 for enterovirus 71 (EV71)–specific hand, foot, and mouth disease (HFMD; A), coxsackievirus A16–specific HFMD (B), HFMD caused by another enterovirus (C), and severe HFMD (D), and associated comparisons of observed events (black dotted lines and dots) to predicted events (teal solid line) before and after vaccination. Expected number of cases and 80% prediction intervals (teal shading) are based on predictions from generalized linear models fitted to historic data. Eighty percent prediction intervals are shown in place of 95% prediction intervals to better allow visual comparison between observed and model predicted counts. The beige box indicates the year vaccination was first begun and is removed from calculation of averted cases. The gray dotted line indicates the cumulative number of doses of the vaccine given in Chengdu (right axis). Abbreviations: CA 16, coxsackievirus A16; EV71, enterovirus 71.
Similarly, the IRR for the observed over the expected incidence of severe HFMD cases was 0.48 (95% PI, .40–.58; Table 2; Figure 2) according to the best predictive GLM, and 0.46 (95% PI, .22–1.80) according to the random forest model. A cumulative total of 286 (95% PI, 188–396) fewer severe cases were reported than expected.
The change point model that achieved the highest log-likelihood identified a change in EV71 trend in April 2017, roughly 10 months after vaccine introduction, when a total of 186 779 vaccines (corresponding to an estimated 15% coverage assuming vaccinated children obtained 2 doses) had been administered (Figure 3). The resultant model estimated an IRR of 0.18 (95% PI, .08–.42), corresponding to 14 653 (95% PI, 4267–33 874) EV71 cases averted, when comparing observed incidence rates for May 2017–December 2018 with the counterfactual predictions.
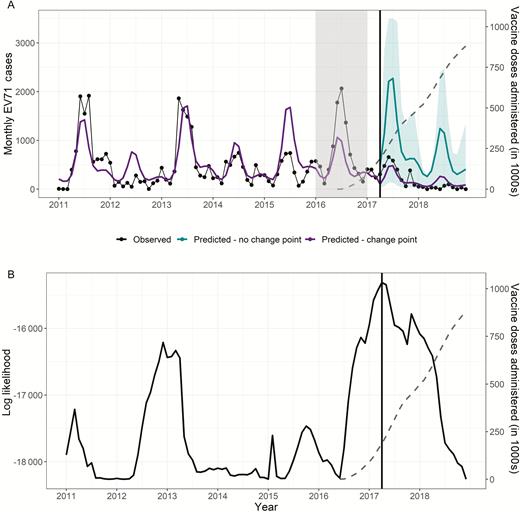
Results of the change point analysis testing a change in trend for individual months in the full time series, 2011–2018. The gray dotted line in both panels indicates the total number of doses of the vaccine administered in Chengdu (right axis). A, Observed cases (black) against predicted cases (purple), setting the change point at the most likely month (indicated by vertical line, April 2017). Counterfactual predictions (teal) indicate continuation of the trend if the effect of the change in slope were removed. B, Log-likelihood of the model when a change in the slope was included at the month indicated (maximum likelihood indicated by vertical line, April 2017). Abbreviation: EV71, enterovirus 71.
Vaccine Impacts on CA16 and Other HFMD Etiologies
Comparisons of observed CA16 and other HFMD incidence rates with forecasts from their respective best predictive GLMs did not provide strong statistical evidence for changes in CA16 transmission when examined over the 2-year postvaccine period (Table 2). For CA16, the estimated postvaccine IRR was 0.81 (95% PI, .25–4.06); however, for non-EV71 and non-CA16 HFMD, the IRR was 2.01 (95% PI, .96–4.82). We observed 25 574 (95% PI, 3938–36 727) more cases of HFMD caused by non-CA16 and non-EV71 enteroviruses in 2018 than predicted by our GLM (IRR, 2.59 [95% PI, 1.10–8.45]). Point estimates from random forest models were consistent in direction of effect with GLM results, but did not indicate a statistically significant decline or increase of cases for either the 2017–2018 period or for 2018 in isolation (Supplementary Table 2).
DISCUSSION
We present the first estimates of the real-world impact of vaccination of children aged 6–59 months against EV71 in Chengdu Prefecture, a major center of EV71 transmission. We observed a substantial decrease in reported EV71-specific and severe HFMD cases in Chengdu in 2017–2018, the years following vaccine introduction. Infection with EV71 was confirmed in 85% of HFMD-associated deaths, which corresponds with a previous report of high (92%) proportion of deaths attributable to EV71 [7]. We found no statistical evidence of postvaccine reductions in non-EV71 HFMD etiologies, suggesting that the observed changes in EV71 transmission are likely attributable to the vaccine rather than external factors.
We employed 2 distinct methods to estimate counterfactual EV71 HFMD incidence in the absence of vaccination. The first, predictive model selection via cross-validation with forecasting to the postvaccine period makes no assumption on the functional form needed to capture changes in incidence after vaccine implementation, but uses a priori delineation of the intervention period. The second, change point modeling, utilizes the full time series to identify the most likely timing of major changes in incidence, but assumes a more restrictive functional form to fit the post–change point data (ie, log-linear trend over time). Change point analysis can be more susceptible to influence of phenomena that are poorly captured by the preintervention model (eg, the disruption of 24-month periodicity of EV71 HFMD between 2013 and 2016). In this study, both methods identified significant decreases in EV71 incidence in the postvaccine period. Estimates of case reduction due to vaccination from the change point model in 2017 were substantially higher than forecasting estimates, potentially resulting from the influence of high case counts for EV71 in 2016 on pre–change point parameter estimates.
Individually randomized clinical trials of the vaccines licensed by Sinovac and CAMS demonstrated a vaccine efficacy against EV71 HFMD of >98% after 2 doses [10, 11, 13]. Assuming an efficacy of 50% for a single dose, and 90%–98% for 2 doses, Wang et al predicted that full immunization would avert 7.57 cases of EV71 HFMD per vaccinated infant per year across all of China [37]. While difficult to draw a direct comparison given uncertainties regarding the number of individuals immunized, the proportion receiving 1 or 2 doses, and their age and geographic distribution, Wang’s predictions are consistent with our estimates: 3246–11 542 cases averted over 2 years, after administering 880 673 doses. If all children received 2 doses, this corresponds to 3.69–13.11 cases averted per thousand vaccinated children per year by our estimate.
Given that the vaccine, unlike EV71 infection, is not expected to confer short-term protection against non-EV71 serotypes [2, 16], increases in nonvaccine serotypes postvaccination may indicate serotype replacement [17, 18]. While our GLM forecasts show that incidence of HFMD etiologies other than EV71 and CA16 increased in 2018, it is difficult to discern if this is attributable to serotype replacement or other factors, as 2018 was a year of anomalously high HFMD incidence [14, 15]. Mathematical simulations predict that serotype replacement, if it occurred, would be minimal [16, 38]. Our model variances are large for all serotypes, so continuous monitoring of nonvaccine serotypes is warranted.
This study has limitations. Although a small proportion of cases underwent serotype determination, inverse probability weighting permitted adjustment of the case counts for each serotype to account for testing propensities. While the postvaccine period is of limited duration, the length of our prevaccine period is consistent with similar studies and captured inter- and intra-annual variation in incidence. Leave-out-1-year cross-validation in model selection expresses well the uncertainty in extrapolating estimates to unforeseen years [39].
The best predictive model for EV71 captured 2-year periodicity in the training period using an autoregressive term rather than 24-month harmonic terms. Consequently, mean predictions for both 2017 and 2018 indicated moderate incidence, rather than continued alternation between low and high incidence years; variance in predicted prior years’ incidence was absorbed into prediction uncertainty. While this may result in mean predictions inconsistent with the prevaccination pattern, the additional prediction variance should lead to conservative lower bound estimates of cases averted, and is not expected to create bias when examining the full postvaccine period. The 2016 rise in EV71 incidence could have caused, in part, the observed decrease in 2017 if the susceptible population were depleted. However, if vaccination had not been effective, we would have expected a rebound in 2018 consistent with the observed biennial patterns. Also, inclusion of prior years’ EV71 incidence as a covariate in the model accounted for population immunity in our counterfactual predictions.
As only 19 HFMD deaths were reported between 2011 and 2018, we did not evaluate the impact of vaccination on mortality. Between 1 and 6 deaths were reported annually from 2011 to 2016, while only 1 death was reported in 2017 and none in 2018 (Supplementary Table 1). Limited reporting among children aged <5 years at the beginning of the time series prevented stratification of the vaccine impact by age group, as age-specific models for prevaccine EV71 incidence were unstable. The adjusted incidence of EV71 declined in 2017–2018 across all ages, potentially suggesting indirect and direct effects of vaccination (Supplementary Figure 3). As the median age of EV71 infection is 7 years, there may also be delayed direct effect in children aged 5–7 years.
We provide early evidence of vaccine impact on HFMD incidence in an urban area with high EV71 transmission. After initiation of pediatric immunization with inactivated EV71 vaccine, a dramatic decline in EV71-associated HFMD incidence was observed in Chengdu, accompanied by a similar relative decline in severe HFMD. It is unknown whether the 2018 increase in cases caused by other serotypes resulted from vaccine-driven serotype replacement, continuing emergence of non-EV71 HFMD, or external factors. Continued monitoring of non-EV71 serotypes will thus be crucial. For now, the strong evidence from clinical trials, simulations, and the substantial population-level decreases in EV71 HFMD incidence documented here support use of EV71 vaccine to control severe childhood HFMD.
Supplementary Data
Supplementary materials are available at Clinical Infectious Diseases online. Consisting of data provided by the authors to benefit the reader, the posted materials are not copyedited and are the sole responsibility of the authors, so questions or comments should be addressed to the corresponding author.
Notes
Financial support. This work was supported by the National Institutes of Health (grant numbers R01AI125842 and R01TW010286) and the National Science Foundation (grant numbers 1360330 and 1646708).
Potential conflicts of interest. B. L. has received funding from Takeda Pharmaceutical, the Centers for Disease Control and Prevention Foundation, and Hall Boot Smith. All other authors report no potential conflicts of interest. All authors have submitted the ICMJE Form for Disclosure of Potential Conflicts of Interest. Conflicts that the editors consider relevant to the content of the manuscript have been disclosed.
References
National Health Commission of the People’s Republic of China. Report on notifiable diseases. Available at: http://www.nhc.gov.cn/. Accessed 3 September 2019.

