


Abstract
Improving appropriate antibiotic use is crucial for combating antibiotic resistance and unnecessary adverse drug reactions. Acute respiratory illness (ARI) commonly causes outpatient visits and accounts for ~41% of antibiotics used in the United States. We examined the influence of influenza vaccination on reducing antibiotic prescriptions among outpatients with ARI.
We enrolled outpatients aged ≥6 months with ARI from 50–60 US clinics during 5 winters (2013–2018) and tested for influenza with RT-PCR; results were unavailable for clinical decision making and clinical influenza testing was infrequent. We collected antibiotic prescriptions and diagnosis codes for ARI syndromes. We calculated vaccine effectiveness (VE) by comparing vaccination odds among influenza-positive cases with test-negative controls. We estimated ARI visits and antibiotic prescriptions averted by influenza vaccination using estimates of VE, coverage, and prevalence of antibiotic prescriptions and influenza.
Among 37 487 ARI outpatients, 9659 (26%) were influenza positive. Overall, 36% of ARI and 26% of influenza-positive patients were prescribed antibiotics. The top 3 prevalent ARI syndromes included: viral upper respiratory tract infection (47%), pharyngitis (18%), and allergy or asthma (11%). Among patients testing positive for influenza, 77% did not receive an ICD-CM diagnostic code for influenza. Overall, VE against influenza-associated ARI was 35% (95% CI, 32–39%). Vaccination prevented 5.6% of all ARI syndromes, ranging from 2.8% (sinusitis) to 11% (clinical influenza). Influenza vaccination averted 1 in 25 (3.8%; 95% CI, 3.6–4.1%) antibiotic prescriptions among ARI outpatients during influenza seasons.
Vaccination and accurate influenza diagnosis may curb unnecessary antibiotic use and reduce the global threat of antibiotic resistance.
Antibiotic resistance is a growing threat to public health. It is estimated to contribute to 2.8 million illnesses, 35 000 deaths, and $30 billion in direct healthcare costs annually in the United States [1, 2]. Studies have identified a strong association between the use of antibiotics and spread of antibiotic resistance [3, 4]. A substantial portion of antibiotic prescribing in the United States is driven by acute respiratory illnesses (ARIs), which are common causes of outpatient visits during the winter season [5]. Annually, approximately 270 million courses of oral antibiotics are dispensed from US outpatient pharmacies [6]. Reducing unnecessary antibiotic use among patients with ARI may help reduce unnecessary healthcare expenditures, antibiotic resistance, and adverse events [7, 8].
Influenza virus infection is a common vaccine-preventable cause of ARI and may be clinically diagnosed as viral upper respiratory tract infection, pharyngitis, sinusitis, bronchitis, or otitis media [9]. In studies where outpatients with ARI were systematically tested, influenza viruses were detected in 23–35% of patients [9, 10]. In these studies, clinicians infrequently performed clinical influenza testing and prescribed antibiotics to 30–41% of outpatients with ARI. Furthermore, 11–43% of antibiotic prescriptions prescribed in the United States were provided to patients with influenza-associated ARI. Prevention through influenza vaccination of influenza and associated secondary complications, such as bacterial infections or otitis media, may result in substantial reductions in outpatient ARI visits and antibiotic use [8].
We sought to estimate the effects of influenza vaccination on reducing outpatient antibiotic use. Using data from the US Influenza Vaccine Effectiveness (US Flu VE) Network, we estimated the overall proportion of ARI syndromes and antibiotic prescriptions that was averted through influenza vaccination.
METHODS
Overview
The real-world reduction in antibiotic prescription through influenza vaccination is a function of influenza vaccine effectiveness, vaccination coverage, influenza prevalence, and proportion of patients with influenza treated with antibiotics. We turned to 5 years of data from US Flu VE Network, from 2013–2014 through 2017–2018 influenza seasons, to examine direct evidence for the role of influenza vaccination on antibiotic prescribing among outpatients with ARI.
Study Setting and Participants
The US Flu VE Network is composed of 50–60 healthcare facilities associated with 5 research institutions, in Michigan, Pennsylvania, Texas, Washington, and Wisconsin to assess influenza vaccine effectiveness (VE) annually. Parents of patients aged 6 months or older seeking outpatient care for ARI, defined as a new cough of 7 days duration or less, were consented and enrolled [11–13].
All patients were tested for influenza using real-time reverse transcription–polymerase chain reaction assays (RT-PCRs). These research influenza testing results were not available in real time for clinical decision making; clinical testing for influenza may have been performed at the clinicians’ discretion but was infrequent (performed in ~5% of ARI visits). Thus, the US Flu VE Network data could not influence clinical decisions to prescribe antibiotics or antivirals.
Vaccination History and Antibiotic Prescriptions
We linked research influenza testing results with visit diagnoses, antibiotic and antiviral prescriptions, and vaccination history. As medication dispensing was not available for all sites, prescriptions of antibiotic and influenza antiviral medications obtained within 7 days of enrollment were identified from pharmacy, insurance, or electronic medical records. Vaccination status was based on documented receipt of the current season’s influenza vaccine in electronic immunization records or plausible self-report (ie, reported timing and place of vaccination) to account for influenza vaccinations that were not documented [12]. Institutional review boards at all participating sites and the Centers for Disease Control and Prevention approved the US Flu VE study.
Acute Respiratory Illness Syndromes
Research staff abstracted International Classification of Diseases, Ninth and Tenth Revision, Clinical Modification (ICD-CM), diagnosis codes from each enrollee’s medical record, which were used to define 9 “ARI syndromes,” as previously described [9, 14, 15]. Clinician diagnosis was not collected. Because 94% of patients had 4 or fewer ICD codes, the first 4 ICD codes were used to classify syndromes. Acute respiratory illness syndromes were allergy or asthma, bronchitis, clinical influenza, otitis media (including suppurative and nonsuppurative), pharyngitis, pneumonia, sinusitis, viral upper respiratory tract infection, or other ARI syndromes. Syndromes were not mutually exclusive and patients could have more than 1 ARI syndrome code assigned to an outpatient visit.
Classification of Acute Respiratory Illness Syndromes Based on Appropriateness of Antibiotic Use
Acute respiratory illness syndromes were assigned to tier 1 (pneumonia), tier 2 (pharyngitis, sinusitis, and otitis media), or tier 3 (viral upper respiratory tract infection, bronchitis, allergy or asthma, clinical influenza, or other specified ARI syndrome) based on appropriateness of antibiotic treatment, using previously described methods [9, 14]. Tier 1 included a diagnosis for which antibiotics are almost always indicated, tier 2 included diagnoses for which antibiotics may be indicated, and tier 3 included diagnoses for which antibiotics are not indicated or the indication is unclear. Importantly, tiers were mutually exclusive: visits were assigned to the tier with the highest likelihood of antibiotic treatment of any one of their ARI syndromes.
Vaccine Effectiveness
Vaccine effectiveness against laboratory-confirmed influenza was estimated using a test-negative design, stratified by syndrome and tier [16]. We excluded patients vaccinated 14 days or less before illness onset and children aged younger than 9 years who were considered partially vaccinated according to the US Advisory Committee on Immunization Practices recommendations. Among patients with the same ARI syndrome, we compared the odds of vaccination among influenza-positive versus influenza-negative enrollees, using logistic regression to calculate odds ratios (ORs). Vaccine effectiveness was calculated as 1 − OR × 100. We adjusted all logistic regression models a priori for influenza season, site, sex, age, race/ethnicity, days from illness onset to specimen collection, presence of 1 or more high-risk medical condition(s), self-rated general health status score, and calendar time (in 1-month increments) [12].
Prevented Proportion of Each Acute Respiratory Illness Syndrome Due to Influenza Vaccination
The proportion of medically attended, all-cause ARI averted by influenza vaccination (pARI) was estimated by multiplying the prevalence of influenza in the absence of vaccination (pflu) by the proportion effectively vaccinated (pVE × pcov), where pVE denotes VE and pcov denotes vaccination coverage (Equation 1). Using 5 seasons of US Flu VE Network data, we estimated pflu from the prevalence of influenza in unvaccinated patients with each ARI syndrome, under the assumption that prevalence in unvaccinated patients reflected the baseline prevalence of influenza among patients with ARI in their respective communities. We estimated pVE from the adjusted VE against each influenza-associated ARI syndrome and pcov from the influenza vaccination rate among influenza-negative patients with each ARI syndrome.
Averted Proportion of Antibiotic Prescriptions Due to Influenza Vaccine
We hypothesized that influenza vaccine could reduce antibiotic prescriptions by preventing influenza outpatient visits and associated antibiotic prescriptions. To avoid overestimation, we did not calculate these estimates of averted antibiotics by syndrome, because individual ARI visits could have been assigned to more than 1 syndrome. Therefore, we estimated the percentage reduction in antibiotic prescriptions for ARI due to influenza vaccination for all ARI visits and by each of the 3 mutually exclusive syndrome tiers. The proportion of all patients with ARI treated with antibiotics that could be averted through influenza vaccination (pabx) can be computed by multiplying pARI by the prevalence of antibiotic prescriptions among influenza-positive patients in the absence of vaccination and dividing by the prevalence of antibiotic prescriptions among all persons with ARI (Equation 2). This method assumes that a history of having received an influenza vaccination did not alter the probability of receiving antibiotics. We stratified analyses by age younger than 18 years and age 18 years and older.
Uncertainty bounds were calculated around the overall and each tier-specific estimate using 1000 Monte-Carlo simulations. In each simulation, a random value was drawn from the assumed distribution of each equation parameter and pARI and pabx were estimated. Normal and binomial distributions were assumed. The 95% uncertainty bound was defined as from the 2.5th to the 97.5th percentiles of the estimated pARI and pabx distributions.
To estimate the attributable fraction of antibiotics averted for each tier, we calculated the prevalence of influenza in each tier among all patients with ARI (computed by dividing the number of individuals with PCR-confirmed influenza within each tier by the total number of individuals with ARI). We then computed the proportion of each tier that was prescribed antibiotics.
We conducted sensitivity analyses to estimate antibiotics averted at increased levels of VE (range, 40–70%) and vaccination coverage (range, 60–100%). All analyses were conducted using SAS version 9.4 statistical software (SAS Institute, Inc) (see Supplementary Material 2).
RESULTS
During the 2013–2014 through 2017–2018 influenza seasons, among 37 487 enrolled patients with ARI (Figure 1), 18 807 (50%) were vaccinated against influenza and 9659 (26%) were confirmed influenza positive (Table 1). Practitioners provided antibiotics to approximately 36% (13 316) of the patients with ARI and 26% of the patients who were subsequently confirmed positive for influenza by research testing. We observed variation in the proportion of enrolled patients prescribed antibiotics by influenza season (2013–2014 = 34%, 2014–2015 = 41%, 2015–2016 = 38%, 2016–2017 = 28%, and 2017–2018 = 35%) and by site over the 5-year period (28% to 46%).
Characteristics of Patients With Acute Respiratory Infections in the 2013–2014 to 2017–2018 Influenza Seasons at Ambulatory Care Settings Affiliated With the US Flu VE Network
| Characteristics | Influenza Test Results Status,a No. of Patients (%) | ||
|---|---|---|---|
| Total (N = 37 487) | Influenza Positive (n = 9659) | Influenza Negative (n = 27 828) | |
| Season | |||
| 2013–2014 | 5612 (15) | 1172 (12) | 4440 (16) |
| 2014–2015 | 9334 (24) | 2230 (23) | 7104 (26) |
| 2015–2016 | 7208 (19) | 1293 (13) | 5915 (21) |
| 2016–2017 | 7137 (19) | 2039 (21) | 5098 (18) |
| 2017–2018 | 8196 (22) | 2925 (30) | 5271 (19) |
| Study hospital | |||
| Marshfield, Wisconsin | 8236 (22) | 2442 (25) | 5794 (21) |
| Southeast Michigan | 5789 (15) | 1593 (16) | 4196 (15) |
| Temple, Texas | 7243 (19) | 1640 (17) | 5603 (20) |
| Pittsburgh, Pennsylvania | 6781 (18) | 1961 (20) | 4820 (17) |
| Seattle, Washington | 9438 (25) | 2023 (21) | 7415 (27) |
| Influenza vaccination in the current season | 18 807 (50) | 4056 (42) | 14 751 (53) |
| Female sex | 21 897 (58) | 5398 (56) | 16 499 (59) |
| Age <18 years | 13 208 (35) | 3293 (34) | 9915 (36) |
| Race/ethnicity | |||
| White, non-Hispanic | 27 984 (75) | 7246 (75) | 20 738 (75) |
| Black, non-Hispanic | 2801 (7) | 801 (8) | 2000 (7) |
| Other, non-Hispanic | 3312 (9) | 810 (8) | 2502 (9) |
| Hispanic | 3287 (9) | 770 (8) | 2517 (9) |
| Days from illness onset to specimen collection | |||
| 0–2 | 12 180 (32) | 4155 (43) | 8025 (29) |
| 3–4 | 14 293 (38) | 3603 (37) | 10 690 (38) |
| 5–7 | 11 013 (29) | 1901 (20) | 9112 (33) |
| ≥1 High-risk condition in prior year | 15 633 (42) | 3860 (40) | 11 773 (42) |
| Self-rated general health status | |||
| Excellent | 12 236 (33) | 3410 (35) | 8826 (32) |
| Very good | 13 868 (37) | 3592 (37) | 10 276 (37) |
| Good | 8865 (24) | 2081 (22) | 6784 (24) |
| Fair | 2206 (6) | 506 (5) | 1700 (6) |
| Poor | 278 (1) | 54 (1) | 224 (1) |
| Refused | 34 (0) | 16 (0) | 18 (0) |
| Prescribed antibiotics | 13 316 (36) | 2496 (26) | 10 820 (39) |
| Prescribed antivirals | 2735 (7) | 1766 (18) | 969 (3) |
Abbreviation: US Flu VE, US Influenza Vaccine Effectiveness.
aTested by real-time reverse transcription–polymerase chain reaction. Percentage indicates percentage in the columns.
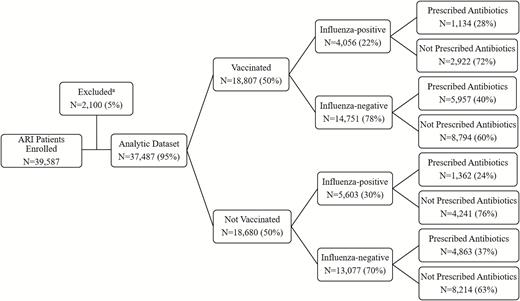
Influenza vaccination rate, influenza detection, and antibiotic prescriptions among outpatients with ARI: US Flu VE Network, 2013–2018. aPatients were excluded if aged <9 years and not fully vaccinated (846 excluded), vaccinated 0–13 days prior to onset (595), there were missing or invalid ICD-9/10 codes (551), RT-PCR results were inconclusive or unrepeatable (61), influenza RT-PCR results were unavailable (43), were tested >7 days after onset (3), or received live-attenuated influenza vaccine on day of enrollment (1). Abbreviations: ARI, acute respiratory illness; ICD-9/10, International Classification of Diseases, Ninth and Tenth Revision; RT-PCR, reverse transcription–polymerase chain reaction; US Flu VE, US Influenza Vaccine Effectiveness.
Practitioners assigned 1 or more syndromes to patients with ARI, including the following: viral upper respiratory tract infection (47%), other (42%) (see Supplementary Material 1), pharyngitis (18%), allergy or asthma (11%), bronchitis (10%), sinusitis (10%), influenza (9%), otitis media (8%) (including both suppurative and nonsuppurative otitis media), and pneumonia (3%).
Based on discharge syndromes, we classified 1234 (3%) of the patients with ARI to tier 1 (use of antibiotics nearly always appropriate), 12 780 (34%) to tier 2 (antibiotics sometimes indicated), and 23 473 (63%) to tier 3 (antibiotics not indicated or indication unclear). We did not identify any significant differences in discharge syndrome classifications among those aged less than 18 years and those 18 years of age or older (Table 2). Healthcare providers prescribed antibiotics to a higher proportion of patients with tier 1 (79% of 1234 patients) and tier 2 (55% of 12 780 patients) diagnoses compared with those with tier 3 diagnoses (23% of 23 473 patients) (Figure 2). However, few patients had tier 1 diagnoses. Thus, the attributable proportion of antibiotic reduction through influenza vaccination was lower in tier 1 (7%) compared with tier 2 (52%) and tier 3 (40%) categories.
Prevalence of Antibiotic Prescriptions by Acute Respiratory Illness Syndromes and Tiers Among Participants <18 Years of Age and ≥18 Years of Age: US Flu VE Network, 2013–2018 Influenza Seasons
| Total | <18 Years | ≥18 Years | ||||
|---|---|---|---|---|---|---|
| Diagnosis (Syndrome)a | Patients,b n (%) | Prescribed Antibiotic,c n (%) | Patients,b n (%) | Prescribed Antibiotic,c n (%) | Patients,b n (%) | Prescribed Antibiotic,c n (%) |
| Tier 1: Antibiotics almost always indicated | 1234 (3) | 979 (79) | 506 (4) | 388 (77) | 728 (3) | 59 (81) |
| Pneumonia | 1234 (100) | 979 (79) | 506 (100) | 388 (77) | 728 (100) | 59 (81) |
| Tier 2: Antibiotics potentially indicated | 12 780 (34) | 6986 (55) | 5590 (42) | 3112 (56) | 7190 (30) | 3874 (54) |
| Pharyngitis | 6840 (54) | 2408 (35) | 3118 (56) | 1091 (35) | 3772 (52) | 1317 (35) |
| Sinusitis | 3737 (29) | 2779 (74) | 465 (8) | 360 (77) | 3272 (46) | 2419 (74) |
| Otitis media | 3038 (24) | 2432 (80) | 2281 (41) | 1879 (82) | 757 (11) | 553 (73) |
| Tier 3: Antibiotics not indicated | 23 473 (63) | 5351 (23) | 7112 (54) | 991 (14) | 16 361 (67) | 4360 (27) |
| Viral upper respiratory tract infection | 17 672 (75) | 4982 (28) | 5803 (82) | 1376 (24) | 11 869 (73) | 3606 (30) |
| Bronchitis | 3615 (15) | 1924 (53) | 387 (5) | 171 (44) | 3228 (20) | 1753 (54) |
| Allergy or asthma | 4028 (17) | 1242 (31) | 1418 (20) | 294 (21) | 2610 (16) | 948 (36) |
| Clinical influenza | 3485 (15) | 531 (15) | 910 (13) | 165 (18) | 2575 (16) | 366 (14) |
| Remaining codes not listed elsewhere | 15 902 (68) | 5112 (32) | 5561 (78) | 1468 (26) | 10 341 (63) | 3644 (35) |
Abbreviations: ICD-9/10, International Classification of Diseases, Ninth and Tenth Revision; US Flu VE, US Influenza Vaccine Effectiveness.
aDiagnoses were assigned to the mutually exclusive tier with greatest indication for antibiotic treatment. Patient medical encounter may have diagnostic codes for ≥1 syndrome, which were thus not mutually exclusive. Syndromes were defined by the first 4 ICD-9/10 codes.
bPercentage indicates each tier as a subset of 100 and each syndrome as a subset within the respective tier.
cPercentage indicates proportion of patients who were prescribed antibiotics within that specific category.
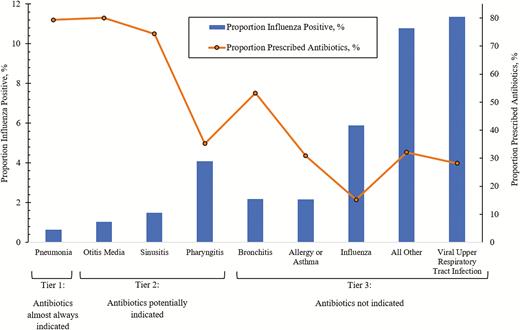
Prevalence of influenza-associated clinical syndrome among patients with acute respiratory illnessa and the proportion prescribed antibioticsb: US Flu VE Network, 2013–2018. aThe proportion of patients who are influenza positive is derived by dividing the number of individuals with PCR-confirmed influenza within each syndrome by the total number of individuals with acute respiratory illness (37 487). bThe proportion of patients prescribed antibiotics is derived by dividing the number of individuals prescribed antibiotics within each syndrome by the total number of individuals within that syndrome. Abbreviations: PCR, polymerase chain reaction; US Flu VE, US Influenza Vaccine Effectiveness.
Among all enrolled patients, 7% received antivirals within 7 days of their outpatient visit (Table 1). Among patients who tested influenza positive by research testing, 12% and 47% received antibiotics and antiviral prescriptions if they received an influenza code (n = 2209) compared with 30% and 10%, respectively, if they did not receive an influenza code (n = 7450).
Vaccine Effectiveness
Overall, 42% of influenza-positive patients and 53% of influenza-negative patients were vaccinated against influenza (Table 1). After adjusting for potential confounders, the overall VE against laboratory-confirmed influenza in patients with any ARI syndrome was 35% (95% confidence interval [CI], 32–39%) and VE by tier was 56% (95% CI, 39–68%) for tier 1, 35% (95% CI, 29–41%) for tier 2, and 36% (95% CI, 32–40%) for tier 3. Vaccine effectiveness ranged from 23% to 56% by syndrome, recognizing that there may be more than 1 VE estimate associated with some of the study patients (Table 3).
Estimated Proportion of Each Acute Respiratory Illness Syndrome Prevented Through Influenza Vaccination and the Proportion of Antibiotic Prescriptions for Tiers of Acute Respiratory Illnesses Averted Through Influenza Vaccination: US Flu VE Network, 2013–2018
| Tier/Syndromea | (1) Adjusted VE Against Influenza,b % (95% CI) | (2) Prevalence of Influenza in Unvaccinated Persons,c % | (3) Percentage Vaccinated Among Influenza-negative Patients | (4) Prevalence of Antibiotic Prescriptions Among Unvaccinated Influenza-positive Persons, % | (5) Prevalence of Antibiotic Prescriptions in All Persons With ARI, % | (1 × 2 × 3) Proportion of Total ARI Visits Prevented by Influenza Vaccination, % | ([1 × 2 × 3 × 4]/5) Overall Proportion of Antibiotic Prescriptions Averted From Influenza Vaccination, % (95% Uncertainty Bound) |
|---|---|---|---|---|---|---|---|
| Overall | 35 (32–39) | 30.0 | 53.0 | 24.3 | 35.5 | 5.6 | 3.8 (3.6–4.1) |
| Tier 1 | 56 (39–68) | 25.5 | 59.1 | 78.4 | 79.3 | … | 8.3 (6.9–9.8) |
| Pneumonia | 56 (39–68) | 25.5 | 59.1 | NA | NA | 8.4 | NA |
| Tier 2 | 35 (29–41) | 22.2 | 48.9 | 42.9 | 54.7 | NA | 3.0 (2.8–3.3) |
| Pharyngitis | 33 (25–41) | 26.1 | 45.6 | NA | NA | 3.9 | NA |
| Sinusitis | 30 (16–43) | 17.2 | 53.9 | NA | NA | 2.8 | NA |
| Otitis media | 39 (24–52) | 15.6 | 49.5 | NA | NA | 3.0 | NA |
| Tier 3 | 36 (32–40) | 35.0 | 55.3 | 15.3 | 22.8 | NA | 4.7 (4.3–5.1) |
| VURTI | 33 (28–38) | 27.9 | 54.4 | NA | NA | 5.0 | NA |
| Bronchitis | 23 (9–35) | 25.4 | 57.3 | NA | NA | 3.3 | NA |
| Allergy or asthma | 28 (15–39) | 21.9 | 56.8 | NA | NA | 3.5 | NA |
| Clinical influenza | 33 (22–43) | 67.7 | 49.4 | NA | NA | 11.0 | NA |
| Other | 35 (30–40) | 30.0 | 54.1 | NA | NA | 5.7 | NA |
Abbreviations: ARI, acute respiratory illness; ICD-9/10, International Classification of Diseases, Ninth and Tenth Revision; NA, not applicable (because each syndrome is not mutually exclusive and thus syndrome-specific estimates were not calculated); US Flu VE, US Influenza Vaccine Effectiveness; VE, vaccine effectiveness; VURTI, viral upper respiratory tract infection.
aDiagnoses were assigned to the mutually exclusive tier with greatest indication for antibiotic treatment. Patient medical encounter may have diagnostic codes for ≥1 syndrome, which were thus not mutually exclusive. Syndromes were defined by the first 4 ICD-9/10 codes. Syndrome total and percentages do not add up to the total number of individuals.
bVE against laboratory-confirmed, influenza-positive tier or syndrome, adjusted for season, study hospital, current-season influenza vaccination status, sex, age group, race/ethnicity, days from illness onset to specimen collection, high-risk condition year prior to enrollment, self-rated general health status, and onset month.
cThis is under the assumption that the prevalence reflected the baseline prevalence of influenza among ARI patients in the respective communities.
Prevented Proportion of each Acute Respiratory Illness Syndrome Due to Influenza Vaccination
Among unvaccinated enrollees, those testing positive for influenza varied by clinical syndrome, ranging from 16% (otitis media) to 68% (clinical influenza) (Table 3). Based on VE and vaccination coverage, we estimated that influenza vaccination prevented 5.6% of all ARI syndromes in ambulatory care settings during the study period, with a range of 2.8% (sinusitis) to 11% (clinical influenza) for each of the clinical syndromes (Table 3).
Averted Proportion of Antibiotic Prescriptions Due to Influenza Vaccine
We estimated that influenza vaccination averted 3.8% (95% uncertainty bound, 3.6–4.1%) of total antibiotic prescriptions among patients with ARI in ambulatory care settings during the 5 influenza seasons studied. This reduction largely reflects reduction in antibiotic prescriptions among patients in tier 2 (3.0%; 95% uncertainty bound, 2.8–3.3%) and tier 3 (4.7%; 95% uncertainty bound, 4.3–5.1%) categories (Table 3). In sensitivity analyses, we varied influenza VE from 40% to 70% and influenza vaccination coverage from 60% to 100% to see how different combinations could affect the potential reductions in antibiotic prescriptions for ARI. Using the previous targets of an influenza VE of 60% and an influenza vaccination coverage of 70% [17, 18] for all age groups, we estimated 9% of antibiotic prescriptions for ARI could be prevented (see Supplementary Material 2).
Discussion
Based on 5 seasons of data, we estimated that influenza vaccination prevented 5.6% of outpatient visits for ARI. During this period, practitioners prescribed antibiotics for 36% of all ARI visits and for 26% of influenza-associated ARI visits. Thus, we estimate that influenza vaccination averted 3.8% of all antibiotic prescriptions for outpatient ARI visits during the study period. Assuming that ARI accounts for approximately 41% of the 270 million courses of oral antibiotics that are dispensed from US outpatient pharmacies are related to ARI, influenza vaccination may avert approximately 4.2 million antibiotic courses each year in the United States alone [6, 19]. Therefore, it is likely that the influenza vaccination program contributed to reduced antibiotic prescriptions and use in the United States.
Our findings are consistent with previous research that suggests that antibiotics are overprescribed for ARI syndromes for which they are not indicated. Studies have estimated that 11% to 43% of patients with influenza may receive an antibiotic prescription [20–22]. In a study from 1997–2009 representing 90 million US enrollees, an estimated approximately 6.6 million antibiotic prescriptions were provided annually to patients with influenza [19]. A recent systematic review of randomized clinical trials of influenza vaccine versus placebo demonstrated that vaccination reduced the number of days adults took antibiotics for febrile illness by 28% and also reduced community use of antibiotics in children by 31% [8]. These findings support our hypothesis that, under current treatment practices, reducing illnesses related to influenza by vaccination could translate to reductions in antibiotic prescriptions.
Studies suggest that enhancing the early recognition of influenza among patients with ARI using molecular-based, point-of-care diagnostic assays may facilitate appropriate and timely initiation of antiviral treatment and potentially further reduce antibiotic usage [23–27]. The 2018 Infectious Diseases Society of America’s guidelines recommend that clinicians test for influenza in high-risk patients and consider testing non–high-risk patients if testing will influence “antiviral treatment decisions or reduce use of unnecessary antibiotics” [28]. Clinical symptoms and signs are poor predictors of influenza diagnosis and thus reliance on these indicators may lead to misinformed treatment practices such as overprescribing antibiotics [29–32]. Our results could inform cost-utility and decision analyses that explore the economic and public health trade-offs of increasing use of influenza diagnostic assays in outpatient settings. Research testing (where results were not available for clinical decision making) for influenza in outpatients with ARI highlights that, in the absence of laboratory testing, influenza is an underdiagnosed cause of ARI. While clinical testing was not interfered by research testing and was infrequently performed in the US Flu VE Network, a substantially smaller proportion of patients who received a diagnosis of influenza and were PCR positive for influenza by research testing received antibiotics (12%) compared with those without an influenza code who were PCR positive (30%). Patients whose illness was coded as influenza and who were PCR positive were also more likely to be prescribed influenza antiviral treatment (47%) compared with those whose visits were assigned noninfluenza codes (10%). Reversing this “antibiotic-antiviral paradox” in patients with ARI during months of peak influenza activity could substantially reduce antibiotic use and potentially improve clinical outcomes among patients with influenza. Timely and accurate diagnosis of influenza could guide clinical care, specifically reducing antibiotic usage and implementing appropriate and timely antiviral treatment [23–27].
Our results should be interpreted in the context of some limitations. Antibiotic prescription practices in the US Flu VE Network may not be generalizable to the United States and warrants further investigation through evaluation of representative datasets. Each study site may have specific institutional clinical guidelines or prescribing practices that influence clinician decision making. It is possible that, because research testing for influenza has been conducted for several years at the study sites, practitioners have heightened awareness of influenza activity and thus their clinical ARI practices may not be representative of US practitioners. If vaccines attenuate disease severity, the likelihood to receive antibiotics may also be affected. The test-negative design could also result in biased estimates of VE [33]. Additionally, we cannot be certain that patients took the prescribed antibiotics. We relied on antibiotic prescribing because dispensing information was not available. We also assumed that antibiotic prescription was related to the ARI visit, but there was no way to verify the validity of assigned diagnoses. Notably, because enrolled patients had 7 days or fewer of cough, some patients diagnosed with acute sinusitis would likely not meet the most common diagnostic criterion (10 days of persistent symptoms). However, this limitation would not affect our results, as influenza vaccination could still prevent the patients’ ARI and the antibiotic they received. Additionally, influenza may present without a cough, especially in children, and the case definition may underestimate the number of influenza cases. As otitis media may or may not require antibiotics based on presentation and severity, we assigned patients with any type of otitis media to tier 2 to be conservative. Additionally, the use of ICD-9-CM and ICD-10-CM codes may not accurately reflect clinical decision making and decisions to prescribe antibiotics but should not affect estimates of reductions in antibiotic prescriptions as long as antibiotics were prescribed to patients with ARI visits associated with influenza. Last, in a previous simulation study, a similar method to the one used in our study for the approximation of the proportion of medically attended, all-cause ARI averted by influenza vaccination produced a small overestimate but was still used in our study because data needed for a more precise estimate were not available.
Our study provides empiric, real-world evidence from a large multisite study conducted over 5 influenza seasons that influenza vaccination not only directly reduces medical visits for influenza-associated ARI but also reduces antibiotic use by preventing ARI outpatient visits for which antibiotics are commonly prescribed. Improvements in influenza vaccine coverage and effectiveness, combined with efforts to reduce antibiotic use and improved diagnosis and recognition of influenza, are important strategies to decrease antibiotic prescriptions and therefore mitigate the rise in antibiotic resistance.
Supplementary Data
Supplementary materials are available at Clinical Infectious Diseases online. Consisting of data provided by the authors to benefit the reader, the posted materials are not copyedited and are the sole responsibility of the authors, so questions or comments should be addressed to the corresponding author.
Notes
Acknowledgments. The authors acknowledge the work and support of all members of the US Flu Vaccine Effectiveness Team for their efforts in enrollment of the participants in this evaluation.
Disclaimer. The findings and conclusions in this report are those of the authors and do not necessarily represent the official position of the Centers for Disease Control and Prevention.
Financial support. This work was supported by the Centers for Disease Control and Prevention (cooperative agreements U01IP001034–U01IP001039). At the University of Pittsburgh, the project was also supported by the National Institutes of Health (grant number UL1TR001857).
Potential conflicts of interest. Within 3 years, R. K Z. has received grants from Merck & Co, Pfizer Inc, and Sanofi Pasteur on unrelated topics. H. Q. M. receives research support from Seqirus, unrelated to this work. A. S. M. reports consulting fees from Sanofi and Seqirus, outside the submitted work. E. T. M. reports personal fees from Pfizer, outside the submitted work. J. F. reports travel support from Institute for Influenza Epidemiology (funded in part by Sanofi Pasteur), outside the submitted work. M. G. reports grants from the Centers for Disease Control and Prevention, Janssen, and Astra Zeneca/MedImmune, outside the submitted work. M. L. J. reports grants from Sanofi Pasteur, outside the submitted work. M. P. N. reports grants from Merck & Co and Pfizer Inc, outside the submitted work. All other authors report no potential conflicts. All authors have submitted the ICMJE Form for Disclosure of Potential Conflicts of Interest. Conflicts that the editors consider relevant to the content of the manuscript have been disclosed.

