


Abstract
Antimicrobial resistance (AMR) constitutes an international public health threat widely believed to result from excessive antimicrobial use (AMU). Numerous authorities have recommended antimicrobial stewardship programs (ASPs) to curb the selection of AMR, but there is a lack of data confirming this benefit.
A controlled interrupted time-series study spanning 14 years was performed to assess impact of a comprehensive hospital-based ASP that included pharmacist-led audit and feedback on institutional AMR. Patient-level microbiologic and AMU data were obtained from October 2002 to September 2016. Poisson regression models were used to identify changes in the incidence and trend of hospital-acquired (HA) antibiotic-resistant organisms (AROs) and multidrug-resistant organisms (MDROs). Changes in community-acquired (CA)–ARO, CA-MDRO, and inpatient AMU were assessed as controls and process outcomes.
Statistically significant shifts in AMU, HA-ARO, and HA-MDRO trends coinciding with ASP implementation were observed, corresponding with a 9% reduction in HA-ARO burden (incidence rate ratio [IRR], 0.91 [95% confidence interval {CI}, .83–.99]; P = .03) and a 13% reduction in HA-MDRO burden (IRR, 0.87 [95% CI, .73–1.04]; P = .13) in the intervention period. In contrast, CA-ARO and CA-MDRO incidence continued to rise, with 40% (IRR, 1.40 [95% CI, 1.28–1.54]; P < .0001) and 68% (IRR, 1.68 [95% CI, 1.57–1.82]; P < .0001) increases in burden found, respectively.
Implementation of a comprehensive ASP resulting in reduced AMU was associated with a significant reduction in institutional AMR, even though community AMR increased during the same period. These results confirm that ASPs play an important role in the fight against AMR.
Antimicrobial resistance (AMR) represents an emerging threat to modern medicine [1]. Excessive and indiscriminate antimicrobial use has promoted the selection and spread of antibiotic-resistant organisms (AROs), and with few new agents active against these resistant isolates, the clinical and economic impact of this problem is reaching a crisis level. The Centers for Disease Control and Prevention estimates that >23 000 American citizens die from AROs each year [2]. The annual global death toll is currently estimated at 700 000 lives [3]; if current trends continue, AMR-attributable mortality is projected to reach 10 million by the year 2050 with a cumulative economic cost over US$100 trillion [3].
Implementing institutional antimicrobial stewardship programs (ASPs) has been identified as a method to curb the development of AMR [4–6]. While ASPs have demonstrated positive impact on antibiotic utilization [6–9], there is a paucity of high-quality data evaluating the impact of ASP interventions on the selection of AMR [6, 10]. The latest Cochrane Review on ASPs and a State of the Science review published in July 2018 concluded that there is no solid evidence that ASPs are effective in reducing AMR in hospital settings [6, 10]. This evidence is crucial to validating antimicrobial stewardship theory.
The objective of this study was to evaluate the long-term impact of a comprehensive ASP on the selection of AMR. We hypothesized that implementation of a comprehensive ASP would significantly decrease institutional AMR compared to trends in the community.
METHODS
Study Design
A 14-year retrospective interrupted time-series design was used to evaluate temporal changes in the institutional burden of AMR and inpatient antibiotic use at a large academic hospital where a comprehensive ASP was implemented on 1 October 2009. The study period spanned 1 October 2002 to 30 September 2016 to provide a 7-year baseline period preceding ASP implementation (1 October 2002–30 September 2009; 84 months) and a 7-year intervention period (1 October 2009–30 September 2016).
Study Setting and Population
The Bayview Campus of Sunnybrook Health Sciences Centre (SHSC) is a 627-bed teaching hospital that provides the full range of acute medical and surgical services. All adults (≥17 years of age) admitted to the Bayview Campus for inpatient care during the 14-year study period were included in the study population. Neonates and women admitted to obstetrics were excluded, since the comprehensive ASP interventions were not implemented in these patient populations.
Intervention
A multidisciplinary comprehensive ASP was introduced on 1 October 2009 aligned with best practices as recommended by published guidelines [4]. This program involved dedicated infectious diseases physicians and pharmacists providing regular service-specific education, hospital-wide antimicrobial guidelines, formulary restrictions, and pharmacist-led prospective audit and feedback (PAF) for specific targeted antimicrobials, including intravenous meropenem, ertapenem, piperacillin-tazobactam, ceftriaxone, ceftazidime, vancomycin, gentamicin, tobramycin, and amikacin; plus intravenous/oral ciprofloxacin, levofloxacin, and moxifloxacin. PAF was performed 5 days per week for patients on days 3, 7, and 14 of therapy with both verbal and written recommendations made to the most responsible physician. Implementation of PAF began in critical care units [11] and was followed by staggered implementation to all inpatient medical/surgical units until the intervention was fully implemented on all units by 1 April 2012 [12]. Additional details regarding implementation and uptake of ASP interventions have been described previously [11–14], and a detailed timeline is provided in Supplementary Figure 1.
Antibiotic Resistance Outcomes
The primary outcome was the monthly incidence of hospital-acquired (HA)–ARO among clinical isolates. The secondary outcome was the monthly incidence of HA multidrug-resistant organisms (MDROs) among clinical isolates. Monthly incidence of community-acquired (CA)–ARO and CA-MDRO in clinical isolates were assessed as control outcomes. Monthly counts of resistant isolates were standardized by 10 000 patient-days to yield monthly incidences.
Clinical isolates were defined as bacteria cultured from clinical specimens (ie, specimens collected for the purpose of assisting with the diagnosis of an infection). Isolates grown from screening swabs, surveillance swabs, or other cultures sent for infection prevention and control purposes were excluded (ie, nasal and rectal swabs). Hospital-acquired organisms were defined as clinical isolates collected from inpatients >48 hours after admission, in keeping with the standard definition of hospital-acquired infection [15, 16]. Community-acquired organisms were defined as clinical isolates collected from inpatients within 48 hours of admission (ie, ≤48 hours).
AROs were defined as clinical isolates exhibiting resistance to at least 1 therapeutically active antibiotic agent [17]. MDROs were defined as clinical isolates exhibiting resistance to 3 or more antibiotic classes [17]. All isolates were classified as susceptible or resistant in accordance with the Clinical and Laboratory Standards Institute guidelines active at the time of collection [18]. Isolates with intermediate susceptibility were considered resistant.
Culture and sensitivity data for clinical isolates of Escherichia coli, Klebsiella species, Morganella morganii, Proteus mirabilis, Proteus vulgaris, Providencia species, Serratia species, Citrobacter species, Enterobacter species, Pseudomonas aeruginosa, Acinetobacter species, Enterococcus species, and Staphylococcus aureus were included. Isolate-level data were extracted from the Microbiology Laboratory Information System to generate aggregate monthly counts of nonduplicate clinical isolates across all these species. Duplicate isolates, defined as same-species isolates with identical susceptibility profiles collected from a single inpatient within 14 days, were removed from the data set to minimize bias.
Antibiotic Use Outcomes
Monthly incidence of targeted antibiotic use, nontargeted antibiotic use, and total antibiotic therapy were assessed as process outcomes. Targeted antibiotics were defined as systemic agents targeted by the PAF-ASP intervention. Nontargeted antibiotics were defined as systemic agents not audited by the PAF but optimized through other ASP activities such as antimicrobial guidelines, targeted education, formulary restriction, and β-lactam allergy skin testing [14]. Total antibiotic therapy included all targeted and nontargeted antibiotics. Antibiotic use was measured using days of therapy (DOT), defined as the number of days that a patient is on a specific antibiotic agent, regardless of dose. DOT-level dispensing data for inpatient antibiotic orders placed during the study period were extracted from the SHSC Pharmacy Department Database. Individual DOT data were aggregated and analyzed as monthly DOT counts. To be consistent with the primary and secondary AMR outcomes, monthly DOT counts were standardized by 10 000 patient-days to yield monthly DOT incidences.
Covariate Data
Bed-occupancy data (ie, patient-days) and length of stay data were extracted from the SHSC Health Data Resources Database. Patient day and length of stay data were extracted as institution-wide aggregate counts for each study month. As a surrogate for culture requisition rate, the “positive culture rate” was determined for each month in the study period using the isolate-level microbiologic data extracted for the primary, secondary, and control outcomes. This rate was determined for both HA and CA isolates and reflected the aggregate count of bacterial isolates (ie, sensitive and resistant) in a given study month.
Statistical Analyses
For base-case analyses, Poisson regression models were used to test for PAF-ASP associated changes in the trend (ie, incremental rate change across months in the baseline or implementation periods) and level (change in the average monthly rate between the baseline and implementation periods) of each AMR and antibiotic use outcome. These models utilized baseline and implementation periods of 84 months in duration (baseline period: October 2002–September 2009; implementation period: October 2009–September 2016). The outcome parameter was monthly AMR or antibiotic use frequency (ie, HA-ARO, HA-MDRO, CA-ARO, CA-MDRO, targeted antibiotic use, nontargeted antibiotic use, and total antibiotic therapy) offset by hospital bed-occupancy (ie, monthly patient-days count). SAS version 9.4 software was used for trend and level analyses (SAS Institute, Cary, North Carolina). A power calculation for the primary outcome, HA-ARO, was completed using NCSS PASS software version 12 (NCSS LLC, Kaysville, Utah). Assuming a baseline monthly HA-ARO of 124 and an overdispersion parameter of 3.60 (from pilot data), a sample of 108 observations would provide a Poisson regression with 80% power at a .05 significance level to detect a 9% reduction (incidence rate ratio [IRR], 0.907). The calculation also accounts for an R2 of 0.10 between covariates in the Poisson regression model.
For trend analyses, study phase, study month, a study phase × study month interaction term, and season were included as fixed factors (ie, predictors). Statistically significant differences in baseline and intervention period trends were inferred when the study phase × study month interaction term was significant at P < .05. Then, baseline and intervention period trends were further examined by separate models with study month as the only predictor. Coefficient estimates for study month >1 implied increasing monthly rates across the period, and <1 implied decreasing monthly rates across the period.
For level analyses, study phase and season were included as fixed factors, and the model was built in a time-series component with study month as a random effect following an autoregressive pattern. Statistically significant differences in the average monthly rate between the baseline and intervention periods were inferred when the study phase coefficient was significant at P < .05. Differences in the level of each outcome were reported as an IRR of the intervention period average monthly incidence divided by the baseline average monthly incidence. An IRR >1 denoted an increase in average incidence in the intervention period. An IRR <1 denoted a decrease in average incidence in the intervention period.
Five sensitivity analyses were performed for AMR outcomes to increase analysis rigor. These analyses adjusted for the effect of various potential confounders including definitions for HA, CA, and duplicate isolates; patient length of stay; clinical culture requisition rates; and interventions to control ARO transmission. A detailed description of the sensitivity analyses and model-fitting considerations are provided in the Supplementary Methods.
Ethical Considerations
This study was approved by the SHSC Research Ethics Board (project identification number 236–2016).
RESULTS
A total of 62 405 clinical bacterial isolates collected from 34 124 inpatients (mean age, 67 years; 45% male) were identified, and 54 602 of these isolates were unique. Of the unique isolates, 11 607 (21%) were obtained from patients admitted to level III intensive care units, 11 607 (33%) from patients in the emergency department, and 24 830 (45%) from patients on other wards. There were 28 444 (52%) HA isolates, 26 158 (48%) CA isolates and 41 678 (76%) gram-negative bacilli overall. Enterobacteriaceae accounted for 34 686 (83%) of the gram-negative bacilli, of which E. coli was the most common species (19 200 [46%]). Urine cultures were the most common clinical specimen type (27 779 [51%]), with remaining clinical specimens coming from blood (7492 [14%]), sputum (7661 [14%]), and other sources (11 673 [21%]). The mean monthly length of stay for the complete study period, baseline period, and intervention period were 7.5 days, 8.5 days, and 6.4 days, respectively. Additional demographic information and monthly incidence for various groups of clinical isolates are provided in Supplementary Tables 1–4.
Antimicrobial Resistance Outcomes
There were 41 002 (75%) isolates meeting the definition of ARO and 17 072 (31%) meeting the definition of MDRO. Figure 1 displays the monthly interrupted time series for HA-ARO, HA-MDRO, CA-ARO, and CA-MDRO. Table 1 summarizes the mean monthly incidence for each of these outcomes for the baseline and intervention periods and results of the trend and level analyses. Statistically significant pivots in time-series trend coinciding with ASP implementation were detected for HA-ARO and HA-MDRO. A 9% reduction in HA-ARO burden (IRR, 0.91 [95% confidence interval {CI}, .83–.99]; P = .03) and a 13% reduction in HA-MDRO burden (IRR, 0.87 [95% CI, .73–1.04]; P = .13) were detected in the intervention period. In contrast, monthly rates of CA-ARO and CA-MDRO continued on an upward trajectory throughout the baseline and implementation periods, with a 40% increase in CA-ARO burden (IRR, 1.40 [95% CI, 1.28–1.54]; P < .0001) and a 68% increase in the CA-MDRO burden (IRR, 1.68 [95% CI, 1.57–1.82]; P < .0001) detected in the intervention period.
Mean Incidence Rates and Trend and Level Analyses for Primary, Secondary, and Process Outcomes
| Outcome | Mean Monthly IR for Baselinea | Mean Monthly IR for the Intervention Perioda | Trend for Baselineb (95% CI) | Trend for Interventionb (95% CI) | IRRc (95% CI) |
|---|---|---|---|---|---|
| HA-ARO | 108 | 98 | 1.005 (1.004–1.005) | 0.998 (.997–.999) | 0.91 (.83– .99) |
| HA-MDRO | 50 | 43 | 1.010 (1.008–1.011) | 0.997 (.996–.998) | 0.87 (.73–1.04) |
| CA-ARO | 68 | 99 | 1.004 (1.003–1.005) | 1.005 (1.004–1.006) | 1.40 (1.28–1.54) |
| CA-MDRO | 24 | 41 | 1.009 (1.007–1.010) | 1.005 (1.003–1.006) | 1.68 (1.57–1.82) |
| Targeted antibiotic use | 3424 | 2692 | 1.007 (1.006–1.007) | 0.998 (.998–.998) | 0.98 (.87–1.10) |
| Nontargeted antibiotic use | 3186 | 2516 | 1.002 (1.002–1.002) | 0.998 (.998–.998) | 0.93 (.83–1.04) |
| Total antibiotic therapy | 6611 | 5207 | 1.004 (1.004–1.004) | 0.998 (.998–.998) | 0.94 (.85–1.04) |
Abbreviations: CA-ARO, community-acquired antibiotic-resistant organism; CA-MDRO, community-acquired multidrug-resistant organism; CI, confidence interval; HA-ARO, hospital-acquired antibiotic-resistant organism; HA-MDRO, hospital-acquired multidrug-resistant organism; IR, incidence rate; IRR, incidence rate ratio.
aMean monthly count of resistant isolates or days of therapy standardized by 10 000 patient-days.
bIncremental change across sequential months in the period; coefficients >1 indicate increasing monthly rates across the period and coefficients <1 indicate decreasing monthly rates across the period.
cIncremental change from the baseline to intervention period; analyses-adjusted ratio of the mean monthly incidence in the intervention period to the mean monthly incidence in the baseline period (adjusted).
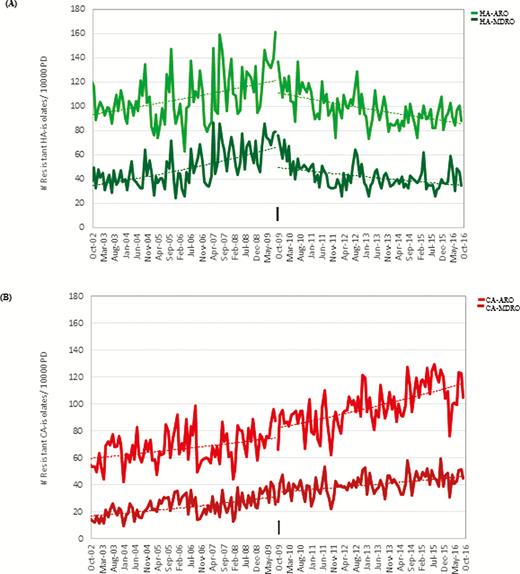
A, Trends in the monthly incidence of hospital-acquired antibiotic-resistant organisms (HA-ARO) and hospital-acquired multidrug-resistant organisms (HA-MDRO) at Sunnybrook Health Sciences Centre (SHSC) over the 14-year (168 months) study period. Monthly incidence is shown as an aggregate count standardized by 10 000 patient-days (PD) (number of AROs per 10 000 PD). The pivot in HA-ARO and HA-MDRO trend coinciding with implementation of the acute care antimicrobial stewardship program (ASP; black arrow) suggests that implementation was associated with improvements in nosocomial resistance rates. B, Trends in community-acquired antimicrobial-resistant organisms (CA-ARO) and community-acquired multidrug-resistant organisms (CA-MDRO) at SHSC over the 14-year (168 months) study period. Monthly incidence is shown as an aggregate count standardized by 10 000 PD (number of AROs per 10 000 PD). The continued increases in CA-ARO and CA-MDRO seen post–ASP implementation suggest no ASP-associated improvements in community resistance rates. Abbreviations: CA-ARO, community-acquired antimicrobial-resistant organisms; CA-MDRO, community-acquired multidrug-resistant organisms; HA-ARO, hospital-acquired antibiotic-resistant organisms; HA-MDRO, hospital-acquired multidrug-resistant organisms.
Antimicrobial Use Outcomes
Total antibiotic therapy prescribed was 1 222 442 DOT, with 607 344 (50%) targeted antibiotic DOT and 615 098 (50%) nontargeted antibiotic DOT. Figure 2 displays monthly DOT use per 10 000 patient-days for these outcomes. Results of the trend and level analyses are provided in Table 1. Statistically significant pivots in time-series trend were detected for all antibiotic use outcomes, which stabilized consumption of targeted antibiotics (IRR, 0.98 [95% CI, .87–1.10]; P = .73), nontargeted antibiotics (IRR, 0.93 [95% CI, .83–1.04]; P = .22) and total antibiotic therapy (IRR, 0.94 [95% CI, .85–1.04]; P = .22) in the intervention period.
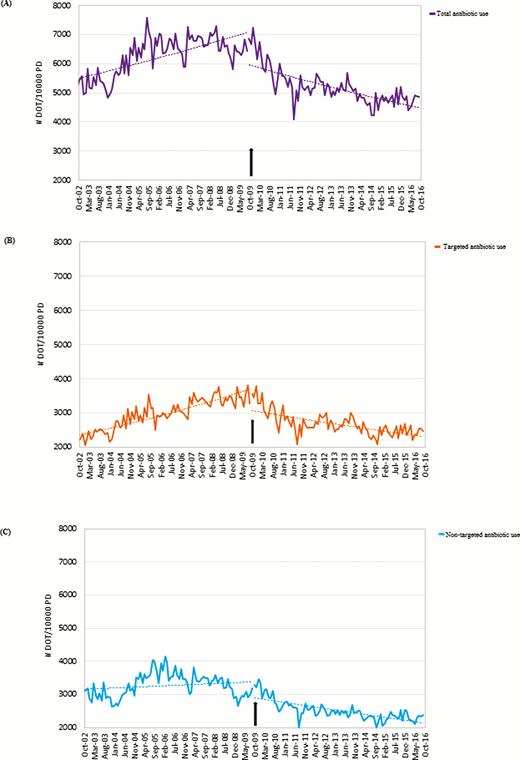
Trends in total antibiotic therapy (A), targeted antibiotic use (B), and nontargeted antibiotic use (C) at the Sunnybrook Health Sciences Centre acute care facility. Antimicrobial use is shown in days of therapy (DOT) standardized by 10 000 patient-days (PD) (DOT per 10 000 PD). The pivots in total antimicrobial use (A), targeted antimicrobial use (B), and nontargeted antimicrobial use (C) trends coinciding with implementation of the acute care antimicrobial stewardship program (ASP; black arrow) suggest that ASP implementation was associated with improvements in inpatient antibiotic use. Abbreviations: DOT, days of therapy; PD, patient-days.
Sensitivity Analyses
Statistically significant pivots in HA-ARO and HA-MDRO trends coinciding with ASP implementation were detected in all sensitivity model conditions. Reductions in intervention period HA-ARO burden were detected in all sensitivity model conditions (IRR range, 0.84–0.91). Sensitivity analyses for HA-MDRO demonstrated improvements or stable intervention period levels (IRR range, 0.75–1.00). Increasing CA-ARO and CA-MDRO trends were found for all sensitivity model conditions, with significant increases in intervention period burden detected in almost all convergent analyses (IRR range, 0.97–1.41). Details are provided in Supplementary Table 5.
DISCUSSION
In this 14-year observational study, we found that implementation of a comprehensive ASP was associated with a sustained reduction in the institutional burden of AMR, as determined by the 9.3% and 12.6% decreases in the incidence of HA-ARO and HA-MDRO, respectively. This reversal in AMR was observed despite the fact that institutional AMR was increasing in our hospital prior to ASP implementation and continued to increase in the community throughout the same time period. The impact on institutional AMR mirrored reductions in inpatient antibiotic use, which further supports the relationship between the interventions of our comprehensive ASP and curbing of the selection of HA-AMR.
The link between antibiotic use and AMR has been documented since shortly after the discovery of the first antibiotic agents, which has prompted increased attention to decreasing antibiotic overuse. However, there remains a paucity of high-quality data describing the impact of ASPs on hospital AMR [6, 10]. Fewer than 30 of the 220 quantitative studies included in the latest Cochrane Review on ASPs [6] reported AMR outcomes, and only 2 studies [19, 20] were assessed as having “low risk of bias” as per the dual risk of bias criteria. However, these studies reported on a narrow spectrum of resistance profiles (ie, methicillin-resistant Staphylococcus aureus [19] and E. coli resistant to ciprofloxacin, cefuroxime, ceftazidime, trimethoprim-sulfamethoxazole, and tobramycin [20]) over a relatively short time period (ie, 1–2 years post–ASP implementation). Additionally, these studies failed to address potential confounders and did not validate their findings in control populations unexposed to the ASP intervention.
Our study was designed to avoid these limitations and to meet the high-quality standards applied by the ASP Cochrane Review group (Supplementary Tables 6 and 7) [6, 21, 22]. In the present study, HA-AMR incidence was the primary outcome, which included the collective susceptibility of >15 bacterial pathogens to more than 15 antimicrobial agents each, while CA-AMR was used as a concurrent control. By including an extended intervention period (84 months), these findings also demonstrate the sustainability of ASP-mediated effects.
Reducing AMR is a major incentive for ASPs; however, the lack of high-quality AMR outcome data has been cited as a barrier to program support [23]. Our study addresses this gap in the literature and provides evidence demonstrating the effectiveness of a comprehensive ASP for reducing institutional AMR. Although institutional differences in ASP programming may limit the generalizability of these research findings, the results of this research provide important support for both the clinical benefits and cost savings that could be realized by reducing HA-AMR with the implementation of comprehensive ASPs (see Discussion in the Supplementary Appendix).
Our study has several important limitations. First, improvements in Infection Prevention and Control practices were made during the baseline period, which could have reduced hospital acquisition of ARO and MDRO; however, the reduction in HA-ARO and HA-MDRO remained in the sensitivity analyses accounting for introduction of our hand hygiene program. It is possible that changes in ARO screening policies, compliance with contact precautions, environmental cleaning practices, or patient case-mix occurred in the intervention period to bias study results. However, data to characterize any such changes were not available to include in the base-case or sensitivity models. Limitations related to the criteria used to classify HA and CA isolates are acknowledged, as these have not been validated, do not account for recent healthcare exposure, and do not address the possibility of prolonged ARO or MDRO carriage. However, these definitions are consistent with those used in prior studies [15, 16] and were tested in sensitivity analyses. Our control group using CA isolates may not represent an equivalent comparison to HA isolates but reflects the increasing trend in AMR observed in the broader community during this time period. Inclusion of clinical isolates from nonsterile sites in ARO and MDRO case definitions is another limitation (ie, inclusion of isolates potentially reflecting asymptomatic colonization or carriage) that likely overestimated true rates of ARO and MDRO infections. However, as these definitions were applied across the entire study period, this limitation should have no impact on the relative changes detected by Poisson regression analyses.
Implementation of a comprehensive ASP resulting in reduced antibiotic use was associated with a significant reduction in institutional AMR, even though community AMR increased during the same period. These results confirm that ASPs play an important role in the fight against AMR.
Supplementary Data
Supplementary materials are available at Clinical Infectious Diseases online. Consisting of data provided by the authors to benefit the reader, the posted materials are not copyedited and are the sole responsibility of the authors, so questions or comments should be addressed to the corresponding author.
Notes
Author contributions. The project idea and overarching design concept was that of S. A. N. W.; C. P., S. A. N., J. A. L., A. S., and S. E. W. contributed to study design; data collection was done by C. P.; data analysis was done by C. P. and A. K; and A. K. (statistician) was the primary analyst. All authors reviewed and approved the final manuscript.
Acknowledgments. The authors thank Arnold Tralla for his assistance with data extraction from the Sunnybrook Health Sciences Centre (SHSC) microbiology database, and Michael Ritchie for his assistance with data extraction from the SHSC pharmacy department database.
Disclaimer. The funding source had no involvement in study design, data collection, data analysis, interpretation of data, the writing of the report, or the decision to submit the paper for publication.
Financial support. This work was supported by the 2016–2017 Making a Difference in Infectious Diseases (MAD-ID) Antimicrobial Stewardship Research Grant (grant number 1015482).
Potential conflicts of interest. The authors: No reported conflicts of interest. All authors have submitted the ICMJE Form for Disclosure of Potential Conflicts of Interest.
References
Review on Antimicrobial Resistance; O’Neill J.

