


Abstract
Antimicrobial resistance in Mycoplasma genitalium (MG), a cause of urethritis, is a growing concern. Yet little is known about the geographic distribution of MG resistance in the United States or about its associated clinical outcomes. We evaluated the frequency of MG among men with urethritis, resistance mutations, and posttreatment symptom persistence.
We enrolled men presenting with urethritis symptoms to 6 US sexually transmitted disease (STD) clinics during June 2017–July 2018; men with urethritis were eligible for follow-up contact and, if they had persistent symptoms or MG, a chart review. Urethral specimens were tested for MG and other bacterial STDs. Mutations in 23S ribosomal ribonucleic acid (rRNA) loci (macrolide resistance–associated mutations [MRMs]) and in parC and gyrA (quinolone-associated mutations) were detected by targeted amplification/Sanger sequencing.
Among 914 evaluable participants, 28.7% (95% confidence interval [CI], 23.8–33.6) had MG. Men with MG were more often Black (79.8% vs 66%, respectively), <30 years (72.9% vs 56.1%, respectively), and reported only female partners (83.7% vs 74.2%, respectively) than men without MG. Among MG-positive participants, 64.4% (95% CI, 58.2–70.3%) had MRM, 11.5% (95% CI, 7.9–16.0%) had parC mutations, and 0% had gyrA mutations. Among participants treated with azithromycin-based therapy at enrollment and who completed the follow-up survey, persistent symptoms were reported by 25.8% of MG-positive/MRM-positive men, 13% of MG-positive/MRM-negative men, and 17.2% of MG-negative men.
MG infection was common among men with urethritis; the MRM prevalence was high among men with MG. Persistent symptoms following treatment were frequent among men both with and without MG.
Multiple studies have implicated Mycoplasma genitalium (MG), a sexually transmitted bacterium first identified in 1980, as an etiology of male urethritis. MG has been detected in 12.5–31% of nongonococcal urethritis (NGU) cases [1–6] and has been associated with persistent and/or recurrent urethritis [7, 8]. Because NGU and gonorrhea are generally treated with an azithromycin-containing regimen (azithromycin at 1 g orally, alone or with ceftriaxone, respectively), men with MG urethritis frequently receive azithromycin as a first-line therapy. Moxifloxacin is recommended for men with persistent/recurrent urethritis who report adherence to an initial recommended therapy and deny sexual reexposure [9].
Emerging MG resistance may complicate treatment. Azithromycin efficacy for MG appears to be declining [10]. Macrolide resistance–associated mutations (MRMs) have been detected in 13.3–88.9% of heterosexual males, 0–75% of females, and 9–89.7% of men who are gay or bisexual and have sex with men [11–15]. The prevalence of MG quinolone resistance–associated mutations (QRMs) may be increasing, and treatment failures after moxifloxacin therapy have been identified [16–20]. Given the lack of additional treatment options in the United States, emerging resistance is concerning. However, few data are available describing the geographic distribution of MG resistance in the United States and the clinical outcomes associated with those MG strains harboring resistance mutations.
We evaluated the MG prevalence among men with urethritis across multiple US sites, as well as the proportion of urethral MG infections with resistance-associated mutations and the persistence of self-reported symptoms following treatment.
METHODS
This multicenter study enrolled men presenting with urethritis symptoms during June 2017–July 2018 at 6 sexually transmitted disease (STD) clinics located in Alabama (Birmingham), North Carolina (Durham and Greensboro), Louisiana (New Orleans), Pennsylvania (Pittsburgh), and Washington (Seattle). Men ≥18 years of age were eligible if they self-reported symptoms of urethritis (ie, dysuria, urethral discharge, and/or meatal itching or tingling), were willing to complete a follow-up survey during study Days 14–17, and were willing and able to provide written informed consent. Men were excluded if they had previously enrolled in the study; were diagnosed with epididymitis, orchitis, prostatitis, or disseminated gonococcal infections; or were deemed by the interviewer to have a condition that might affect their ability to follow the protocol. All study sites received approval from their local institutional review boards.
The protocol anticipated enrollment of ~2200 men to achieve an evaluable population of 2000 men with urethritis and precision of the upper and lower bounds of the 95% confidence interval (CI) for MG prevalence in a given clinic population +/− 5.0%, assuming at least 300 men were enrolled at each clinic and an MG prevalence of ≤25%. Due to a higher than anticipated MG prevalence, study enrollment ceased at 1100 men.
Baseline Data Collection and Laboratory Testing
After providing written consent, participants completed an interviewer-administered questionnaire and underwent a physical examination. A urethral swab specimen was collected, used to create a Gram or methylene blue/gentian violet (MB/GV) stain to quantitate white blood cells (WBC), and placed in the Aptima Combo 2 Assay (Hologic, Inc., San Diego, CA) unisex specimen collection kit. First-catch urine was then collected. Because the detection limit capability of the MG Aptima assay is extremely low (95% CI limit of detection for a male urine specimen of .017–.074 genome equivalents/mL) [21], we did not require men to wait 1 hour after their last urination. A single 2 mL aliquot of urine was transferred into a urine collection kit and transported to the local laboratory for Neisseria gonorrhoeae (NG) and Chlamydia trachomatis (CT) testing. The remaining urine was aliquoted into 2 Aptima Combo 2 Assay (Hologic, Inc., San Diego, CA) urine specimen collection kits. The urethral swab and urine aliquots were shipped to the Centers for Disease Control and Prevention at the Division of STD Prevention’s Laboratory Reference and Research Branch for additional testing.
Participants with evidence of urethritis by Gram or MB/GV stain were included in the primary evaluable population. Participants without urethritis were considered nonevaluable, were discontinued from the study, and did not undergo further follow-up. There were 5 sites that classified a urethral Gram or MB/GV stain with ≥2 WBC per oil immersion field (oif) on at least 3 fields as indicative of urethritis. Based on the local clinic policy, 1 site (Seattle) used a threshold of ≥5 WBCs/oif to indicate urethritis, leading to the initial exclusion of 10 men who met the ≥2 WBC threshold but not the ≥5 WBC criteria. These participants were retrospectively considered evaluable and included in the assessment of MG prevalence, but did not contribute follow-up data. Patients were evaluated, treated, and managed as per local clinic guidelines.
Participant Follow-up
Participants with urethritis at enrollment were asked to complete a telephone-based or electronic survey during Days 14–17 to elicit their symptom status and to ascertain their sexual history and antimicrobial use since enrollment. Study staff made at least 3 attempts within 21 days after enrollment to contact participants who did not complete the survey. Participants who reported persistent symptoms were referred to the STD clinic for reevaluation. Medical records from within 45 days after enrollment were reviewed for evaluable participants who either self-reported persistent symptoms during follow-up contact or who were found to have an MG infection at baseline.
Laboratory Procedures
Diagnostic NG and CT testing of urine specimens was performed at local site laboratories using nucleic acid amplification–based tests, per local standard operating procedures. The Center for Disease Control and Prevention’s Laboratory Reference and Research Branch performed transcription-mediated amplification testing of the urethral swabs and urine specimens to detect MG (Aptima analyte-specific reagents) and Trichomonas vaginalis (TV; Aptima) on the Panther instrument (Hologic, Inc. San Diego, CA). MG-positive specimens were used for resistance testing. If a participant’s urethral swab and urine specimen were both MG-positive, then the urethral swab underwent resistance testing (up to 2 attempts). If amplification failed, the corresponding urine specimen underwent resistance testing (up to 2 attempts). MG positivity was defined as 1 or more specimens from an individual participant that were positive for MG.
Resistance-associated mutations were detected by targeted amplification using nested polymerase chain reaction and Sanger sequencing of base locations 2058 and 2059 (Escherichia coli number) of 23S ribosomal ribonucleic acid (rRNA) loci (MRM) and QRMs in regions of gyrA (DNA gyrase A subunit) and parC (topoisomerase IV subunit A) [22]. Targeted amplification was performed using the TaKaRa Ex Taq (TaKaRa Bio, Inc. Mountain View, CA, USA) master mix according to manufacturer instructions. An “outer” amplicon was first amplified using FP1 and RP1 primers specific to each target, followed by amplification of the “nested” amplicon from the “outer” amplicon using FP2 and RP2 primers specific to each target. Sanger sequencing of the “nested” amplicons was performed using the BigDye Terminator v3.1 Cycle Sequencing Kit according to the manufacturer instructions, using primers FP2 and RP2, specific for each target. Sequencing analysis was performed using Geneious v10 software (Biomatters, Auckland, New Zealand) by comparing sequencing reads to wild-type MG 23S rRNA, gyrA, and parC sequences to identify the genetic variations associated with MRMs and QRMs.
Data Analyses
We calculated unadjusted MG prevalence estimates among all participants in the primary evaluable population with evaluable MG results. The 95% CIs were estimated based on generalized linear models with identity link function and binomial variance. We accounted for within-site clustering when pooling data by scaling the variance estimate using the Pearson Chi-squared statistic, based on evidence of over-dispersion (P < .10 for an overall test of clinic effect) [23].
We calculated overall and site prevalences of NG, CT, and TV, and of coinfections with these pathogens and MG. Exact binomial CIs were used for site-specific estimates of TV and coinfections due to low pathogen positivity. We used logistic regression to explore the association between prespecified sociodemographic and sexual behavioral risk factors and MG infection. Factors significant at the P < .1 level in the univariate analysis were included in the multivariable analysis. We reported odds ratios and 95% CIs for each comparison.
We calculated prevalence (with exact 95% binomial CIs) of MRMs and QRMs among participants with 1 or more MG-positive specimens, both overall and stratified by site and select, prespecified characteristics.
Among participants who completed the follow-up survey within 21 days of enrollment, we calculated the percentage with persistent symptoms (defined as the self-reported continued presence of the urethral symptoms reported at enrollment), both overall and stratified by the presence of MG at baseline. Participants who provided incongruent responses (ie, men who described symptoms as persistent at follow-up but who had not reported the symptoms at enrollment or men who, at follow-up, denied having had symptoms that they had reported at enrollment) were summarized separately. A sensitivity analysis was performed to assess the impact of including participants with incongruent responses in the prevalence of persistent symptoms by determining persistence based only on answers given on the follow-up survey.
To assess the association between MRMs and clinical outcomes after azithromycin treatment, we used 2 approaches. First, we restricted the analysis to participants with an evaluable MG result who were not infected with TV (for which azithromycin would have no antimicrobial activity) and who were treated with an azithromycin-containing regimen. We calculated the percentage of participants who reported persistent symptoms and the percentage of symptomatic participants who returned to a clinic within 45 days of enrollment, stratified by MG status and the presence or absence of MRMs. The analysis of the percentage of symptomatic patients who returned to the clinic was limited to men with persistent symptoms, because all men with persistent symptoms underwent a chart review. Second, we performed a comparable analysis of participants whose specimens were positive for only MG and who received an azithromycin-containing regimen. Because all MG-infected men were eligible for a chart review, we did not limit this analysis based on symptom status. Because of the low prevalence of QRMs and limited sample sizes, we did not present a similar analysis for QRMs. Analyses were conducted using SAS/STAT software, version 9.4 (SAS Institute, Cary, NC).
RESULTS
Population Characteristics and Mycoplasma genitalium Prevalence
Of 1100 men who were screened, 1096 (99.6%) were enrolled. A total of 918 enrollees had evidence of urethritis by Gram or MB/GV stain and were included in the primary evaluable population (Figure 1). The participant median age was 27 years (range, 18–69 years) and most were non-Hispanic Black (69.9%) or White (18.1%; Table 1). Overall, 77.0% of participants reported only female partners in the past 60 days, 20.7% reported only male partners, and 2.3% reported both male and female partners. Demographic differences were noted across sites (Table 1).
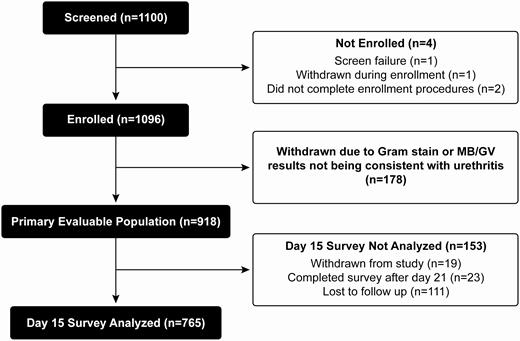
Participant flow diagram. Abbreviation: MB/GV, Gram or methylene blue/gentian violet.
Characteristics of Men with Urethritis Attending Participating Sexually Transmitted Disease Clinics
| Characteristic | Durham, NC, n = 93 | Greensboro, NC, n = 152 | Pittsburgh, PA, n = 176 | Birmingham, AL, n = 235 | New Orleans, LA, n = 103 | Seattle, WA, n = 159 | Total, n = 918 |
|---|---|---|---|---|---|---|---|
| Age, years | |||||||
| Median (min–max) | 27.0 (18.0–67.0) | 26.0 (19.0–59.0) | 25.0 (18.0–69.0) | 27.0 (18.0–58.0) | 30.0 (19.0–58.0) | 31.0 (18.0–61.0) | 27.0 (18.0–69.0) |
| 18–19 | 3 (3.2) | 1 (.7) | 17 (9.7) | 13 (5.5) | 5 (4.9) | 5 (3.1) | 44 (4.8) |
| 20–24 | 25 (26.9) | 62 (40.8) | 61 (34.7) | 75 (31.9) | 21 (20.4) | 18 (11.3) | 262 (28.5) |
| 25–29 | 34 (36.6) | 51 (33.6) | 38 (21.6) | 59 (25.1) | 25 (24.3) | 47 (29.6) | 254 (27.7) |
| 30–34 | 9 (9.7) | 20 (13.2) | 18 (10.2) | 26 (11.1) | 23 (22.3) | 30 (18.9) | 126 (13.7) |
| ≥35 | 22 (23.7) | 18 (11.8) | 42 (23.9) | 62 (26.4) | 29 (28.2) | 59 (37.1) | 232 (25.3) |
| Race/ethnicity | |||||||
| Black, non-Hispanic | 84 (90.3) | 124 (81.6) | 107 (60.8) | 220 (93.6) | 72 (69.9) | 35 (22.0) | 642 (69.9) |
| White, non-Hispanic | 2 (2.2) | 10 (6.6) | 40 (22.7) | 13 (5.5) | 26 (25.2) | 75 (47.2) | 166 (18.1) |
| Hispanic | 0 (0) | 2 (1.3) | 6 (3.4) | 1 (.4) | 2 (1.9) | 20 (12.6) | 31 (3.4) |
| Other | 7 (7.5) | 16 (10.5) | 23 (13.1) | 1 (.4) | 3 (2.9) | 29 (18.2) | 79 (8.6) |
| Sex in last 60 days | |||||||
| Yes | 92 (98.9) | 148 (97.4) | 173 (98.3) | 230 (97.9) | 103 (100) | 159 (100) | 905 (98.6) |
| No | 1 (1.1) | 3 (2.0) | 3 (1.7) | 5 (2.1) | 0 (0) | 0 (0) | 12 (1.3) |
| Don’t know/refused | 0 (0) | 1 (.7) | 0 (0) | 0 (0) | 0 (0) | 0 (0) | 1 (.1) |
| Sex of sex partner(s)a | |||||||
| Female only | 84 (91.3) | 127 (85.8) | 145 (83.8) | 215 (93.5) | 63 (61.2) | 63 (39.6) | 697 (77.0) |
| Male only | 5 (5.4) | 19 (12.8) | 24 (13.9) | 11 (4.8) | 36 (35.0) | 92 (57.9) | 187 (20.7) |
| Male and female | 3 (3.3) | 2 (1.4) | 4 (2.3) | 4 (1.7) | 4 (3.9) | 4 (2.5) | 21 (2.3) |
| Total number of sex partners in past 60 daysb | |||||||
| 0 | 1 (1.1) | 3 (2.0) | 3 (1.7) | 5 (2.1) | 0 (0) | 0 (0) | 12 (1.3) |
| 1 | 33 (35.5) | 52 (34.4) | 64 (36.4) | 89 (37.9) | 28 (27.2) | 30 (18.9) | 296 (32.3) |
| 2–5 | 55 (59.1) | 93 (61.6) | 97 (55.1) | 137 (58.3) | 67 (65.0) | 91 (57.2) | 540 (58.9) |
| 6–10 | 4 (4.3) | 2 (1.3) | 9 (5.1) | 4 (1.7) | 4 (3.9) | 25 (15.7) | 48 (5.2) |
| ≥11 | 0 (0) | 1 (.7) | 3 (1.7) | 0 (0) | 4 (3.9) | 13 (8.2) | 21 (2.3) |
| Living with HIVc | 1 (1.1) | 8 (5.3) | 2 (1.1) | 0 (0) | 10 (9.7) | 14 (8.8) | 35 (3.8) |
Data are presented overall and by study site, June 2017–July 2018. All data are presented as n (%) unless otherwise indicated.
Abbreviations: AL, Alabama; HIV, human immunodeficiency virus; LA, Louisiana; NC, North Carolina; PA, Pennsylvania; WA, Washington.
aIn the prior 60 days and among participants who reported sex within the past 60 days.
bThere were missing data from 1 participant from Greensboro, NC.
cBased on participant self-reports.
Among 914 participants in the primary evaluable population with evaluable MG laboratory results, 866 received an azithromycin-containing regimen, 18 received moxifloxacin, and 25 received a doxycycline-containing regimen. Of the 914 participants, 28.7% (95% CI, 23.8–33.6) had an MG infection (Table 2). The MG prevalence was similar to the prevalences of CT (24.8%; 95% CI, 20.9–28.8) and NG (34.8%; 95% CI, 29.7–39.8) and was higher than the prevalence of TV (6.9%; 95% CI, 3.8–10.0). Over 30% of participants did not have any of the 4 pathogens. The MG prevalence ranged by site from 20.4% (95% CI, 14.1–26.7) in Seattle to 38.8% (95% CI, 31.1–46.6) in Greensboro. Regional differences in MG prevalences persisted when data were stratified by the sex of sex partner (data not shown). Among all men with MG, 16.2% (95% CI, 11.4–20.9) also had CT, 21.2% (95% CI, 16.2–26.1) had NG, 3.5% (95% CI, .1–6.8) had TV, and 11.9% (95% CI, 7.4–16.4) had 3 or more pathogens (Supplementary Figure).
Prevalence and Absence of Mycoplasma genitalium, Chlamydia trachomatis, Neisseria gonorrhoeae, and Trichomonas vaginalis
| Durham, NC | Greensboro, NC | Pittsburgh, PA | Birmingham, ALa | New Orleans, LAa | Seattle, WAa | Overalla | ||||||||
|---|---|---|---|---|---|---|---|---|---|---|---|---|---|---|
| n | Prevalence (95% CI) | n | Prevalence (95% CI) | n | Prevalence (95% CI) | n | Prevalence (95% CI) | n | Prevalence (95% CI) | n | Prevalence (95% CI) | n | Prevalence (95% CI) | |
| Mycoplasma genitalium | 93 | 24.7 (16.0–33.5) | 152 | 38.8 (31.1–46.6) | 174 | 27.6 (20.9–34.2) | 235 | 29.8 (23.9–35.6) | 103 | 29.1 (20.4–37.9) | 157 | 20.4 (14.1–26.7) | 914 | 28.7 (23.8–33.6) |
| Chlamydia trachomatis | 93 | 32.3 (22.8–41.8) | 152 | 28.9 (21.7–36.2) | 174 | 27.0 (20.4–33.6) | 234 | 22.6 (17.3–28.0) | 102 | 24.5 (16.2–32.9) | 156 | 17.3 (11.4–23.2) | 911 | 24.8 (20.9–28.8) |
| Neisseria gonorrhoeae | 93 | 41.9 (31.9–52.0) | 152 | 42.8 (34.9–50.6) | 174 | 25.9 (19.4–32.4) | 234 | 33.3 (27.3–39.4) | 102 | 37.3 (27.9–46.6) | 157 | 33.1 (25.8–40.5) | 912 | 34.8 (29.7–39.8) |
| Trichomonas vaginalisb | 93 | 7.5 (3.1–14.9) | 152 | 9.9 (5.6–15.8) | 174 | 11.5 (7.2–17.2) | 235 | 6.8 (3.9–10.8) | 103 | 1.9 (.2–6.8) | 158 | 1.9 (.4–5.4) | 915 | 6.9 (3.8–10.0) |
| No pathogensb | 93 | 20.4 (12.8–30.1) | 152 | 16.4 (10.9–23.3) | 174 | 34.5 (27.5–42.1) | 234 | 34.2 (28.1–40.7) | 102 | 30.4 (21.7–40.3) | 154 | 40.9 (33.1–49.1) | 909 | 30.6 (23.3–37.8) |
Data are among men with urethritis attending participating sexually transmitted disease clinics, overall and by study site, June 2017–July 2018. Participants with multiple pathogens are included in the row for each pathogen detected in their specimens.
Abbreviations: AL, Alabama; CI, confidence interval; LA, Louisiana; NC, North Carolina; PA, Pennsylvania; WA, Washington.
aVariations in denominators are due to unevaluable results or noncompletion of testing because of protocol deviation at enrollment.
bExact confidence limits were used for site-specific estimates.
Participant characteristics, stratified by the presence or absence of MG, are displayed in Supplementary Table 1. By univariate logistic regression, MG was more likely in Black, Hispanic, and other men than in White men; less likely with each increasing year of age; more likely in men with only female sex partners than in men with only male partners; and less likely in men who reported anal sex (Supplementary Table 2). In the multivariable analyses, MG remained significantly associated with Black race (OR, 2.41; 95% CI, 1.45–4.02) and younger age (OR, .95; 95% CI, .94–.97; Supplementary Table 2).
Prevalence of Resistance Mutations
Among 262 participants with MG and available resistance results, 163 (64.4%; 95% CI, 58.2–70.3) had MG strains with MRMs and 30 (11.5%; 95% CI, 7.9–16.0) had strains with parC mutations; gyrA mutations were not detected (Table 3). There were 21 (8.3%; 95% CI, 5.2–12.5) participants who had both MRMs and parC mutations. The proportion of participants with MRMs varied by site (Table 3).
Prevalence of Macrolide Resistance Mutation (23S rRNA) and Quinolone Resistance Mutation (parC) Among Men with Mycoplasma genitalium–Associated Urethritis
| 23S rRNA Mutation | parC Mutation | |||
|---|---|---|---|---|
| Men with MG with Evaluable 23S rRNA results | 23S rRNA Mutation Present, n (%)[95% CI] | Men with MG with Evaluable parC Results | parC Mutation Present, n (%) [95% CI] | |
| Overalla | 253 | 163 (64.4) [58.2–70.3] | 261 | 30 (11.5) [7.9–16.0] |
| Study site | ||||
| Durham, NC | 23 | 14 (60.9) [38.5–80.3] | 22 | 4 (18.2) [5.2–40.3] |
| Greensboro, NC | 56 | 38 (67.9) [54–79.7] | 59 | 10 (16.9) [8.4–29] |
| Pittsburgh, PA | 47 | 28 (59.6) [44.3–73.6] | 48 | 3 (6.3) [1.3–17.2] |
| Birmingham, AL | 69 | 43 (62.3) [49.8–73.7] | 70 | 4 (5.7) [1.6–14.0] |
| New Orleans, LA | 29 | 18 (62.1) [42.3–79.3] | 30 | 4 (13.3) [3.8–30.7] |
| Seattle, WA | 29 | 22 (75.9) [56.5–89.7] | 32 | 5 (15.6) [5.3–32.8] |
| Sex of sex partner(s)b | ||||
| No partner/no sex in last 60 days | 4 | 2 (50.0) [6.8–93.2] | 5 | 0 (0) [0–52.2] |
| Females only | 212 | 133 (62.7) [55.8–69.3] | 214 | 21 (9.8) [6.2–14.6] |
| Male only or male and female | 37 | 28 (75.7) [58.8–88.2] | 42 | 9 (21.4) [10.3–36.8] |
| Antibiotic use in 14 days prior to enrollmentc | ||||
| Yes | 12 | 8 (66.7) [34.9–90.1] | 12 | 1 (8.3) [.2–38.5] |
| No | 240 | 155 (64.6) [58.2–70.6] | 248 | 29 (11.7) [8.0–16.4] |
| Coinfection status | ||||
| +CT | 40 | 24 (60.0) [43.3–75.1] | 42 | 4 (9.5) [2.7–22.6] |
| +NG | 51 | 27 (52.9) [38.5–67.1] | 55 | 6 (10.9) [4.1–22.2] |
| +TV | 9 | 7 (77.8) [40.0–97.2] | 9 | 0 (0) [0–33.6] |
| +2 or more | 29 | 12 (41.4) [23.5–61.1] | 30 | 1 (3.3) [.1–17.2] |
| No coinfection | 123 | 92 (74.8) [66.2–82.2] | 123 | 19 (15.4) [9.6–23.1] |
| Unknown | 1 | 1 (100) [2.5–100] | 2 | 0 (0) [0–84.2] |
| STD history at enrollmentd | ||||
| CT in last 3 months | ||||
| Yes | 17 | 13 (76.5) [50.1–93.2] | 18 | 1 (5.6) [.1–27.3] |
| No | 231 | 146 (63.2) [56.6–69.4] | 237 | 29 (12.2) [8.4–17.1] |
| Don’t know or refused to answer | 5 | 4 (80.0) [28.4–99.5] | 6 | 0 (0) [0–45.9] |
| NG in last 3 months | ||||
| Yes | 15 | 11 (73.3) [44.9–92.2] | 16 | 1 (6.3) [.2–30.2] |
| No | 234 | 148 (63.2) [56.7–69.4] | 240 | 29 (12.1) [8.2–16.9] |
| Don’t know or refused to answer | 4 | 4 (100.0) [39.8–100.0] | 5 | 0 (0) [0–52.2] |
| TV in last 3 months | ||||
| Yes | 3 | 2 (66.7) [9.4–99.2] | 3 | 0 (0) [0–70.8] |
| No | 248 | 159 (64.1) [57.8–70.1] | 256 | 30 (11.7) [8.0–16.3] |
| Don’t know or refused to answer | 2 | 2 (100.0) [15.8–100.0] | 2 | 0 (0) [0–84.2] |
| NGU in last 3 months | ||||
| Yes | 17 | 16 (94.1) [71.3–99.9] | 18 | 3 (16.7) [3.6–41.4] |
| No | 233 | 145 (62.2) [55.7–68.5] | 240 | 26 (10.8) [3.6–41.4] |
| Don’t know or refused to answer | 3 | 2 (66.7) [9.4–99.2] | 3 | 1 (33.3) [.8–90.6] |
Data are overall and by select characteristics at enrollment, June 2017–July 2018.
Abbreviations: AL, Alabama; CI, confidence interval; CT, Chlamydia trachomatis; LA, Louisiana; MG, Mycoplasma genitalium; NC, North Carolina; NG, Neisseria gonorrhoeae; NGU, nongonococcal urethritis; PA, Pennsylvania; parC, A subunit of topoisomerase IV; rRNA, ribosomal ribonucleic acid; STD, sexually transmitted disease; TV, Trichomonas vaginalis; WA, Washington.
aAmong 262 men who tested positive for MG, 9 had unevaluable results for 23S, and 1 had an unevaluable result for parC.
bThere were 4 men who reported sex with both female and male partners.
cThere was 1 participant with no resistance who did not remember whether they had antibiotic use 14 days prior to enrollment.
dBased on self-reports.
Men who reported NGU in the previous 3 months more often had an MRM (94.1%; 95% CI, 71.3–99.9) than those who did not report NGU (62.2%; 95% CI, 55.7–68.5). Differences in the prevalences of MRMs or parC mutations were not observed by sex of sex partner, antibiotic use in the past 14 days, or CT, NG, or TV in the past 3 months (Table 3).
Symptom Persistence
Of 914 participants with evaluable MG results, 763 (83.5%) completed the follow-up survey within 21 days. Of those, 151 (19.8%) reported that their symptoms had not fully resolved, with no substantial difference by baseline MG status (Supplementary Table 1). Results of the sensitivity analysis, which included incongruent responses, agreed with the main analysis.
Among 670 men without TV who were treated with an azithromycin-containing regimen at enrollment, men with MG and MRM more often reported persistent symptoms (25.8%) than both men with MG but without MRM (13.0%) and men without MG (17.2%), though this finding was not statistically significant (Table 4). Among men reporting persistent symptoms, the proportion who returned to a clinic by Day 45 did not differ substantially by MG and MRM status (MG and MRM, 31.3%; MG without MRM, 22.2%; MG negative, 32.9%; Table 4). Among 115 participants infected only with MG (mono-infected) who were treated with an azithromycin-containing regimen at enrollment, 35.1% of participants with MRMs reported persistent symptoms, compared to 8.7% of those without MRMs. Regardless of the symptom status at Day 15, MG mono-infected men harboring MRMs who were treated with azithromycin at enrollment were more likely to present to the clinic again within the 45-day follow-up period (27.1%) than mono-infected men without an MRM (7.1%), though this finding did not reach statistical significance (Table 5).
Association of Self-reported Persistent Urethritis and Return Visits
| MG Positive | MG Negative | |||||
|---|---|---|---|---|---|---|
| Resistance Mutations Present in 23S rRNA, n = 124 | Resistance Mutations Absent in 23S rRNA, n = 69 | n = 477 | ||||
| n (%) | (95% CI) | n (%) | (95% CI) | n (%) | (95% CI) | |
| Persistent symptoms at Day 15 | ||||||
| Yes | 32 (25.8) | (18.4–34.4) | 9 (13.0) | (6.1–23.3) | 82 (17.2) | (13.9–20.9) |
| No | 84 (67.7) | (58.8–75.9) | 60 (87.0) | (76.7–93.9) | 378 (79.2) | (75.3–82.8) |
| Incongruent: symptoms not reported at enrollment but reported as persistent at Day 15 | 4 (3.2) | (.9–8.1) | 0 (0) | (0–5.2) | 4 (.8) | (.2–2.1) |
| Incongruent: symptoms reported at enrollment but denied ever having at Day 15 | 4 (3.2) | (.9–8.1) | 0 (0) | (0–5.2) | 13 (2.7) | (1.5–4.6) |
| Returned at least once within 45 days of enrollmentb | ||||||
| Yes | 10 (31.3) | (16.1–50) | 2 (22.2) | (2.8–60) | 27 (32.9) | (22.9–44.2) |
| No | 22 (68.8) | (50–83.9) | 7 (77.8) | (40–97.2) | 55 (67.1) | (55.8–77.1) |
| Return visit before Day 15 FUb | ||||||
| Yes | 6 (18.8) | (7.2–36.4) | 0 (0) | (0–33.6) | 7 (8.5) | (3.5–16.8) |
| No | 26 (81.3) | (63.6–92.8) | 9 (100) | (66.4–100) | 75 (91.5) | (83.2–96.5) |
| Return visit between Day 15 FU and Day 45b | ||||||
| Yes | 4 (12.5) | (3.5–29) | 2 (22.2) | (2.8–60) | 21 (25.6) | (16.6–36.4) |
| No | 28 (87.5) | (71–96.5) | 7 (77.8) | (40–97.2) | 61 (74.4) | (63.6–83.4) |
Data are among men treated with azithromycin who have analyzable Day 15 data, stratified by Mycoplasma genitalium status and by the presence or absence of macrolide resistance mutations (23S rRNA),a June 2017–July 2018.
Abbreviations: CI, confidence interval; FU, follow-up; MG, Mycoplasma genitalium; rRNA, ribosomal ribonucleic acid.
aMen with Trichomonas vaginalis infection were excluded; men with an unevaluable result for the 23S mutation were also excluded.
bAmong men reporting persistent symptoms at Day 15; excluding participants with incongruent answers.
Association of Self-reported Persistent Urethritis and Return Visits with Macrolide Resistance Markers
| Resistance Mutations Present in 23S rRNA | ||||
|---|---|---|---|---|
| Yes, n = 85 | No, n = 30 | |||
| n (%) | (95% CI) | n (%) | (95% CI) | |
| Persistent symptoms at Day 15a | ||||
| Yes | 26 (35.1) | (24.4–47.1) | 2 (8.7) | (1.1–28) |
| No | 43 (58.1) | (46.1–69.5) | 21 (91.3) | (72–98.9) |
| Incongruent: symptoms not reported at enrollment but reported as persistent at Day 15 | 3 (4.1) | (.8–11.4) | 0 (0) | (0–14.8) |
| Incongruent: symptoms reported at enrollment but denied ever having at Day 15 | 2 (2.7) | (.3–9.4) | 0 (0) | (0–14.8) |
| Returned at least once within 45 days of enrollmentb | ||||
| Yes | 23 (27.1) | (18–37.8) | 2 (7.1) | (.9–23.5) |
| No | 62 (72.9) | (62.2–82) | 26 (92.9) | (76.5–99.1) |
Data are among men in the primary evaluable population who have analyzable Day 15 data, are positive for Mycoplasma genitalium only, and were treated with azithromycin, stratified by the presence or absence of macrolide resistance mutations (23S rRNA), July 2017–June 2018.
Abbreviations: CI, confidence interval; rRNA, ribosomal ribonucleic acid.
aAmong 97 (74 with 23S mutations present and 23 without) participants with analyzable Day 15 data.
bAmong 113 (85 with 23S mutations present and 28 without) participants with analyzable return data.
DISCUSSION
MG was common among men presenting with urethritis to STD clinics in the United States. Overall, MG was detected in over 25% of men with urethritis, similar to previously published estimates [5]. In contrast to previous reports [24], the MG prevalence in urethritis was higher than the prevalences of both CT and TV, though these differences were statistically significant only for MG and TV. The MG prevalence varied by site, ranging from approximately 20% in Seattle to nearly 40% in Greensboro. At 2 other Southern sites, Birmingham and New Orleans, there were prevalences of nearly 30%, suggesting regional differences and a higher prevalence in the South. Among the MG strains detected, MRMs were common, parC mutations were not infrequent, and the prevalence of resistance mutations varied by site.
Consistent with data on declining azithromycin efficacy [10, 17, 25], we found that over 60% of detected MG strains harbored MRMs; the high prevalence of MRMs was noted across all study sites. Frequent or recent exposure to azithromycin likely contributes to the emergence of MRMs in MG [10, 25, 26]. We found that the prevalence of MRMs was higher among participants with recent NGU—a condition for which previous azithromycin treatment was highly likely—than participants who did not report NGU. No clear association between resistance and antimicrobial exposure (within the previous 14 days) or other STDs was identified. In light of rapidly emerging macrolide resistance and the likely role of azithromycin in facilitating resistance, careful consideration of azithromycin use in STD treatment is warranted.
Although a Food and Drug Administration–approved MG diagnostic test became available in the United States in January 2019 (https://www.fda.gov/news-events/press-announcements/fda-permits-marketing-first-test-aid-diagnosis-sexually-transmitted-infection-known-mycoplasma), an approved test to detect MG resistance mutations is not currently available. Diagnostics for resistance detection may be useful to guide therapy, particularly if future tests are available at the point of care. A recent trial that investigated the use of resistance testing to guide therapy highlighted the potential benefit of concurrent testing for MG and resistance mutations. The investigators found a high cure rate for MG infections with MRM when moxifloxacin was used and for infections with wild-type strains when azithromycin was used [27].
We found a non–statistically significant trend that men with MG and MRMs were more likely to report persistent symptoms after azithromycin treatment than either men with MG but without MRMs or MG-negative men, although there was no clear difference in clinic returns within the 45-day chart review period by MG/MRM status. In a subset of men with MG mono-infection treated with a macrolide, over 35% of those with MRMs reported persistent symptoms after treatment, compared to 9% among those without MRMs. Men with MG and MRM were also more likely to return to a clinic within 45 days than men with MG but without MRM (27% versus 7%, respectively), though this finding was not statistically significant. The high prevalence of MG and MRMs in men with urethritis may translate into large numbers of men experiencing persistent symptoms (and returning for additional health care). The burden of health-care costs and clinic resources associated with persistent MG urethritis warrants investigation.
This study had several limitations. There was 1 site that used Gram stain criterion of ≥5 WBCs/oif for a urethritis diagnosis, while others used ≥2 WBCs/oif. Follow-up data were not collected from 10 participants initially excluded due to the higher WBC cut-off, but all were MG negative and the impact of the missing data is likely to be minimal. Clinical outcomes were based on self-reports and not systematically documented with return study visits and retesting. We were unable to evaluate follow-up visit data among all participants, as we limited chart reviews to men with MG and/or persistent symptoms. We may have underestimated the percentage of participants who returned for care, as participants might have presented to other clinics. The smaller sample size likely decreased the power to detect statistically significant differences amongst subgroups. These limitations stem in large part from the decision to conduct the study within the context of real-world urethritis management. This context strengthens and broadens the applicability of the findings.
In this study, MG was common among men with urethritis, and over 60% of MG strains harbored MRMs. Over 10% of MG strains had QRMs. Emerging resistance in MG and a limited armamentarium of effective treatment options pose significant challenges to the clinical management of MG urethritis. The emergence of MG as a prominent urogenital pathogen warrants continued research into the clinical and public health implications of MG, the optimal management of MG urethritis, point-of-care diagnostics for resistance, and the search for new treatment options.
Supplementary Data
Supplementary materials are available at Clinical Infectious Diseases online. Consisting of data provided by the authors to benefit the reader, the posted materials are not copyedited and are the sole responsibility of the authors, so questions or comments should be addressed to the corresponding author.
Notes
Acknowledgments. The authors thank the study participants and sexually transmitted disease clinic staff from each study site; the study staff, including Hanne Harbison, Meghan Whitfield, Danielle Litzinger, Tationna Smalley, Gina Leipertz, Jennifer L. Morgan, M. Sylvan Lowens, Andrea Lewis, Rebecca Lillis, Cathy Cammarata, Adriane Osborne, Anjeleigh Partridge, Lallitha Venkatasubramanian, Claudia Hansen, Quin Daniels, and Angie Wheeless; Hologic, for the donation of test kits; Linda McNeil, Edward Hook III, David Martin, Melinda Tibbals, Lisa Saylor, and Doug Taylor for their valuable input on the study design; and the Centers for Disease Control and Prevention’s Laboratory Reference and Research Branch, including Damien Danavall, Monica Morris, Samantha Katz, Evelyn Nash, and Ellen Kersh. MAGNUM Laboratory Working Group members are Damien Danavall, Monica Morris, Samantha Katz, Evelyn Nash, and Ellen Kersh. All MAGNUM working group members are affiliated with Division of STD Prevention, Centers for Disease Control and Prevention, Atlanta, Georgia, USA.
Disclaimer. The findings and conclusions in this report are those of the authors and do not necessarily represent the official position of the Centers for Disease Control and Prevention.
Financial support. This work was supported by the National Institute of Allergy and Infectious Diseases, part of the National Institutes of Health (contract numbers HHSN2722013000121 and HHSN272000010).
Potential conflicts of interest. L. H. B. has received research funding from Becton-Dickenson and Atlas Genetics/BINX. W. M. G. has received grants consulting fees from Hologic Inc. and Roche Molecular Systems Inc. L. E. M. has received grant funding, advisory board honoraria, and non-financial support from Hologic, Inc. S. N. T. has received research support from Hologic, Inc., Roche Molecular, Becton Dickinson, Cepheid, Abbott, and Atlas/BINX. A. C. S. has received grants from Gilead FOCUS, consulting fees from Hologic, Inc., and royalties from UptoDate. C. J. M. has received grant funding from the Centers for Disease Control and Prevention, National Institutes of Health, United States Department of Health and Human Services/Health Resources & Services Administration, Gilead, and Atlas Genetics/BINX; and has pending grants from GlaxoSmithKline and the National Association of County City Health Officials, outside the submitted work. All other authors report no potential conflicts.
All authors have submitted the ICMJE Form for Disclosure of Potential Conflicts of Interest. Conflicts that the editors consider relevant to the content of the manuscript have been disclosed.
References
Author notes
The name of the study is Mycoplasma genitalium among men with uncomplicated urethritis attending STD clinics in the US: Assessing burden, risk factors and co-infections.

