


Abstract
Coronavirus disease 2019 (COVID-19) is an emerging serious global health problem. Gastrointestinal symptoms are common in COVID-19 patients, and severe acute respiratory syndrome coronavirus 2 RNA has been detected in stool specimens. However, the relationship between the gut microbiome and disease remains to be established.
We conducted a cross-sectional study of 30 patients with COVID-19, 24 patients with influenza A(H1N1), and 30 matched healthy controls (HCs) to identify differences in the gut microbiota by 16S ribosomal RNA gene V3–V4 region sequencing.
Compared with HCs, COVID-19 patients had significantly reduced bacterial diversity; a significantly higher relative abundance of opportunistic pathogens, such as Streptococcus, Rothia, Veillonella, and Actinomyces; and a lower relative abundance of beneficial symbionts. Five biomarkers showed high accuracy for distinguishing COVID-19 patients from HCs with an area under the curve (AUC) up to 0.89. Patients with H1N1 displayed lower diversity and different overall microbial composition compared with COVID-19 patients. Seven biomarkers were selected to distinguish the 2 cohorts (AUC = 0.94).
The gut microbial signature of patients with COVID-19 was different from that of H1N1 patients and HCs. Our study suggests the potential value of the gut microbiota as a diagnostic biomarker and therapeutic target for COVID-19, but further validation is needed.
Coronavirus disease 2019 (COVID-19) is an emerging respiratory infectious disease caused by severe acute respiratory syndrome coronavirus 2 (SARS-CoV-2), and has rapidly spread throughout the world [1]. The clinical manifestations and transmission routes of seasonal influenza A(H1N1) are similar to those of COVID-19 [2, 3]. The World Health Organization (WHO) reported that the prevalence of influenza and influenza-like illness was high in China and the United States in the 2019–2020 season [4]. Distinguishing COVID-19 and H1N1 at the early stage of outbreaks is essential because occupational safety measures, treatment, and prognosis are different between these entities.
SARS-CoV-2 binds to angiotensin-converting enzyme 2 (ACE2) receptors to invade human cells, and these receptors are highly expressed in the intestinal epithelium [5, 6]. ACE2 might be associated with cardiopulmonary disease via alterations in the gut and/or lung microbiome [7]. Previous studies have found that 3.34%–11.4% of COVID-19 patients had gastrointestinal symptoms, such as vomiting and diarrhea, especially in critically ill patients [6, 8]. Moreover, viral RNA and live viruses were detected in fecal samples, suggesting that the digestive tract might be a site of viral replication and activity [9]. However, the interaction between COVID-19 and intestinal microorganisms is not fully understood.
The intestinal flora is involved in host nutrient absorption and metabolism and has a profound impact on human health and disease [10–12]. Previous studies indicated that the intestinal flora was closely related to respiratory virus infection and could affect the occurrence and development of diseases through the gut-lung axis [13]. Moreover, influenza infection can affect the composition of the intestinal microbiota [14], and intestinal microflora disorders reduce host antiviral immune response, thereby aggravating lung damage caused by these infections [15].
This cross-sectional study analyzed the gut microbiome of COVID-19 patients, H1N1 patients, and healthy controls (HCs) by high-throughput sequencing of the 16S ribosomal RNA (rRNA) gene to provide a theoretical basis for differential diagnosis and intestinal microbial intervention. The results showed that biomarkers could be used to identify changes in the structure, composition, and function of the microbiome between these patient groups.
MATERIALS AND METHODS
Study Design and Enrolled Patients
The study was approved by the Research Ethics Committee of the First Affiliated Hospital of the Zhejiang University School of Medicine (numbers IIT2020-136 and 2018–447). A cohort of 84 subjects was recruited, including 30 COVID-19 patients; 24 hospitalized patients with H1N1 infection; and 30 age-, sex-, and body mass index (BMI)–matched HCs who met the inclusion criteria described in our previous study [16].
The COVID-19 patients were admitted to the First Affiliated Hospital of the Zhejiang University School of Medicine between January 2020 and March 2020. Disease severity was classified into 4 types according to the diagnostic criteria of the seventh edition of the Diagnostic and Treatment Protocol for COVID-19 in China [17], and our cohort presented either (1) general disease, characterized by fever, respiratory symptoms, and lung imaging evidence of pneumonia; or (2) severe disease, manifested by a respiratory rate ≥30 breaths per minute, oxygen saturation ≤93% at rest, arterial partial pressure of oxygen/fraction of inspired oxygen ≤300 mm Hg, or progression (>50%) in lung imaging lesions within 24–48 hours.
H1N1 patients hospitalized from January 2018 to March 2019 were enrolled. According to the WHO surveillance case definitions for severe acute respiratory infection, the degree of severity of H1N1 in our cohort was classified as severe at the time of admission [18].
All subjects who received antibiotics, probiotics, or both within 4 weeks before enrollment were excluded. Viral infections were confirmed by real-time reverse-transcription polymerase chain reaction (PCR). Only laboratory-confirmed cases with clinical symptoms were included in the study.
Patient data, including laboratory test results, clinical manifestations, and disease course, were obtained from medical records and laboratory information systems.
Sample Collection and Processing
Fecal samples from COVID-19 and H1N1 patients were collected at admission, and fresh stools from healthy subjects were collected during physical examination. Fecal samples were processed in the laboratory within 4 hours after collection and stored at −80°C until analysis.
Blood samples were taken from all study subjects for analyzing hematological variables, liver function, kidney function, and serum cytokines, using routine clinical laboratory methods as described in the Supplementary Methods.
DNA Extraction
Given the potential presence of live virus in feces, all fecal samples were inactivated at 56°C for 30 minutes before DNA extraction. Microbial DNA was extracted from 200 mg of feces per sample using DNeasy PowerSoil Pro Kit (Qiagen) with a bead-beating step according to the manufacturer’s protocol, as described elsewhere [19].
Sequencing and Bioinformatics
DNA libraries were generated from PCR amplicons targeting the hypervariable regions V3–V4 of the 16S rRNA gene and sequencing using the Illumina MiSeq PE300 instrument. Further details of sequencing protocol are available in the Supplementary Methods.
The raw sequencing reads were quality-filtered and merged by Trimmomatic and FLASH. Operational taxonomic units (OTUs) with a similarity cutoff of 97% were clustered using UPARSE version 7.1 (http://drive5.com/uparse), and chimeric sequences were identified and removed. After filtering, an average of 48 879 reads per sample was obtained (minimum, 33 476; maximum, 63 480). The taxonomy of each OTU representative sequence was analyzed by RDP Classifier (http://rdp.cme.msu.edu/) against the 16S rRNA database (Silva SSU132). Alpha diversity was assessed using the Chao 1 index and Shannon index. Beta diversity was estimated by the Bray-Curtis distance and was visualized by principal coordinates analysis.
For biomarker identification, a 2-step approach was adopted. First, a random forest model [20] was constructed for distinguishing between the 2 groups, and the 10 most predominant genera as candidate biomarkers were selected on the basis of importance values (using the R package “randomForest,” ntree = 500) (Supplementary Table 1). Second, the differences in taxonomic composition taxa between the 2 cohort groups were identified using the linear discriminant analysis effect size (LEfSe) analysis (http://huttenhower.sph.harvard.edu/galaxy/). Candidate biomarkers with a linear discriminant analysis >3.5 were selected as final biomarkers. The discriminatory ability of the biomarkers was evaluated by plotting receiver-operating characteristic (ROC) curves and calculating the area under the ROC curve (AUC) using R software’s pROC package.
Statistical Analysis
Continuous variables were reported as mean ± standard deviation, and statistical comparisons were made using the independent t-test. Nonnormally distributed variables were expressed as interquartile range (IQR), and comparisons were conducted using the Mann-Whitney U test. For correlation analysis, Spearman rank test was performed. Statistical analysis was performed using SPSS version 20.0 (SPSS Inc). P values of <.05 after multiple-comparison correction using the false discovery rate method were considered significant.
RESULTS
Clinical Characteristics of the Study Population
The study population included 30 hospitalized patients with confirmed SARS-CoV-2 infection, 24 hospitalized patients with confirmed H1N1 infection, and 30 healthy subjects. Clinical data are shown in Table 1. The median age of COVID-19 patients was 55 years (IQR, 48–62 years; range, 29–70 years), and 13 (43.3%) were women. The median duration of hospitalization was 16.0 days (IQR, 12.0–21.3 days). In this group, 33.3% had at least 1 coexisting medical condition, and the most common comorbidity was hypertension (30.0%). Fever was present in 86.7% of the patients on admission, and the median body temperature was 38.2°C (IQR, 37.5°C −38.8°C). Five patients (16.7%) presented with diarrhea.
Clinical Characteristics of the Study Population
| Characteristic | Healthy Controls (n = 30) | H1N1 (n = 24) | COVID-19 (n = 30) | P Valuea |
|---|---|---|---|---|
| Age, y | 53.5 (43.8–60.3) | 48.5 (33.3–66.8) | 55.0 (48.0–62.0) | .347 |
| Female sex, No./Total (%) | 13/30 (43.3) | 9/24 (37.5) | 13/30 (43.3) | .665 |
| BMI, kg/m2 | 22.9 (21.3–24.6) | 24.5 (22.9–27.6) | 24.6 (22.3–27.1) | .993 |
| Length of hospital stay | NA | 7.0 (6.0–9.8) | 16.0 (12.0–21.3) | < .001 |
| Coexisting disorder, No./Total (%) | ||||
| Any | NA | 11/24 (45.8) | 10/30 (33.3) | .349 |
| Hypertension | NA | 5/24 (20.8) | 9/30 (30.0) | .445 |
| Symptoms, No./Total (%) | ||||
| Fever on admission | NA | 19/24 (79.2) | 26/30 (86.7) | .713 |
| Temperature on admission, °C | NA | 38.2 (37.5–39.5) | 38.2 (37.5–38.8) | .632 |
| Cough | NA | 22/24 (91.7) | 26/30 (86.7) | .682 |
| Diarrhea | NA | 3/24 (12.5) | 5/30 (16.7) | .720 |
| White blood cell count, ×109/L | 5.9 (4.9–7.8) | 6.1 (3.8–8.6) | 6.2 (4.0–9.3) | .801 |
| Neutrophil count, ×109/L | 3.4 (2.5–4.7) | 4.7 (2.4–6.7) | 4.6 (2.8–7.6) | .459 |
| Lymphocyte count, ×109/L | 2.1 (1.4–2.5) | 0.9 (0.6–1.4)b | 0.9 (0.6–1.1)b | .206 |
| Platelet count, ×109/L | 226.5 (204.3–249.5) | 163.5 (128.8–230.5)b | 206.0 (165.8–261.5) | .026 |
| Hemoglobin level, g/L | 146.0 (140.0–152.3) | 136.0 (123.5–152.5) | 139.0 (124.8–151.0)b | .882 |
| CRP level ≥ 10 mg/L, No./Total (%) | NA | 18/24 (75.0) | 21/29 (72.4) | .832 |
| Procalcitonin level ≥0.5 ng/mL No./Total (%) | NA | 16/19 (84.2) | 15/30 (50.0) | .016 |
| Alanine aminotransferase, U/L | 15.0 (10.8–23.3) | 28.0 (19.8–50.0)b | 22.0 (15.8–38.5)b | .188 |
| Aspartate aminotransferase, U/L | 19.0 (16.8–23.0) | 36.0 (21.3–61.5)b | 20.0 (16.0–39.5) | .018 |
| Lactate dehydrogenase, U/L | NA | 258.0 (229.3–349.8) | 243.5 (210.3–331.8) | .331 |
| Creatinine, μmol/L | 69.5 (65.0–81.0) | 62.5 (53.3–81.3) | 77.0 (62.8–84.8) | .083 |
| D-dimer, mg/L | NA | 533.0 (186.0–1546.0) | 274.0 (174.0–442.5) | .107 |
| IL-2, pg/mL | 0.9 (0.9–0.9) | 1.5 (1.4–1.7)b | 1.0 (0.9–1.7)b | .065 |
| IL-4, pg/mL | 1.2 (1.2–1.2) | 1.4 (1.2–1.7)b | 1.8 (1.8–1.9)b | .003 |
| IL-6, pg/mL | 2.0 (2.0–2.1) | 11.0 (5.3–15.9)b | 19.9 (9.2–42.1)b | .097 |
| IL-10, pg/mL | 0.8 (0.7–0.8) | 3.6 (2.5–4.2)b | 4.3 (3.1–7.8)b | .124 |
| TNF-α, pg/mL | 3.6 (3.6–3.9) | 4.4 (4.1–4.4)b | 22.3 (12.2–73.8)b | < .001 |
Data are presented as median (interquartile range) unless otherwise indicated.
Abbreviations: BMI, body mass index; COVID-19, coronavirus disease 2019; CRP, C-reactive protein; IL, interleukin; NA, not available; TNF-α, tumor necrosis factor alpha.
aP values indicate differences between H1N1 and COVID-19. P < .05 was considered statistically significant.
bP < .05 was considered to indicate significant difference between healthy controls and H1N1 and COVID-19, respectively.
There were no significance differences in age, sex, and BMI between the groups. However, there were significant differences in platelet count, aspartate aminotransferase, interleukin (IL) 4, and tumor necrosis factor alpha (TNF-α) between H1N1 and COVID-19 patients (P < .05). The rate of hypertension did not differ significantly between these 2 groups (P = .445). With regard to inflammatory markers, there was a significant difference in procalcitonin (P = .016) but no significant difference in C-reactive protein (CRP) (P = .832) between H1N1 and COVID-19 patients. There were significant differences in lymphocyte count, alanine aminotransferase, IL-2, IL-4, IL-6, IL-10, and TNF-α between HCs and COVID-19 patients.
According to clinical guidelines, COVID-19 severity on admission was categorized as general in 15 patients and severe in 15 patients. The clinical data of these subjects were summarized and compared (Supplementary Table 2). There was a significant difference in white blood cell count, neutrophil count, lymphocyte count, and lactate dehydrogenase between these 2 groups (P < .05).
Microbial Diversity Is Decreased in COVID-19 and H1N1 Patients
The characteristics of the gut microbiome in patients with respiratory viral infections were analyzed by 16S rDNA gene sequencing of 84 fecal samples (1 sample per patient). After merging and filtering, 4 105 869 high-quality sequence reads were generated.
The mean community richness and microbial diversity were significantly lower in COVID-19 and H1N1 patients than in HCs, according to the Shannon diversity index and Chao diversity index (Figure 1A and 1B). The number of OTUs in the COVID-19, H1N1, and HC groups was 911, 960, and 922, respectively. More than 50% of 1242 OTUs were shared by the 3 groups, and 62.3% of OTUs overlapped between the COVID-19 group and HCs (Figure 1C). Principal coordinates analysis of Bray-Curtis distances indicated differences in the fecal microbiota between COVID-19 and H1N1 patients and between these groups and HCs (analysis of similarities [ANOSIM], R = 0.36, P = .001) (Figure 1D). Ternary plot showed that the relative abundance of Streptococcus and Escherichia/Shigella was significantly higher in COVID-19 and H1N1 patients, respectively (Figure 1E).
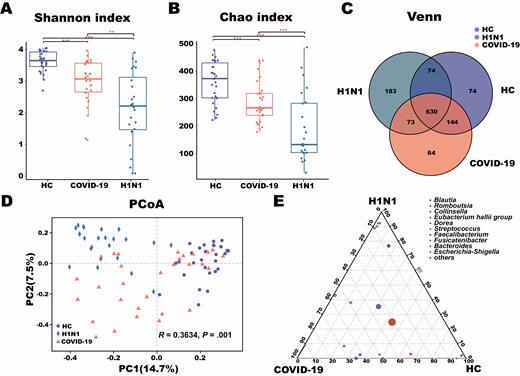
Changes in fecal microbial diversity and community structures in patients with coronavirus disease 2019 (COVID-19) (n = 30), patients with H1N1 (n = 24), and a healthy control group (HC) (n = 30). There were significant differences in the α-diversity of the gut microbiota among the 3 groups based on the Shannon index (A) and Chao index (B). Venn diagram showing the overlap of open taxonomic units of the fecal microbiota across the 3 groups (C). The β-diversity results were assessed by principal coordinates analysis (PCoA) of Bray-Curtis distances (D). Each point represents 1 sample. Each color indicates a study group (purple, healthy controls; orange, COVID-19 patients; teal, H1N1 patients). Ternary plot depicting the number of genera (relative abundance > 3%) enriched in the COVID-19, H1N1, and HC groups (E). Each circle represents 1 genus, and the size of the circle reflects relative abundance. P < .05 for all data. **P = .01–.001; ***P < .001.
The analysis of group similarities indicated that differences in richness, diversity, and structure of the gut microbiota were not significantly different between general and severe COVID-19 patients (ANOSIM, P = .426; Supplementary Figure 1), indicating that the experimental design was adequate.
Bacterial Taxonomic Differences Among the 3 Groups
To investigate changes in the microbiota of COVID-19 patients, we assessed relative abundance in the 3 groups at the phylum, class, family, and genus levels (Figure 2). At the phylum level, the relative abundance of phyla Actinobacteria and Firmicutes significantly decreased in the H1N1 group compared with the COVID-19 group and HCs, which was largely due to a significant reduction in class Actinobacteria, Erysipelotrichia, and Clostridia. At the family level, the amount of several representative groups of putative anaerobic butyrate-producing bacteria (BPB) from the families Lachnospiraceae and Ruminococcaceae was dramatically decreased in H1N1 patients. This result was partly due to significant depletion in the abundance of Blautia, Agathobacter, Anaerostipes, Fusicatenibacter, Eubacterium hallii group, unclassified Lachnospiraceae, Dorea, Faecalibacterium, and Ruminococcus-2 in the H1N1 group. Similarly, compared with HCs, the abundance of the Ruminococcaceae family and several genera from the Lachnospiraceae family (Fusicatenibacter, Anaerostipes, Agathobacter, unclassified Lachnospiraceae, and E. hallii group) was dramatically reduced in COVID-19 patients. However, the number of Streptococcus (class Bacilli) was higher in COVID-19 patients than in the other 2 groups.
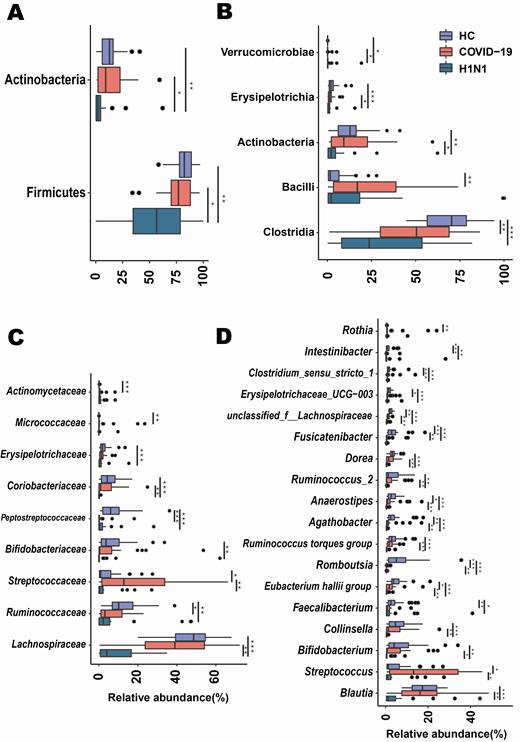
Taxonomic differences in the fecal microbiota between patients with coronavirus disease 2019 (COVID-19), patients with H1N1, and a healthy control group (HC). Comparison of the relative abundance at the phylum (A), class (B), family (C), and genus (D) levels across the 3 groups. Each box represents the interquartile range (first and third quartiles) of taxa abundance, and the black line corresponds to median abundance. Vertical lines represent the variability in the abundance of each taxon. Each circle corresponds to extreme values in each taxon. *Adjusted P = .05–.01; **Adjusted P = .01–.001; ***Adjusted P < .001.
Differences in the Fecal Microbiota Across All Groups
LEfSe analysis was used to determine and distinguish the composition of the gut microbiome between the COVID-19 group and HCs. The gut microbiome of the COVID-19 group was dominated by Streptococcus, Rothia, Veillonella, Erysipelatoclostridium, and Actinomyces, whereas the microbiome of HCs was dominated by the genera Romboutsia, Faecalibacterium, Fusicatenibacter, and E. hallii group (Figure 3A). Spearman correlation analysis was performed to evaluate relationships among genera (Figure 3B). There were significant positive correlations across COVID-19–enriched genera. However, there was a negative correlation between genera enriched in the COVID-19 group and HCs. Five final biomarkers (Fusicatenibacter, Romboutsia, Intestinibacter, Actinomyces, Erysipelatoclostridium) were selected to distinguish between the COVID-19 group and HCs, with ROC-plot AUC value of 0.89 (95% confidence interval [CI], .8–.97) (Figure 3C).
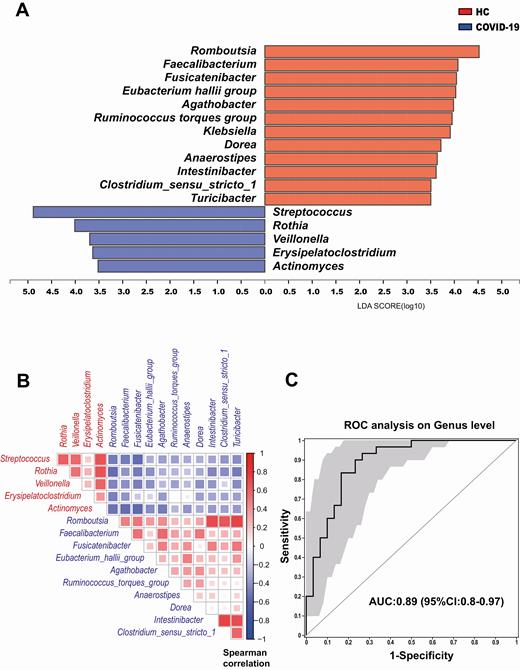
A, Linear discriminant analysis (LDA) effect size analysis was used to identify differences in microbial composition between patients with coronavirus disease 2019 (COVID-19) and a healthy control group (HC). At the genus level, LDA scores showed significant differences in microbiota composition between patients with COVID-19 (blue) and HC (orange). Only taxa with an LDA threshold value > 3.5 are shown. B, Spearman correlation of associated genera in COVID-19 patients and HC. The genera enriched in COVID-19 patients (red) were negatively correlated with HC-enriched genera (blue). C, Prediction of 5 biomarkers in the microbiome of COVID-19 patients and HC. The area under the receiver operating characteristic (ROC) curve (AUC = 0.89), with 95% confidence interval (CI), is shown in the center.
The effect of viral infections on the intestinal flora was determined by comparing estimated fecal microbiome phylotypes in H1N1 patients and HCs by LEfSe analysis (Supplementary Figure 2). The microbiome of the H1N1 group was dominated by Enterococcus, Prevotella, Finegoldia, and Peptoniphilus, whereas the microbiome of HCs had a dominance of Blautia, Romboutsia, Collinsella, Bifidobacterium, and other beneficial bacteria. Six final biomarkers (Fusicatenibacter, Romboutsia, Anaerostipes, E. hallii group,Ruminococcus torques group, and Blautia) were selected to differentiate the H1N1 group and HCs, and the AUC was 0.95 (95% CI, .89–1.00) (Supplementary Figure 2).
Differences in the Fecal Microbiota Between COVID-19 and H1N1 Patients
The gut microbiota signature of COVID-19 and H1N1 patients was analyzed to assess correlations between disease characteristics and the microbiome. The abundance of Prevotella, Ezakiella, Murdochiella, and Porphyromonas was higher in the H1N1 group than in COVID-19 patients (Figure 4A). In addition, 7 final biomarkers (Streptococcus, Fusicatenibacter, Collinsella, Dorea, Agathobacter, E. hallii group, Ruminococcus torques group) were selected reference the 2-step schema in the method to distinguish the 2 cohorts, with an AUC of 0.94 (95% CI, .87–1.00) (Figure 4B).
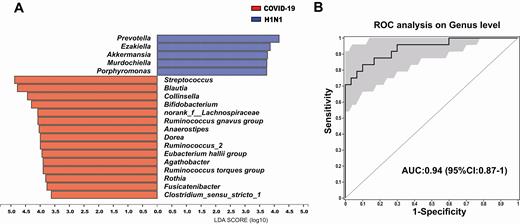
A, Linear discriminant analysis (LDA) effect size analysis was used to differentiate the patients with coronavirus disease 2019 (COVID-19) and those with H1N1. At the genus level, LDA scores showed significant differences in microbiota composition between COVID-19 patients (orange) and H1N1 patients (blue). Only taxa with an LDA threshold > 3.5 are shown. B, Prediction of 7 biomarkers in the microbiome of COVID-19 and H1N1 patients. The area under the receiver operating characteristic (ROC) curve (AUC = 0.94), with 95% confidence interval (CI), is shown in the center.
Relationship Between Gut Microbiota Composition and Clinical Indexes
Spearman analysis was conducted to evaluate the correlation between genera (abundance >0.1%) and clinical indexes, including white blood cell count, CRP, procalcitonin, d-dimer, IL-2, IL-4, IL-6, and TNF-α in COVID-19 and H1N1 patients, respectively. The significance thresholds were absolute correlation coefficients >0.4 and P values <.05, as shown in Figure 5.
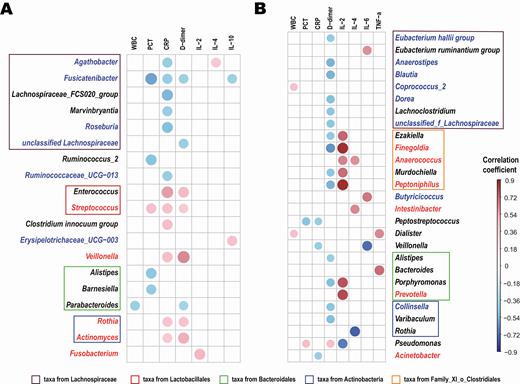
Association between genera composition and clinical indexes. Spearman analysis was conducted to evaluate the correlation between genera (abundance > 0.1%) and inflammatory mediators and cytokines in patients with coronavirus disease 2019 (A) or H1N1 (B), respectively. Significance thresholds included absolute correlation coefficients >0.4 and P < .05. Compared with healthy controls, the blue text represents the significantly decreased genera and the red text represents the significantly increased genera in patients. The degree of correlation is indicated by a color gradient from blue (negative correlation) to red (positive correlation). Abbreviations: CRP, C-reactive protein; IL, interleukin; PCT, procalcitonin; TNF, tumor necrosis factor; WBC, white blood cell.
Compared with HCs, Agathobacter, Fusicatenibacter, Roseburia, and Ruminococcaceae UCG−013 were depleted in COVID-19 patients and were negatively correlated mainly with CRP, procalcitonin, or D-dimer levels. Moreover, CRP and D-dimer levels were positively correlated with COVID-19–enriched bacteria (Streptococcus, Rothia, Veillonella, and Actinomyces) (Figure 5A). In addition, there was a positive correlation between inflammatory cytokines IL-2, IL-4, and IL-6 and the abundance of H1N1-enriched bacteria (Finegoldia, Anaerococcus, Peptoniphilus, Intestinibacter, and Prevotella) (Figure 5B).
DISCUSSION
COVID-19 is a serious global health problem. As of 22 May 2020, >5 million confirmed infections were reported worldwide, with >330 000 deaths [21]. The epidemic has increased awareness of the importance of life, health, and public health. However, differentiating COVID-19 from other respiratory infectious diseases is challenging, especially during influenza season [22, 23]. In this cross-sectional study, we identified specific signatures of the fecal microbiota in COVID-19 patients, H1N1 patients, and HCs in a Chinese population.
Compared with HCs, COVID-19 patients had a significantly lower lymphocyte count and a significantly higher level of IL-6 and TNF-α, which agrees with previous findings [2]. Our results showed that clinical manifestations were similar between H1N1 and COVID-19 patients, and a wider range of detection might be necessary when etiology is identified.
There was a significant decrease in gut microbiota diversity and abundance in COVID-19 and H1N1 patients compared with HCs, which is consistent with previous studies [24, 25], in which low bacterial diversity was associated with respiratory viral infectious diseases. Moreover, there were significant disease-specific shifts in the overall microbiota composition between COVID-19 and H1N1 patients and HCs.
One of the most striking findings was the increased relative abundance of opportunistic pathogens, including Streptococcus, Rothia, Veillonella, Erysipelatoclostridium, and Actinomyces in COVID-19 patients, and these taxa were positively associated with CRP, the index of bacterial infection. Mortality from severe acute respiratory infection is higher in middle-aged and older adults with underlying diseases, and secondary bacterial infections are an important cause of death [2]. Rothia is thought to contribute to the pathogenesis of pneumonia, especially in immunocompromised individuals and patients with retained catheters [26]. Our previous study suggested that Streptococcus and Rothia were associated with susceptibility to secondary bacterial lung infection in patients with avian H7N9 virus infection [27]. Other studies have revealed that changes in the enteric environment and immune factors caused by Actinomyces may aggravate the damage caused by inflammatory bowel disease [28, 29]. In addition, the abundance of BPB decreased whereas the opportunistic pathogens Prevotella, Finegoldia, and Peptoniphilus were enriched in H1N1 patients in our cohort, as observed in H7N9 patients [30]. It is noteworthy that the levels of IL-2 and IL-4 significantly increased in H1N1 patients and highly positively correlated with these enriched bacteria, although their causal relationship needs further exploration.
Increasing evidence indicates the intimate relationship between the gastrointestinal and respiratory tract, which is known as the gut-lung axis [13]. Deriu et al found that influenza infection alters the intestinal microbial profile through a mechanism dependent on type I interferons induced in the pulmonary tract [31]. Respiratory influenza infection caused intestinal injury when lung injury occurred, by recruiting lung-derived CCR9+CD4+ T cells to the small intestine and stimulating the production of interferon-γ by these cells [14]. Studies have identified SARS-CoV-2 RNA in stool specimens of infected patients [9], and RNA analysis demonstrated that the duration of viral shedding from stool was longer than that from respiratory samples [32]. In addition, host ACE2 receptors are highly expressed in the gastrointestinal epithelium [6]. SARS-CoV-2 may interfere with nutrient absorption by binding to ACE2 receptors, causing gastroenteritis-like symptoms and disrupting intestinal homeostasis.
Another important finding was the significant depletion of BPB in our cohort, especially in H1N1 patients vs HCs. Previous studies have demonstrated the importance of BPB, which may be involved in the inflammatory mechanism of viral pneumonia [30, 33]. Studies showed that a high-fiber diet increased the production of short-chain fatty acids, enhanced antiviral CD8+ T-cell immune response during influenza virus infection, and attenuated neutrophil-mediated lung injury, consequently improving survival [15, 34]. In turn, significantly reduced levels of BPB and other commensal bacteria with important physiological functions may promote the overgrowth of intestinal conditional pathogenic bacteria and increase both intestinal mucosal permeability and endotoxin concentrations in the blood, ultimately triggering inflammation, which exacerbates cytokine release [35, 36].
Several limitations of this study should be mentioned. First, this was a single-center, cross-sectional study, with small sample size. Variations among patients at different disease stages of COVID-19 and H1N1 have not been evaluated. Second, although the participants were matched for age, sex ratio, and BMI, gut microbiota can be influenced by other variables, such as diet and lifestyle parameters. Third, while the changes observed in our study are obvious and reproducible, a mechanism that linked viral lung infection with changes in the gut microbiota was not identified.
In summary, we identified significant changes in gut microbial communities in COVID-19 and H1N1 patients and relevant biomarkers of these diseases. Moreover, there were significant changes in the structure and composition of the gut microbiome between these study groups. Specific microbial biomarkers of COVID-19 and H1N1 patients were identified and were correlated with clinical indexes. Notwithstanding, microbial signatures in COVID-19 and H1N1 patients need to be validated in larger cohorts, including subgroups at different stages of the disease.
Supplementary Data
Supplementary materials are available at Clinical Infectious Diseases online. Consisting of data provided by the authors to benefit the reader, the posted materials are not copyedited and are the sole responsibility of the authors, so questions or comments should be addressed to the corresponding author.
Notes
Financial support. This work was supported by the National Science and Technology Major Project (number 2017ZX10204401); the Zhejiang Province Key Research and Development Plan Emergency Project (number 2020C03123); the National Natural Science Foundation of China (numbers 81800457 and 81790631); and the Zhejiang Provincial Natural Science Foundation of China (process number LED20H190001).
Potential conflicts of interest. The authors: No reported conflicts of interest. All authors have submitted the ICMJE Form for Disclosure of Potential Conflicts of Interest.
References
Author notes
S. G., Y. C., Z. W., and Y. C. contributed equally to this work as joint first authors.
L. T. and L. L. contributed equally to this work as joint last authors.

