


Abstract
Typhoid fever remains a major cause of morbidity and mortality in low- and middle-income settings. In the last 10 years, several reports have described the reemergence of typhoid fever in southern and eastern Africa, associated with multidrug-resistant H58 Salmonella Typhi. Here, we identify risk factors for pediatric typhoid fever in a large epidemic in Blantyre, Malawi.
A case-control study was conducted between April 2015 and November 2016. Cases were recruited at a large teaching hospital, and controls were recruited from the community, matched by residential ward. Stepwise variable selection and likelihood ratio testing were used to select candidate risk factors for a final logistic regression model.
Use of river water for cooking and cleaning was highly associated with risk of typhoid fever (odds ratio [OR], 4.6 [95% confidence interval {CI}, 1.7–12.5]). Additional risk factors included protective effects of soap in the household (OR, 0.6 [95% CI, .4–.98]) and >1 water source used in the previous 3 weeks (OR, 3.2 [95% CI, 1.6–6.2]). Attendance at school or other daycare was also identified as a risk factor (OR, 2.7 [95% CI, 1.4–5.3]) and was associated with the highest attributable risk (51.3%).
These results highlight diverse risk factors for typhoid fever in Malawi, with implications for control in addition to the provision of safe drinking water. There is an urgent need to improve our understanding of transmission pathways of typhoid fever, both to develop tools for detecting S. Typhi in the environment and to inform water, sanitation, and hygiene interventions.
Typhoid fever continues to be a major cause of morbidity and mortality in low- and middle-income settings, with an estimated 10–20 million cases and approximately 200 000 deaths occurring annually [1–3]. In South and Southeast Asia, Salmonella Typhi was identified as the most common bacterial pathogen associated with bloodstream infection (BSI) among hospitalized patients between 1990 and 2010 [4]. In contrast, S. Typhi was not described as a major cause of BSI in southern and eastern African countries during the same period, even in centers with long-term bacteremia surveillance [5]. Instead, nontyphoidal serovars of Salmonella were much more prominent causes of BSI. Since 2012, the picture has changed dramatically, with multiple reports describing the emergence of typhoid as a major cause of BSI in southern and eastern Africa [6–9]. Although the drivers of this recent emergence remain unclear, typhoid is now acknowledged as a significant public health problem in both Africa and Asia [10].
Salmonella Typhi is a human-restricted pathogen, and transmission occurs via the fecal-oral route. Its ecological niche after excretion remains poorly described, but there is evidence for heterogeneity in pathways of environmental exposure. For example, typhoid transmission has been linked to contamination of the water supply in Kathmandu, Nepal [11], whereas in Santiago, Chile, endemicity was maintained until the early 1990s through irrigation of salad crops with wastewater [12]. These contrasting data suggest that the critical intervention points at which typhoid transmission may be interrupted in the environment may be context specific. In addition to transmission through an ecological niche, S. Typhi may also be transmitted within the household, most often through direct contamination of food by an infected individual. This type of transmission is not only present in endemic settings, but has led to outbreaks of typhoid after endemicity has been interrupted through widespread sanitation improvements [13]. This poses an additional challenge for control.
Both transmission pathways are important in the spread of S. Typhi, but their relative importance in endemic settings is poorly understood. Risk factor studies have been conducted in a variety of locations, including both endemic and outbreak settings, to better understand the dominant drivers of transmission. Previously identified risk factors for typhoid include recent contact with individuals diagnosed with typhoid or enteric fever [14–16]; food, including consuming flavored ices [17] and ice cream or ice cubes [18, 19]; buying lunch at school [17] or eating roadside or outdoor vended food [18–20]; and drinking unsafe or untreated water at home [16, 19, 21] or drinking water at work [18]. Exposure to water used for purposes other than drinking has also been identified as a risk for typhoid, such as bathing and brushing teeth [19]. Findings on sanitation show that a lack of soap in the household and limited handwashing are associated with typhoid [15, 19, 20, 22, 23], whereas having a latrine in the household has been found to be protective in Indonesia [15] but a risk factor in Nepal [24]. In endemic locations, the majority of work has been done in Asia, Oceania, and South America, and has so far been limited on the African continent [14–23].
These findings implicate a variety of water, sanitation, and hygiene (WASH) factors, but the heterogeneity among locations indicates a need for site-specific investigation, particularly in regions that have been understudied or where typhoid is reemerging. Furthermore, although many food and water exposures have been previously identified, detailed studies describing where in the food preparation or production cycle, or through which aspect of water usage S. Typhi is entering and amplifying, are lacking. This hampers the planning of effective intervention strategies at the source of contamination. Understanding the complexity of WASH factors in transmission has assumed greater importance following the emergence of cephalosporin-resistant typhoid in Pakistan [25], which threatens the role of antimicrobials in typhoid control. While the typhoid conjugate vaccine offers a promising tool for control, targeted WASH interventions are also likely to be necessary.
Blantyre is the second-largest city in the country of Malawi, located in the Southern Region (Figure 1). WASH-related interventions over the last 10 years in Blantyre have focused on water access, with an increase in kiosks, trials of delivery systems, and protection of open sources, but interventions on household water treatment and improved sanitation have been limited. Blantyre has experienced a sharp increase in typhoid, increasing from an average of 14 cases per year between 1998 and 2010, to >700 cases in 2013 [6]. Typhoid has remained endemic in Blantyre, and the mechanism of this sustained transmission is currently unknown. We therefore conducted a case-control study to investigate risk factors for typhoid in this setting.
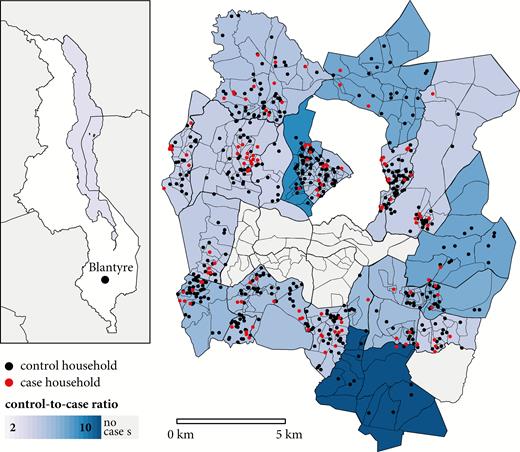
Location of Blantyre within the country of Malawi (inset) and the Blantyre study boundaries. Enumeration areas are represented by the smaller polygons, while residential wards are indicated by the larger, bolded polygons, shaded by the ratio of controls to cases. Households of cases (red) and controls (black) are plotted as points, with precise locations masked by randomization.
METHODS
Queen Elizabeth Central Hospital (QECH) in Blantyre, Malawi, provides free healthcare to urban Blantyre and the surrounding district, and tertiary care to the Southern Region of Malawi. Laboratory surveillance for BSI has been routine since 1998 and is conducted through the Malawi-Liverpool Wellcome Trust Clinical Research Programme, based at QECH [26]. Pediatric patients are eligible for routine blood culture if they present to the hospital with nonspecific febrile illness and test negative for malaria, have persistent febrile illness after treatment for malaria, or are severely ill with suspected sepsis. Blood (2–4 mL) was drawn for each eligible patient, followed by automated culture (BacT/ALERT, bioMérieux) and serotyping for identification of S. Typhi [26].
Cases were defined as children <9 years of age with blood culture–confirmed S. Typhi infection diagnosed between April 2015 and November 2016 at QECH, and who originated from the Blantyre urban area. Eligible controls were healthy children <9 years of age and were recruited at a 4:1 ratio throughout the study period. Children <9 years of age were prioritized for the study because of the known frequency of typhoid in this age group [6]. A high-resolution census subdivided urban Blantyre into 393 enumeration areas (EAs), each with an estimated population size (Figure 1) [27]. To avoid spatial overmatching, which would have made it impossible to identify small-scale spatial heterogeneity of risk, controls were matched by larger residential wards rather than by EA. To approximate the random selection of controls within a ward, we selected EAs with probability proportional to population size. Within each sampled EA, households were approached along a random path until an eligible control was identified and consent was taken from legal guardians.
Exclusion criterion specific to cases after initial recruitment was living outside EA boundaries. For both cases and controls, individuals were excluded if they had a household member who had been previously diagnosed with typhoid during the period of the study.
A standardized questionnaire was administered to the guardians of participants, where guardian was defined as an individual >18 years of age who was a caregiver for the child. The questionnaire recorded both demographic and socioeconomic indicators, as well as potential risk factors for typhoid. The incubation period for typhoid in outbreak settings can be highly variable but is not known to frequently extend for >3 weeks [13]. Therefore, questions distinguished exposure in the last 3 weeks from exposure in the last year. Sources of water for drinking and water used for cooking and cleaning were separately surveyed. The location and altitude of households and identified water sources were collected using Garmin Etrex 30 Global Positioning System (GPS) devices.
Controls were requested to provide a stool sample to describe asymptomatic shedding of S. Typhi, described in Supplementary Materials 1.
Statistical Analysis
Logistic regression was used to assess potential risk factors in the study. Residential ward was included as a fixed effect for all analyses, to take account of the stratified sampling design for controls. The majority of predictor variables were assessed directly from the questionnaire, while distance to hospital, distance to primary water source, and elevation change between the household and water source were calculated for each individual, using the recorded household locations, water source locations, and ascertained GPS coordinates of QECH. Due to the large number of questions in the initial survey, stepwise forward variable selection was conducted to reduce the number to an interpretable size. This process began with the base model, defined as the fixed effect of residential ward, plus intercept. At each iteration, likelihood ratio tests were conducted to compare the base model with each potential variable addition. The variable addition resulting in the lowest P value from the likelihood ratio test was then added to the model. The process was repeated with the base model now updated with the added variable. The process stopped when no variable addition improved the model at a significance level of P < .05.
The final logistic regression model was fitted using the resulting selected variables. Odds ratios (ORs) with 95% confidence intervals (CIs) were calculated using coefficients, and standard errors were estimated from the fitted model. Unadjusted individual ORs were also calculated for each selected variable to assess dependence of multivariate model findings on the combination of included parameters. To enable comparison between continuous variables in the study, we rescaled each so an increase in scaled value is equal to 1 standard deviation increase in the unscaled value. Due to only 1 individual reporting >1 febrile family member, and 1 individual reporting >2 water sources, for the final model fit these continuous variables were converted to categorical variables.
Finally, we extended the multivariate logistic regression model to estimate the potential percentage reduction in cases in our population attributed to removing reported exposures. Detailed methods are described in Supplementary Materials 2. Because we do not know the null exposure value of continuous variables, these calculations were only made for variables that were binary, and those were estimated to be significant in the model.
To investigate spatial correlation in risk within residential wards, we assessed the residuals of the fitted logistic regression model [28]. All statistical analyses were conducted using R statistical software, version 3.5.1 [29].
Ethical Considerations
This study was approved by the University of Malawi, College of Medicine Research and Ethics Committee (P.08/14/1617), the Liverpool School of Tropical Medicine Research Ethics Committee (14.042), and the Lancaster University Faculty of Health and Medicine Ethics Committee (FHMREC17014).
RESULTS
During the study period, 189 children were diagnosed with blood culture–confirmed typhoid (Figure 2). There were no cases of Salmonella Paratyphi A. One hundred twenty-five cases were included in the study, with a median age of 5 (interquartile range, 3–7); 60 patients were not recruited, among whom 35 declined participation, 24 could not be reached after diagnosis, and 1 patient died from complications of perforation prior to recruitment. After recruitment, 2 patients were excluded because they were secondary cases in households that had previously been surveyed, and 2 cases were excluded from the analysis because their household location fell outside the study boundary. One control was excluded due to another household member having culture-confirmed typhoid during the week of recruitment.
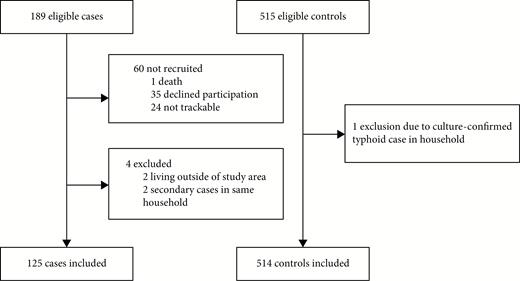
Consolidated Standards of Reporting Trials (CONSORT) flow diagram for cases and controls in the study.
Cases tended to be older than controls (Table 1) but were similar in distribution of sex. Though the overall ratio of controls to cases was 4.2:1, control ascertainment resulted in a heterogeneity of the ratio of controls to cases between residential wards (Figure 1). Six residential wards did not contain any cases. Among the 123 controls tested, none was stool culture positive for S. Typhi, so no further action was taken; however, 3 (2.4% [95% CI, .8%–6.9%]) were polymerase chain reaction positive.
Baseline Characteristics of Cases and Controls Enrolled in the Study
| Characteristic | Cases (n = 125), No. (%) | Controls (n = 514), No. (%) | P Value |
|---|---|---|---|
| Age, y | <.005 | ||
| ≤2 | 28 (22) | 185 (37) | |
| 3–5 | 35 (28) | 209 (40) | |
| 6–8 | 61 (49) | 120 (23) | |
| Sex | .38 | ||
| Male | 61 (49) | 294 (51) | |
| Female | 64 (51) | 278 (49) |
| Characteristic | Cases (n = 125), No. (%) | Controls (n = 514), No. (%) | P Value |
|---|---|---|---|
| Age, y | <.005 | ||
| ≤2 | 28 (22) | 185 (37) | |
| 3–5 | 35 (28) | 209 (40) | |
| 6–8 | 61 (49) | 120 (23) | |
| Sex | .38 | ||
| Male | 61 (49) | 294 (51) | |
| Female | 64 (51) | 278 (49) |
Variable selection reduced the 97 initial variables to 14 (Table 2; Supplementary Materials 3). The 125 cases and 514 controls were reduced to 122 and 507, respectively, due to missing data in the final variable set. Of the 14 final variables selected in the model, 8 were directly related to water exposures.
Estimated Odds Ratios for Univariate Models and Selected Multivariate Model
| Variable | Cases (n = 122) | Controls (n = 507) | Unadjusted OR (95% CI) | P Value | Adjusted OR (95% CI) | P Value | Attributable Risk, % |
|---|---|---|---|---|---|---|---|
| Seeking care at QECH if child is severely ill | 118 (97) | 370 (73) | 10.9 (4.0–30.2) | <.001 | 14.1 (4.7–41.8) | <.001 | … |
| ≥1 household members admitted to hospital for febrile illness in last 4 wk | 9 (7) | 7 (1) | 5.7 (2.1–15.6) | <.001 | 8.9 (1.9–41.2) | .006 | … |
| Cooking and cleaning with river water in the previous 3 wk | 15 (12) | 16 (3) | 4.3 (2.1–9.0) | <.001 | 4.6 (1.7–12.5) | .002 | 10.3 |
| >1 drinking water source used in the last 3 wk | 28 (23) | 38 (7) | 3.7 (2.2–6.3) | <.001 | 3.2 (1.6–6.2) | <.001 | 15.4 |
| Child spends the day at school, preschool, nursery, or any other daycare | 99 (81) | 312 (62) | 2.7 (1.7–4.4) | <.001 | 2.7 (1.4–5.3) | .005 | 51.3 |
| Cooking and cleaning using water from an open dug well in the previous 3 wk | 20 (16) | 35 (7) | 2.6 (1.5–4.8) | .001 | 2.4 (1.1–5.1) | .020 | 8.3 |
| Family grows crops | 47 (38) | 137 (27) | 1.7 (1.1–2.6) | .127 | 1.8 (1.1–3.0) | .027 | 17.4 |
| Age, y, median (range) | 5 (0–8) | 3 (0–8) | 1.7 (1.4–2.1) | <.001 | 1.4 (1.0–1.8) | .053 | … |
| Distance to from household to primary water source, m, median (range) | 78 (1–738) | 52 (0–748) | 1.2 (1.0–1.5) | .013 | 1.2 (1.0–1.6) | .118 | … |
| No. of days water is stored, median (range) | 2 (1–7) | 2 (1–20) | .74 (.6–.96) | .024 | .8 (.6–1.0) | .054 | … |
| Experienced water shortage in the house or surrounding area in the past 2 wk | 38 (31) | 172 (31) | 1.0 (.7–1.6) | .897 | .6 (.3–1.0) | .056 | … |
| Soap available to wash hands after toilet use in the previous 3 wk | 70 (57) | 360 (71) | .5 (.4–.8) | .002 | .6 (.4–.98) | .042 | … |
| Stores drinking water in drum | 0 (0) | 20 (4) | 2.6 × 10⁻⁷ (0–∞) | .977 | 1.2 × 10⁻⁷ (0–∞) | .984 | … |
| Used stream or river water for drinking in the last 3 wk | 0 (0) | 4 (1) | 7.2 × 10 –7 (0–∞) | .984 | 1.1 × 10⁻⁸ (0–∞) | .992 | … |
Data are presented as no. (%) unless otherwise indicated. Numeric variables are scaled for presentation of estimates; thus, ORs are presented as increased risk per 1 standard deviation increase in the value.
Abbreviations: CI, confidence interval; OR, odds ratio; QECH, Queen Elizabeth Central Hospital.
Logistic regression identified several significant risk factors for typhoid in children (Table 2). Factors suggesting environmental exposure included cooking and cleaning with river water (OR, 4.6 [95% CI, 1.7–12.5]) and water from an open dug well (OR, 2.4 [95% CI, 1.1–5.1]), having >1 drinking water source (OR, 3.2 [95% CI, 1.6–6.2]), and being from a household growing crops (OR, 1.8 [95% CI, 1.1–3.0]). Conversely, availability of soap to wash hands after toilet use (OR, .6 [95% CI, .4–.98]) was protective. Risk factors suggesting the importance of social interaction patterns were identified, including spending the day at school or in child care (OR, 2.7 [95% CI,1.4–5.3]) and having 1 or more household members admitted to the hospital with febrile illness in the last 4 weeks (OR, 8.9 [95% CI, 1.9–41.2]). Seeking care for severe illness at QECH was selected for in the model, adjusting for differential case ascertainment through the hospital between cases and controls. Estimates of attributable risk are summarized in Table 2. The highest attributable risk percentage was spending the day at school or daycare (51.3%), followed by growing crops by the household (17.4%). Attributable risk percentages were lower, and similar, for cooking and cleaning with river water (10.3%) and water from an open dug well (8.3%).
There was no significant spatial correlation of residuals from the analysis (Supplementary Materials 3), indicating that the variables in the questionnaire and/or spatially matching on residential ward sufficiently accounted for unexplained spatial variation in risk.
DISCUSSION
This study provides detailed insight into the risk factors for pediatric typhoid in an urban African setting. Our findings point to complex and varied risks for typhoid in Blantyre, including water sources, household indicators of sanitation and hygiene, and social interaction patterns such as school attendance.
In multivariate analysis, cooking and cleaning with river water was the principal environmental exposure identified in the study. Cooking and cleaning with water from an open dug well was additionally identified as a risk factor. No sources of drinking water were associated with typhoid, contrasting with other studies that implicate drinking water sources as risk factors [18, 19, 21, 22]. Potential explanations include that communities are aware of the risks associated with drinking unclean water, but less aware of the risks of indirect exposure, such as through pans or other items that may come into contact with food. Alternatively, people may prioritize safe water for drinking but cannot afford to purchase or transport the volume of safe water needed for use in other household tasks. It is estimated that <5% of the population is connected to the sewage network, with the majority of the population utilizing pit latrines [30]. Open dug wells and nearby rivers used for cooking and cleaning water may become contaminated with runoff from pit latrines, particularly during rain events, providing a plausible epidemiological link.
Our findings indicate that individuals are at a higher risk for typhoid when using multiple drinking water sources. Previous work examining water access in urban Malawi identified limited access hours, tariffs, low water pressure, and too few water kiosks as structural barriers to adequate potable water for household activities [31]. These water access challenges are likely to influence the number and type of water sources used and may necessitate the use of unsafe sources. In other studies, distance, access, and behavioral factors have been found to influence decisions around accessing potable water [32–34].
We also identify risk factors where exposure could occur through either interaction with contaminated environments, infected individuals, or both. Having household members hospitalized for febrile illness was identified as a risk factor, as was attending school or other daycare. In the context of schools, however, it is uncertain whether the key exposure is direct contact with a contaminated environment [35], food handlers contaminating meals [35, 36], or transmission routes such as contact with infectious children. The presence of soap in the household was found to be protective, consistent with findings in other locations [15, 19, 20, 22, 23], further supporting a tool that interrupts exposure.
Coming from a household that grows crops is a risk factor for typhoid in Blantyre, consistent with the experience in Santiago, Chile, where irrigation of crops with wastewater was a driver of typhoid transmission [12]. Neither irrigation with human nor animal waste was found to be a significant risk; however, fecal contamination of food crops still may be possible in Blantyre through runoff from latrines or irrigation with fecally contaminated river water.
Calculation of attributable risk has enabled us to estimate frequency of exposure to these risk factors in the population. Spending the day in school or daycare was associated with the highest attributable risk, highlighting the importance of this common exposure among children in our study and associated challenges with WASH in schools [37]. A small percentage of cases and controls reported cooking and cleaning with river water or water from an open dug well, and thus these factors were associated with lower estimated attributable risks; however, such behaviors are commonly described in qualitative and observational research in Malawi [38, 39]. There is therefore a possibility of underreporting these types of exposures, and further research on quantifying these patterns would be useful. The study has some limitations. The extended incubation period of typhoid necessitated a 2- to 3-week window for assessing potential exposures, and recall bias cannot be excluded. Controls were recruited throughout the study period and not matched over time, limiting our ability to control for seasonality. We focused on young children with the goal of capturing household-related risk factors, assuming that younger children move around the city less than adults and are therefore less likely to become exposed outside the household. Regardless, the potential for differential risk factors for older children and adults may limit the generalizability of these findings to older age groups. We assessed WASH risk factors through a questionnaire rather than by direct observation in or transect walks around participant households. Last, by basing our study on sentinel surveillance of patients presenting to QECH, we have selected for more severe disease and have not captured minimally symptomatic or subclinical typhoid, which may be associated with differential risk factors.
We provide new insights into risk factors for typhoid in an urban African context, challenging the dogma that transmission of S. Typhi can be interrupted solely by the provision of safe drinking water. Instead, we highlight the importance of usage of water for purposes other than drinking, of hand hygiene, and of preschool/daycare attendance in the transmission of typhoid in this setting. Future work should confirm our findings by direct assessment of S. Typhi in the environment. Developing novel tools for the identification of S. Typhi in the environment will help to identify transmission routes rapidly and without in-depth risk factor analyses for each epidemic or endemic location.
Supplementary Data
Supplementary materials are available at Clinical Infectious Diseases online. Consisting of data provided by the authors to benefit the reader, the posted materials are not copyedited and are the sole responsibility of the authors, so questions or comments should be addressed to the corresponding author.
Notes
Acknowledgments. The authors thank the staff and patients of Queen Elizabeth Central Hospital and the University of Malawi College of Medicine, as well as the control participants, for their support.
Financial support. This work was supported by the Bill & Melinda Gates Foundation (grant number OPP1128444). The Malawi-Liverpool Wellcome Trust Clinical Research Programme is supported by the Wellcome Trust Major Overseas Programme (grant number 206545/Z/17/Z).
Potential conflicts of interest. The authors: No reported conflicts of interest. All authors have submitted the ICMJE Form for Disclosure of Potential Conflicts of Interest. Conflicts that the editors consider relevant to the content of the manuscript have been disclosed.
References
Author notes
J. S. G. and F. O. contributed equally to this work.

