


Abstract
Elevated viral load (VL) early after antiretroviral therapy (ART) initiation appears frequently in pregnant and postpartum women living with human immunodeficiency virus; however the relative contributions of pre-ART drug resistance mutations (DRMs) vs nonadherence in the etiology of elevated VL are unknown.
Within a cohort of women initiating ART during pregnancy in Cape Town, South Africa, we compared women with elevated VL after initial suppression (cases, n = 80) incidence-density matched to women who maintained suppression over time (controls, n = 87). Groups were compared on pre-ART DRMs and detection of antiretrovirals in stored plasma.
The prevalence of pre-ART DRMs was 10% in cases and 5% in controls (adjusted odds ratio [aOR], 1.53 [95% confidence interval {CI}, .4–5.9]); all mutations were to nonnucleoside reverse transcriptase inhibitors. At the time of elevated VL, 19% of cases had antiretrovirals detected in plasma, compared with 87% of controls who were suppressed at a matched time point (aOR, 131.43 [95% CI, 32.8–527.4]). Based on these findings, we estimate that <10% of all elevated VL in the cohort may be attributable to pre-ART DRMs vs >90% attributable to ART nonadherence.
DRMs account for a small proportion of all elevated VL among women occurring in the 12 months after ART initiation during pregnancy in this setting, with nonadherence appearing to drive most episodes of elevated VL. Alongside the drive for access to more robust antiretroviral agents in resource-limited settings, there is an ongoing need for effective strategies to support ART adherence in this patient population.
Global uptake of antiretroviral therapy (ART) during pregnancy by women living with human immunodeficiency virus (HIV) has grown rapidly over the past decade [1, 2]. This increase has been accompanied by increasing reports of viremia in women on ART, particularly during the postpartum period [3–6], raising important considerations for both the long-term health of women living with HIV and for prevention of mother-to-child HIV transmission (PMTCT) during pregnancy and breastfeeding [7, 8].
Despite these concerns, there are few data on the etiology of viremia in this context. Nonretention in care and/or nonadherence to ART in this population have been extensively documented [9–11]. While the prevalence of antiretroviral (ARV) drug resistance mutations (DRMs) at the time of ART initiation is increasing in sub-Saharan Africa, the possible relationship of pre-ART DRMs to viremia early after ART initiation is poorly understood [12]. DRMs present before ART initiation may increase the risk of treatment failure, and new DRMs emerge with suboptimal ART adherence, similarly increasing the risk of treatment failure over time.
Insights into the etiology of viremic episodes (VEs) are required to inform intervention strategies. We investigated the relative contributions of ART nonadherence and pretreatment DRMs to the occurrence of VE, and described the emergence and evolution of DRMs associated with VE, in women initiating ART during pregnancy as part of routine care in Cape Town, South Africa.
METHODS
This nested case-control study took place within a larger study evaluating ART use in pregnant and breastfeeding women that has been detailed previously [13]. In brief, the study took place at a large, public-sector primary care community health center in a high-prevalence setting [14]. After providing informed consent, all pregnant women initiating ART as part of routine antenatal care were enrolled into a prospective cohort followed, separately from routine care and ART services, through 12 months postpartum. All clinical care was delivered by public-sector healthcare workers based on the local standard of care. Women initiated ART in pregnancy regardless of previous ARV exposure using a regimen of tenofovir disoproxil fumarate (TDF) 300 mg, emtricitabine (FTC) 200 mg or lamivudine (3TC) 300 mg, and efavirenz (EFV) 600 mg, provided as a once-daily, fixed-dose combination.
At each study visit, trained interviewers administered structured questionnaires and study nurses took venous blood specimens for batched viral load (VL) testing using the Abbott RealTime HIV-1 assay (Abbott Laboratories, Chicago, Illinois) by the South African National Health Laboratory Services. Additional plasma from each visit was stored at –80°C degrees for future testing. Ethical approval for the parent study, including use of stored specimens, was provided by the University of Cape Town and Columbia University Medical Center.
Case-control Design
Within this cohort we have described the time to viral suppression (VS) and incidence of VEs previously [15]. For this case-control study, we defined cases as women in the cohort who achieved initial VS (defined as <50 copies/mL) and then experienced 1 or more VEs (>1000 copies/mL) during follow-up before 12 months postpartum. We defined controls as women in the cohort who achieved and maintained VS throughout the follow-up period; control specimens were incidence-density sampled according the duration of ART use at the time of VE in cases [16]. Figure 1 describes the sampling of cases and controls as well as timing of measurements in the study.
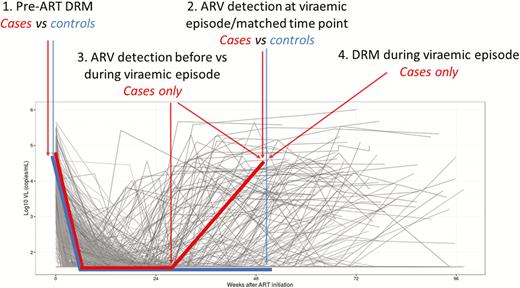
Study schematic depicting the nesting of cases and controls within the parent cohort, and the timing of measures of DRMs and ARV adherence. Abbreviations: ART, antiretroviral therapy; ARV, antiretroviral; DRM, drug resistance mutation; VL, viral load.
Measures
Plasma from the time of enrollment (pre–ART initiation) for all subjects and cases at the time of VE underwent DRM testing using validated next-generation sequencing (NGS) of the reverse transcriptase region of the Pol gene (HXB2 positions 2723–3225; Illumina). In brief, viral RNA was extracted, reverse transcribed, amplified, and sequenced using the Nextera index primer sets. The resulting NGS reads were segregated into unique amplicons, and similar amplicons were combined into consensus sequences [17]. Consensus sequences that contained >0.02% of the total number of amplicons for that sample were analyzed for presence of DRMs using the calibrated population resistance tool. Data on DRMs are presented according to individual mutations, by class of drug to which resistance is conferred, and by the frequency of the mutation (prominent mutations detected in >20% of the total number of consensus sequences for that sample vs low-level mutations detected in 5%–20% of consensus sequences). DRMs found in <5% of the total consensus sequences were ignored.
Subjects who had any significant resistance (>5%) prior to ART initiation and then had a VE where there was also presence of resistance were examined phylogenetically using maximum likelihood trees of all consensus sequences from all time points available. The trees were examined for evolutionary similarity between DRMs found prior to ART initiation and those found during VE.
Adherence was based on drug detection in plasma. We sampled cases for drug detection at the time of VE, and at the last study specimen prior to the time of VE when the subject was still virally suppressed. In controls, adherence was measured during VS; for this, we selected control specimens frequency-matched to cases on the duration on ART at the time of cases’ VE. In these 3 groups of specimens (cases at the time of VE, controls at a matched time point, and cases when VS), we measured adherence using high-performance liquid chromatography coupled with high-resolution mass spectrometry (Q Exactive; Thermo Scientific, Pittsburgh, Pennsylvania) [18, 19]. This assay provides qualitative detection of >20 commonly used ARVs, including all drugs used in South African first- and second-line ARV regimens. Because of the high concurrence in the detection of TDF, FTC, and EFV in these samples, data on adherence are presented as a binary construct (any ARV drug detected vs none detected).
Data on ARV exposure before ART initiation was taken from interview-administered questionnaires, cross-referenced with pharmacy reports and electronic medical records to minimize misclassification. This was classified into previous triple-drug ART use, previous PMTCT exposure (in this setting, historical PMTCT regimens were based on short-course zidovudine with limited use of single-dose nevirapine (NVP) in isolation), or any previous ARV exposure.
Statistical Analysis
Data were analyzed using R software (R Project, Vienna, Austria). Multiple logistic regression, including conditional models for matched data, was used to examine the associations between case/control status and ARV detection or DRMs, after adjustment for differences in demographic and clinical characteristics; under the incidence-density sampling schema used, the resulting odds ratios (ORs) can be interpreted as incidence rate ratios [16]. Using the adjusted associations from these models, we estimated attributable fractions among the exposed (AF) and population attributable fractions (PAF) for the proportion of VE that may be due to ARV nonadherence and DRMs using standard formulae [20].
RESULTS
From the parent cohort, 98 cases and 88 controls were sampled into this study. Complete resistance and ARV adherence data were available on 80 cases and 87 controls, presented here; there were no systematic differences between those included vs those excluded due to missing data. Cases were more likely to have a history of exposure to ARVs, including past PMTCT exposure (31% of cases vs 14% of controls; P = .007) and past ART use (10% of cases vs 2% of controls; P = .036) (Table 1).
Comparison of Cases and Controls According to Demographic and Clinical Characteristics at the Time of Antiretroviral Therapy (ART) Initiation and the Prevalence of Pre-ART Drug Resistance Mutations
| Characteristic | Cases (n = 80) | Controls (n = 87) | P Value |
|---|---|---|---|
| Mean age, y | 27.0 (80) | 29.2 (86) | .015 |
| Married/cohabiting | 20/80 (25.0) | 38/87 (43.7) | .015 |
| Nulliparous | 17/80 (21.3) | 12/87 (13.8) | .204 |
| Newly diagnosed HIV in pregnancy | 40/80 (50.0) | 62/87 (71.3) | .005 |
| ART initiation under Option B+ | 60/80 (75.0) | 69/87 (79.3) | .507 |
| Median gestation at ART initiation, wk | 22 | 20 | .147 |
| Previous history of TB | 13/80 (16.3) | 11/87 (12.6) | .507 |
| Any previous ARV exposure | 30/80 (37.5) | 16/87 (18.4) | .006 |
| Previous PMTCT exposure | 24/80 (31.3) | 12/87 (13.8) | .014 |
| Previous ART exposure | 8/80 (10.0) | 2/87 (2.3) | .049 |
| Median pre-ART VL, log10 copies/mL | 4.01 | 4.00 | .941 |
| VL >5.0 log10 copies/mL | 14/80 (17.5) | 8/87 (9.2) | .113 |
| Median pre-ART CD4 count, cells/μL | 338 | 330 | .816 |
| CD4 count <350 cells/μL | 40/77 (52.0) | 45/84 (53.6) | .837 |
| Pre-ART DRMs | |||
| Any pre-ART DRM | 8/80 (10.0) | 4/87 (4.6) | .234 |
| NNRTI mutations: predominant | 6/80 (7.5) | 4/87 (4.6) | .430 |
| K103N | 4/80 (5.0) | 3/87 (3.5) | .617 |
| V106M | 1/80 (1.3) | 1/81 (1.2) | .952 |
| K101E | 2/80 (2.5) | 0/87 (0) | .138 |
| Y188C | … | … | |
| NNRTI mutations: low-level | 2/80 (2.5) | 0/87 (0) | .138 |
| K103N | 1/80 (1.2) | 0/87 (0) | .296 |
| G190E | 1/80 (1.2) | 0/87 (0) | .296 |
| NRTI mutations: predominant | … | … | |
| NRTI mutations: low-level | … | … |
Data are presented as no./No. (%) unless otherwise indicated.
Abbreviations: ART, antiretroviral therapy; ARV, antiretroviral; DRM, drug resistance mutation; HIV, human immunodeficiency virus; NNRTI, nonnucleoside reverse transcriptase inhibitor; NRTI, nucleoside reverse transcriptase inhibitor; PMTCT, prevention of mother-to-child HIV transmission; TB, tuberculosis; VL, viral load.
Pre-ART DRMs in Cases and Controls
Overall, 10% of cases (n = 8/80) and 4.6% of controls (n = 4/87) had DRMs detected before ART initiation (P = .234; Table 1). After adjusting for differences in demographic and clinical characteristics, pre-ART DRMs were approximately 1.5 times more frequent among women initiating ART who would go on to experience VEs (cases) compared to women who would maintain VS (controls) (adjusted OR, 1.5 [95% confidence interval {CI}, .4–5.9]; Table 2). For both groups, only nonnucleoside reverse transcriptase inhibitor (NNRTI) mutations were detected, mostly predominant mutations involving K103N. In addition, 2.5% (n = 2/80) of cases had low-level NNRTI mutations detected, but no low-level mutations were detected among controls. Among both cases and controls, the occurrence of DRMs was strongly associated with history of previous ART use, but not previous PMTCT use. For example, 37.5% of cases with a history of ART use also had pre-ART DRMs detected, compared to 8% of cases with previous PMTCT exposure and 8% of cases with no previous ARV use (3/8 vs 2/25 vs 4/50, respectively; exact P = .038).
Results of Logistic Regression Models Examining Association Between Pre–antiretroviral Therapy (ART) Drug Resistance Mutations or ART Nonadherence and Case-control Status
| Analysis Population | Exposure of Interest | Odds Ratio (95% CI) | P Value |
|---|---|---|---|
| Cases vs controls | Pre-ART DRMsa | 1.5 (.4–5.9) | .535 |
| Cases vs controls | Nonadherence (no ARVs detected in plasma)b | 131.4 (32.8–527.4) | <.001 |
| Cases only | Nonadherence (no ARVs detected in plasma)c | 58.0 (8.0–418.7) | <.001 |
Abbreviations: ART, antiretroviral therapy; ARV, antiretroviral; CI, confidence interval; DRM, drug resistance mutation.
aModel adjusted for duration of ART use, women’s age, marital/cohabiting status, socioeconomic status, and trial allocation.
bModel adjusted for duration of ART use, women’s age, marital/cohabiting status, socioeconomic status, trial allocation, and history of ARV exposures and pre-ART DRM detection.
cComparison within case subjects, comparing women at the time of viremia to the last preceding time point with viral suppression <50 copies/mL.
Antiretroviral Adherence in Cases and Controls
Table 3 describes cases at the time of VE and controls at a matched time point on ART. The median duration of ART use in the 2 groups was 47 weeks, with most subjects sampled between 24 and 72 weeks on treatment. The mean VL among cases at the time of VE was 4.16 log10 copies/mL; at this point, 19% of cases had any ARV detected in plasma, compared with 87% of controls (P < .001). After adjusting for differences in demographic and clinical characteristics, VS controls were >100 times more likely to have ARVs detected compared with cases at the time of VE (Table 2). Among women selected as cases, we compared ARV detection in plasma at the time of VE to a preceding time point on ART when the same women were virally suppressed. At the preceding time point with VS, 90% of cases had ARV detection in plasma (vs 19% with ARV detection at the time of VE; conditional OR, 58.0 [95% CI, 8.0–418.7]; P < .001). The differences in ARV detection comparing cases vs controls were consistent across ARVs used, persisted after stratification by time of sampling after ART initiation, and persisted in analyses stratified by previous ARV exposure.
Comparison of Cases at the Time of Viremic Episode to the Corresponding Time Point on Antiretroviral Therapy (ART) (Controls), and to the Last Time Point on ART With Virologic Suppression Among Cases
| Characteristic | Cases (n = 80) | Controls (n = 87) | P Value |
|---|---|---|---|
| At time of VE/matched time point (cases and controls) | |||
| Duration on ART, wk, median | 47.2 | 47.1 | .687 |
| ≤24 | 6/80 (7.5) | 10/87 (11.5) | |
| >24–48 | 40/80 (50.0) | 36/87 (41.4) | |
| >48–72 | 26/80 (32.5) | 32/87 (36.8) | |
| >72 | 8/80 (10.0) | 9/87 (10.3) | |
| Mean VL, log10 copies/mL | 4.16 (n = 80) | 1.60 (n = 87) | |
| Proportion VL <50 copies/mL | 0/80 (0) | 86/87 (98.9) | |
| Any ARV detected in plasma | 15/80 (18.8) | 82/87 (94.3) | <.001 |
| TDF | 1/80 (1.3) | 76/87 (87.4) | <.001 |
| 3TC/FTC | 2/80 (2.5) | 79/87 (90.8) | <.001 |
| EFV | 13/80 (16.3) | 82/87 (94.3) | <.001 |
| Other | 1/80 (1.3) | 1/87 (1.2) | .959 |
| At preceding suppressed time point (cases only) | |||
| Duration on ART, wk, median | 39.5 | … | |
| ≤24 | 26/80 (32.5) | … | |
| 24–48 | 38/80 (47.5) | … | |
| 48–72 | 16/80 (20.0) | … | |
| Mean VL, log10 copies/mL | 1.69 (n = 80) | … | |
| Proportion VL <50 copies/mL | 70/80 (87.5) | … | |
| Any ARV detected in plasma | 72/80 (90.0) | … | |
| TDF | 36/80 (45.0) | … | |
| 3TC/FTC | 45/80 (56.3) | … | |
| EFV | 70/80 (87.5) | … | |
| Other | 2/80 (2.5) | … |
Data are presented as no./No. (%) unless otherwise indicated.
Abbreviations: 3TC, lamivudine; ART, antiretroviral therapy; ARV, antiretroviral; DRM, drug resistance mutation; EFV, efavirenz; FTC, emtricitabine; TDF, tenofovir disoproxil fumarate; VE, viremic episode; VL, viral load.
Attributable Fractions for Viremia
Using these data, we estimated the proportion of VEs attributable to either pre-ART DRM or ARV nonadherence among women with either exposure (AF), and then among all women in the cohort (PAF). Based on the adjusted ORs above, the fraction of VEs attributable to DRMs among women with DRMs was estimated at 35% (95% CI, 0–83%), whereas the fraction of VEs attributable to nonadherence in women who were nonadherent is estimated at 98% (95% CI, 88%–99.7%). Figure 2 shows PAF estimates for women in the parent cohort, across a range of exposure prevalences consistent with the observed data. Based on the adjusted ORs, we estimated that in the parent cohort approximately 3%–5% of VEs were attributable to pre-ART DRMs, using an overall pre-ART DRM prevalence of 5%–10%. Meanwhile, at least 90%–95% of all VEs were attributable to nonadherence, using a conservative prevalence of nonadherence of 20%–30%. Across all plausible values for the true frequencies of pre-ART DRMs and nonadherence in the cohort, the PAFs associated with ART nonadherence were substantially higher than those associated with pre-ART DRMs.
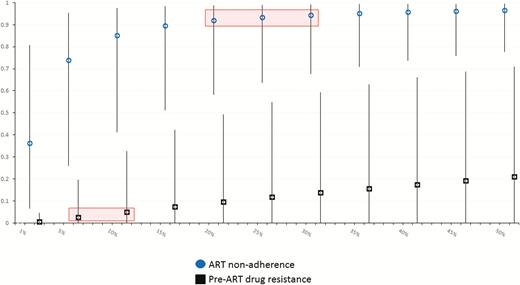
Estimated population attributable fractions (PAFs; y-axis) for viremic episodes in this cohort. PAFs associated with antiretroviral therapy (ART) nonadherence (circles) and pre-ART drug resistance mutations (squares) are shown at different prevalences of either exposure (x-axis), based on adjusted associations in the observed data, with 95% confidence intervals. The range of estimated PAFs based on the observed data is indicated with shaded boxes.
DRMs at Time of Viremia
Table 4 shows the occurrence of DRMs at the time of VE among 78 cases with DRM data available. Half of all women had DRMs detected during VE (n = 39/78). The vast majority of DRMs detected (n = 34/39 [87%]) were NNRTI mutations, predominantly K103N, V106M, and K101E. Low-level NNRTI mutations (5%–20% consensus sequences) were detected in a minority of women (n = 9/78), and only 1 nucleoside reverse transcriptase inhibitor DRM was detected, a low-level K65R mutation. When cases were divided by pre-ART DRM detection, predominant NNRTI mutations at the time of VE were significantly more common in women who had pre-ART DRMs detected (n = 6/7 [86%]) compared to women without pre-ART DRMs (n = 28/71 [39%]; exact P = .039). However, among cases there was no variation in the frequency of DRMs according to previous ARV exposure: 59% of cases with any previous ARV exposure had DRM detection at the time of viremia (n = 16/29) vs 47% of cases with no previous ARV exposure (n = 23/49) (P = .640). In addition, at the time of VE, the detection of DRMs was associated with the detection of ARVs in the same specimen. Of 14 cases with ARVs detected at the time of VE, 86% (n = 12) had predominant NNRTI mutations at the same time, compared to 42% of cases without ARV detection at the time of VE (exact P = .006).
Prevalence of Drug Resistance Mutations (DRMs) in Cases at the Time of Viremic Episode, in Total and According to the Detection of Pre–antiretroviral Therapy DRMs
| Characteristic | All Cases at VE | Cases With No Pre-ART DRM Detected | Cases With Pre-ART DRM Detected |
|---|---|---|---|
| No. of subjects | 78 | 71 | 7 |
| Any DRM at time of VE | 39/78 (50.0) | 33/71 (46.5) | 6/7 (85.7) |
| NNRTI mutations: predominant | 34/78 (43.6) | 28/71 (39.4) | 6/7 (85.7) |
| K103N | 16/78 (20.5) | 11/71 (15.5) | 5/7 (71.4) |
| V106M | 13/78 (16.7) | 12/71 (16.9) | 1/7 (14.3) |
| K101E | 6/78 (7.7) | 5/71 (7.0) | 1/7 (14.3) |
| Y188C | 1/78 (1.3) | 1/71 (1.4) | … |
| Y188I | … | … | … |
| L100I | 1/78 (1.3) | 1/71 (1.4) | … |
| NNRTI mutations: low-level | 9/78 (11.5) | 8/71 (11.3) | 1/7 (14.3) |
| K103N | 1/78 (1.3) | 1/71 (1.4) | … |
| V106M | 4/78 (5.1) | 4/71 (5.6) | … |
| K101E | 1/78 (1.3) | 1/71 (1.4) | … |
| Y188C | 2/78 (2.6) | 2/71 (2.8) | … |
| Y188L | … | … | … |
| L100I | 1/78 (1.3) | … | 1/7 (14.3) |
| NRTI mutations: predominant | … | … | … |
| K65R | … | … | … |
| NRTI mutations: low-level | 1/78 (1.3) | … | 1/7 (14.3) |
| K65R | 1/78 (1.3) | … | 1/7 (14.3) |
Data are presented as no./No. (%) unless otherwise indicated. Two cases were not sequenced at the time of VE.
Abbreviations: ART, antiretroviral therapy; DRM, drug resistance mutation; NNRTI, nonnucleoside reverse transcriptase inhibitor; NRTI, nucleoside reverse transcriptase inhibitor; VE, viremic episode.
We examined the consensus sequences for cases who had presence of any resistance (>5% consensus sequences) prior to ART initiation and then experienced a VE where there was also presence of resistance (n = 7). For 6 of the 7 patients, >95% of the consensus sequences from their initial time point had the presence of K103N or K101E, and for all these patients, >95% of their consensus sequences at the time of VE contained the same mutation. Only 1 of these 7 patients gained additional mutations after ART initiation, with K103N present pre-ART and then M184I and M184V acquired by the time of the VE.
DISCUSSION
This study provides novel insights into the etiology of viremia following initiation of ART during pregnancy in South African women. Both clinical and phylogenetic analyses in this cohort indicate that pre-ART DRMs are likely to play a relatively small role in the incidence of viremia after initial viral suppression; instead, ART nonadherence appears to explain the vast majority of new VEs.
We found the prevalence of pre-ART DRMs in this cohort to be 10% among women experiencing VE during follow-up, compared to 5% among women who remained virologically suppressed. Both the overall prevalence of pre-ART DRMs and the distribution of mutations, with a predominance of NNRTI-related mutations, are in keeping with surveillance data from South and southern Africa [21]. Pre-ART DRMs were strongly associated with history of ART use, but we saw no difference in the prevalence of pre-ART DRMs among women who reported only previous PMTCT use vs those who reported no previous ARV exposure (ie, no past PMTCT or ART use). This may be explained in part by absence of single-dose NVP use in this setting; historically, PMTCT regimens in Cape Town have always combined zidovudine with NVP, and/or used different approaches to cover the long half-life of NVP postpartum, to reduce NNRTI resistance. However, this observation may also be due to misclassification of self-reported ARV exposures, and the observed pre-ART DRMs among women with no self-reported history of ARV use (8%) should be interpreted with caution.
In this group of women who achieved VS after ART initiation in pregnancy and were followed for up to 1 year postpartum, we found that pre-ART DRMs were only weakly associated with the occurrence of viremia after initial viral suppression on ART in this cohort. However, we estimate that among women with pre-ART DRMs in the cohort, approximately one-third of their VEs may be attributable to the DRM. However, the number of DRMs detected here is low, leading to imprecise estimates and limiting the PAF for VEs in the total cohort that may be attributed to pre-ART DRM.
The detection of ARVs among cases at the time of VE (19%) was markedly lower than detection among controls who maintained VS on ART (94%) as well as among cases at a preceding time point when women were virally suppressed (90%). Based on these findings, we estimated that at least 90% of all VEs observed in this cohort may be attributable to ART nonadherence. These data should be interpreted in light of the plasma half-lives of the ARVs detected, ranging from 15 to 17 hours for TDF, 5 to 10 hours for 3TC/FTC, and 40 to 55 hours for EFV. Combined with the sensitive nature of the assay used here, the measure of adherence used here likely reflects pill-taking behaviors in the 2–4 days before sampling, approximately, but does not address patterns of adherence over longer time spans.
The finding for most VEs in this cohort being attributable to ART nonadherence is supported by the evidence from our phylogenetic analyses. Among the 7 cases with DRMs detected both pre-ART and at the time of VE, in only 2 subjects was there evidence of viral evolution suggestive of ongoing viral replication in the presence of ART; thus, even among women with pre-ART DRMs in the study, adherence to ART may be the most likely explanation for the observed VEs. With half of all women with viremia on ART having evidence of DRMs at the time of VE, it is clear that DRMs emerge rapidly with suboptimal ART adherence using TDF + 3TC/FTC + EFV. Most DRM observed at the time of VE (85%) were in women with no pre-ART DRMs detected, and among these, all involved NNRTIs, pointing to the limitations of EFV in first-line ART regimens. These early DRMs have clear implications for the durability of therapy over the long term [22, 23], and these data support the potential benefits of integrase inhibitors (INSTI), in particular dolutegravir (DTG), as more durable first-line agents with a high barrier to DRMs. While we expect to see expanded use of DTG as a first-line agent in the near future, it is unclear whether the etiology of VEs would differ when using a INSTI- vs NNRTI-based first-line regimen. With the shift to INSTI-based regimens globally, it will be critical to monitor patterns of viral control on ART as well as ongoing surveillance for DRMs. For example, given our finding for only a weak association between pre-ART DRMs and subsequent VEs, we would expect DTG-based regimens to cause significant reductions in the incidence of VE only if they lead to much better ART adherence and/or are markedly more potent such that they sustain VS in the face of suboptimal adherence. Unfortunately, at this time there are no data to support this hypothesis.
This is a cohort of patients receiving routine clinical care in one part of South Africa, and the findings may require caution when generalizing to other settings. However, we note that the challenges of ART nonadherence in this patient population have been documented in many different settings, and concerns regarding the rising prevalence of NNRTI resistance are widespread [3–11]. In addition, this case-control study is restricted to women who achieved VL <50 copies/mL during the follow-up period; thus women who never achieved VS, who may be more likely to have a DRM at the time of ART initiation, are not included. In turn, the prevalence of pre-ART DRMs documented here is likely to be somewhat lower than the overall population of women initiating ART in pregnancy.
These data may help to inform interventions to improve VS in women using ART during pregnancy and breastfeeding. While resistance testing before ART initiation in this patient population is routine in some places [24], these findings suggest that it is unlikely to predict the risk of VEs in this setting, at least in the short term. Alternatively, interventions to improve ART adherence have the potential to prevent a much larger proportion of VEs, recognizing the challenges of delivering effective adherence promotion interventions at a programmatic level [25, 26]. Taken alongside the global movement toward more robust ART regimens including DTG [27], these data underscore the importance of ongoing efforts to enhance ART adherence in women during pregnancy and postpartum.
Notes
Financial support. This research was supported by the National Institutes of Health (NIH) (grant number R01HD074558) with additional funding from the Division of Intramural Research, National Institute of Allergy and Infectious Diseases, NIH.
Potential conflicts of interest. A. B. and W. C. have received grants from Thermo Fisher Scientific. All other authors report no potential conflicts of interest. All authors have submitted the ICMJE Form for Disclosure of Potential Conflicts of Interest. Conflicts that the editors consider relevant to the content of the manuscript have been disclosed.
Presented in part: Conference on Retroviruses and Opportunistic Infections, Boston, Massachusetts, 4–7 March 2018.

