


Abstract
The Centers for Disease Control and Prevention (CDC) recently published interim guidance for a public health response to contain novel or targeted multidrug-resistant organisms (MDROs). We assessed the impact of implementing the strategy in a US state using a mathematical model.
We used a deterministic compartmental model, parametrized via a novel analysis of carbapenem-resistant Enterobacteriaceae data reported to the National Healthcare Safety Network and patient transfer data from the Centers for Medicare and Medicaid Services. The simulations assumed that after the importation of the MDRO and its initial detection by clinical culture at an index hospital, fortnightly prevalence surveys for colonization and additional infection control interventions were implemented at the index facility; similar surveys were then also implemented at those facilities known to be connected most strongly to it as measured by patient transfer data; and prevalence surveys were discontinued after 2 consecutive negative surveys.
If additional infection-control interventions are assumed to lead to a 20% reduction in transmissibility in intervention facilities, prevalent case count in the state 3 years after importation would be reduced by 76% (interquartile range: 73–77%). During the third year, these additional infection-control measures would be applied in facilities accounting for 42% (37–46%) of inpatient days.
CDC guidance for containing MDROs, when used in combination with information on transfer of patients among hospitals, is predicted to be effective, enabling targeted and efficient use of prevention resources during an outbreak response. Even modestly effective infection-control measures may lead to a substantial reduction in transmission events.
The emergence of novel pathogens and resistance mechanisms poses a serious threat to human health, and healthcare settings often act as important amplifiers for transmission of emerging pathogens [1–3]. Accordingly, prevention efforts frequently include interrupting transmission in healthcare facilities to reduce infection-associated morbidity and mortality. Since first being reported in the United States in 2001, carbapenemase-producing (CP) Klebsiella pneumoniae and other carbapenem-resistant Enterobacteriaceae (CRE) have become important causative agents of healthcare-associated infections, with relatively few treatment options [4]. Patients with CP-CRE infections have been identified in all US states [5]. In addition to CP-CRE, other emerging multidrug-resistant organisms (MDROs) (eg, Candida auris) have demonstrated the ability to amplify in healthcare settings, necessitating an aggressive public health response in these settings to prevent infections among patients at risk and to slow their regional spread.
The Centers for Disease Control and Prevention (CDC) has issued interim guidance for slowing the spread of novel or targeted MDROs (henceforth referred to as CDC guidance for containing MDROs) [6]. The strategy is based upon 5 pillars: 1) rapid detection of targeted pathogens and their resistance mechanisms, 2) on-site infection-control assessments by trained experts to identify gaps in infection prevention, 3) screening of exposed contacts to identify asymptomatic colonization for targeted pathogens, 4) coordination of the response among facilities, and 5) continuing these interventions until transmission is controlled [7]. This study aims to predict the regional effects of implementing an approach that targets a subset of facilities using a transmission model that includes patient transfer patterns in a region.
METHODS
Analytical Background
The regional transmission model is a multifacility SIS (susceptible—infected/infectious—susceptible) model that assumes N constant occupancy facilities (hospitals, nursing homes, communities, etc.) linked through patient transfer. The dynamics of the prevalence at facility a are governed by
Here, is the transmissibility at facility a (the number infected per unit time by an infectious person introduced into facility a when all others at the facility are susceptible), is the carriage clearance rate, is the average length of stay at facility a, and represents the fraction of admissions at facility a that are transfers from facility b. The first term on the right-hand side represents incident cases at the facility; the second, loss of cases through clearance and discharge; and the third, introduction of cases at admission through transfers from other facilities in the network. Further analytical details are in the Supplementary Material.
Patient Flow Network
The patient flow network is characterized by the facility-to-facility transfer tallies , the number of admissions (and discharges) aggregated over a given time interval, and the average lengths of stay . The principal source for these quantities is the Centers for Medicare and Medicaid Services (CMS) patient-level fee-for-service claims data for CMS beneficiaries. The dataset allows every claim to be tracked by an anonymized unique patient identifier, a facility identifier, and admission and discharge dates, to weave together the patient flow network, either across the United States or by state or group of states. In practice, the tallies were aggregated over a single calendar year. For transfers among facilities, tallies were aggregated by the date of the second admission and by the time from the first discharge to the second admission (a day or less for direct transfers, longer for indirect). Discharge and admission dates were used to estimate average lengths of stay, by facility.
Tracking the flow of those with any healthcare encounter in the CMS dataset, we find that, on average, most of their time is spent in the community and not within healthcare facilities. Thus, the communities are important reservoirs in the network. In order to capture the clustering reflected in the communities, the Dartmouth Atlas of Health Care Hospital Referral Regions (HRRs) [8] were used as the community components of the patient flow network: a patient who was not transferred to another facility was ascribed to the HRR associated with the facility or its zip code.
The patient flow network is built from CMS fee-for-service claims data that track CMS beneficiaries only and a census of persons 65 years and older in the HRRs. The occupancy and transfer numbers used are expected to underestimate their true values. However, in our model (equation 1), it is the relative values of these numbers, rather than their absolute values, that determine the dynamics.
Disease Characteristics
The characteristics of the infectious disease that are relevant to our model are the clearance rate and the setting specific transmissibility, . Since the model implicitly assumes a constant population where births and deaths balance, the death of an infectious person and clearance—both resulting in the replacement of an infectious person by a susceptible person—are quantitatively indistinguishable. Thus, captures both mortality and clearance rate. For CRE, the clearance rate is an input parameter in our model, estimated from a review of the literature [9].
The estimation of transmissibility, which is disease and setting specific and may vary due to changes in infection-control practices, etc., is particularly challenging. To estimate the transmissibility for CRE, we used data on positive laboratory tests for CRE reported to the National Healthcare Safety Network (NHSN) in 2015 from 3 states with mandatory reporting of CRE, tallied by the hospital where the specimen was collected. In addition, we made several assumptions: First, based on an examination of the annual number of cases of CRE reported to NHSN, that the situation in 2015 was approximately a steady, or endemic, state for CRE. Second, that the proportion of laboratory-positive cases among all infected persons (who are assumed to be infectious) is a constant. Third, that the admission prevalences at all hospitals within each HRR were identical. And, finally, that the transmissibility depends only on the type of hospital (short-stay versus long-stay). Denoting the number of positive laboratory tests for CRE from facility a by (and the number of admissions by ), and the proportion of laboratory positives among all infected as p, we may write the following:
For short-stay hospitals, the appropriate regression model is
which yields, for , the transmissibility at short-stay hospitals,
where is the coefficient of in model (3). For long-stay hospitals, the appropriate regression model is
If and are the intercept and coefficient of , respectively, in model (5), then we obtain, for , the transmissibility at long-stay hospitals,
Further, p, the fraction of all infected cases that are laboratory positive for CRE, is estimated as follows:
Containment of Multidrug-resistant Organisms
The CDC guidance for containing MDROs [6] was translated for the simulation as follows. Consistent with guidance for the control of organisms with resistance mechanisms novel to the United States (tier 1 organisms), the infection-control intervention (ie, timely implementation of enhanced infection-control measures and contact investigation) is assumed to lead to a specified fractional reduction in the transmissibility at the facility where it is implemented. We varied the specified fractional reduction in transmission within intervention facilities to assess the regional effects for interventions of varying effectiveness. Implementation is facility-wide and is triggered when the cumulative number of admitted and incident infectious persons at a facility exceeds , corresponding to 1 expected laboratory-positive patient. Enhanced infection-control measures decreasing the transmissibility, , starts 30 days after the trigger event (allowing time for testing of the index patient and to institute improvements in infection-control measures) at the targeted facilities, which include the triggering facility, the upstream facility most likely to supply infectious persons, and the downstream facility most likely to receive infectious persons (representing healthcare investigation). Point prevalence surveys are conducted at the targeted facilities starting 2 weeks after initial implementation and every 2 weeks thereafter; if the number of infected persons (carriers and clinical cases) detected is less than 1 at 2 successive point prevalence surveys at a facility, enhanced infection-control measures are stopped. Enhanced infection control may resume at a facility if an additional trigger event is detected there or at a connected facility.
Simulations
Simulations were run on a network of short-stay and long-stay acute-care hospitals within a US state (state A). (Nursing home transmissibility could not be estimated using the methods discussed here since NHSN does not cover nursing homes, which were excluded from the simulation network.) Outbreaks were simulated on the network by seeding a selected facility with an index case and then solving equation (1) for the hospital and community prevalence values as functions of time using a numerical differential equation solver (package deSolve on R). For each run, the value of the transmissibility at each hospital was selected randomly from a probability distribution parametrized by the statistically fitted values from models (3) and (5). The containment strategy was evaluated by comparing outbreaks that were identically initiated and parametrized, run with and without the infection-control measures triggered by the containment strategy (Table 1).
Summary of Parameter Values and Sources
| Parameter | Value | Source |
|---|---|---|
| Disease parameters | ||
| Carriage clearance rate, | 1/387 per day | Reference [9] |
| Transmissibility (short stay), | 0.104 (95% CI, .071–.125) per day | Estimated (NHSN, CMS claims) |
| Transmissibility (long stay), | 0.042 (95% CI, .036–.048) per day | Estimated (NHSN, CMS claims) |
| Intervention parameters | ||
| Intervention start delay | 30 days | Informed guess (CDC) |
| Interval between PPSs | 14 days | Informed guess (CDC) |
| Negative PPSs to stop intervention | 2 | Informed guess (CDC) |
Abbreviations: CDC, Centers for Disease Control and Prevention; CI, confidence interval; CMS, Centers for Medicare and Medicaid Services; NHSN, National Healthcare Safety Network; PPS, point prevalence survey.
RESULTS
Patient Flow Network
The regional model (Figure 1), constructed using CMS claims data tracking the flow of CMS beneficiaries in state A, included 160 hospitals (median Medicare beneficiary patient census, 52; interquartile range [IQR], 19–92; total of 11 184 patients; median facility-level mean length of stay, 7.0 days; IQR, 6.0–8.0 days), 10 HRRs (population range, 52 240–623 900; total population, 2 410 291), 27 580 direct hospital-to-hospital transfers, and 502 270 discharges from hospitals to the HRRs, annually.
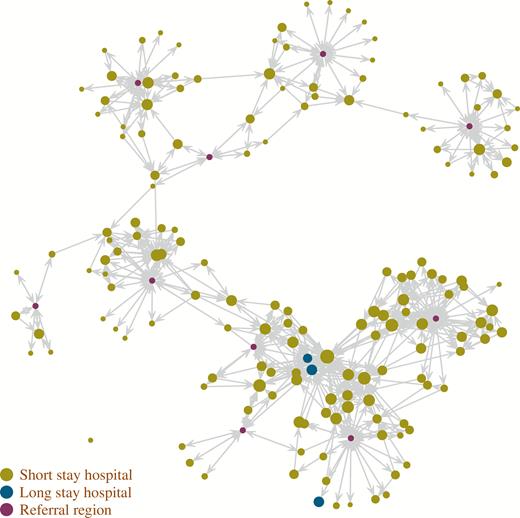
Patient transfer network in state A, based on the movement of Medicare fee-for-service beneficiaries. The location of hospitals does not correspond to geographical coordinates. Arrows correspond to at least 10 transfers per year. The hospital dot size is based on average occupancy.
Disease Characteristics
Estimates of transmissibility at hospitals were based on 3085 positive CRE laboratory test results reported to NHSN from samples collected at 196 hospitals across 30 HRRs in the United States in 2015. The average length of stay and the number of positive results divided by the number of admissions in 2015 at each hospital (plotted in Figure 2) were fitted using regression models (3) and (5), using the break in the average length of stay data at approximately 15 days to separate short- and long-stay hospitals. Finally, using equation (4), = 0.104 (95% confidence interval, 0.071–0.125), and using (6), = 0.042 (0.036–0.048) per day, or approximately 1 transmission for every 9.6 or 23.8 days of stay of an index infected or colonized person at a short- or long-stay hospital, respectively (Table 1). In addition, equation (7) yields p = .137 or approximately 1 in 7.3 (the proportion of infected or colonized persons who have a positive clinical [ie, nonsurveillance] culture).
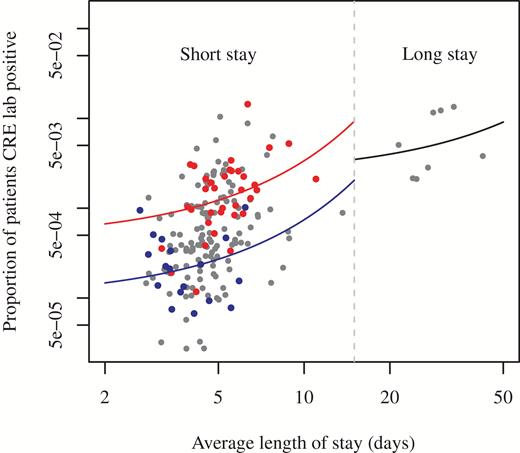
Proportion of patients with clinical isolates that were tested positive for CRE (NHSN laboratory results from 3 states, 2015) versus average length of stay, by reporting hospital. The continuous lines represent regression fits, used for estimation of transmissibility. The blue and red lines are fitted to the blue and red dots, respectively, representing short-stay hospitals from 2 different exemplar HRRs. Abbreviations: CRE, carbapenem-resistant Enterobacteriaceae; HRR, Healthcare Hospital Referral Region; NHSN, National Healthcare Safety Network.
Simulations
Simulations were run with transmissibility drawn randomly from probability distributions (one for short-stay, another for long-stay hospitals), as well as for uniform transmissibility across each type of hospital (where transmissibility at each hospital takes on the mean value rather than one drawn from a distribution) (Figure 3). Heterogeneity in transmissibility results in more transmissions and, consequently, larger outbreaks. Across the heterogeneous simulations where enhanced infection control was implemented as a 20% reduction in , 84 (IQR, 77–89) of 160 hospitals had been targeted for intervention after 3 years into the outbreak. During the third year, 42% (IQR, 37–46%) of inpatient days (and, of patients on average) were under intervention. The reduction in the number of infectious persons 3 years into the outbreak was 76% (IQR, 73–77%) across simulations (Figure 3).
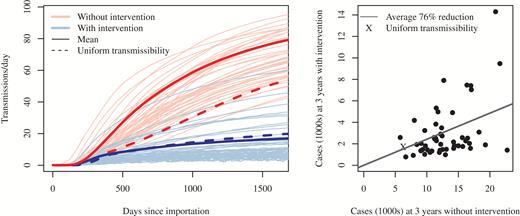
Left: Trajectories of simulated regional outbreaks with intervention that resulted in a 20% reduction in transmissibility at targeted hospitals, compared with the course of the outbreak with no intervention. Each pair of trajectories (blue and red, with and without containment, respectively) differs from other pairs in transmissibility. Right: Comparison of the number of prevalent cases 3 years into the outbreak, with and without containment. Each dot (and an “X” for the uniform draw) represents case counts at 3 years with and without intervention for a single draw from the 2 transmissibility probability distributions (short- and long-stay).
An additional set of simulations explored the effect of varying the reduction in the transmissibility, , on the outbreak. As expected, the size of an outbreak decreases with increasing effectiveness of the intervention (Figure 4). As the effectiveness of the intervention increases, there is a diminishing return on the percent reduction in cases, with a plateau reached at approximately 40%. However, increased intervention effectiveness has the benefit of reducing the proportion of inpatient days that are subject to the intervention throughout the simulated intervention-effectiveness range (Figure 5).
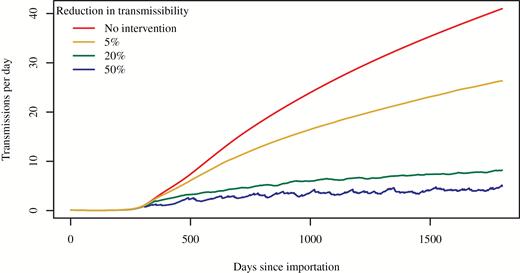
Course of outbreak without and with intervention, by intervention effectiveness (percent reduction in transmissibility). All 4 simulations assumed transmissibility was uniform within facility type (ie, 1 uniform value for all short-stay hospitals and another uniform value for all long-stay hospitals).
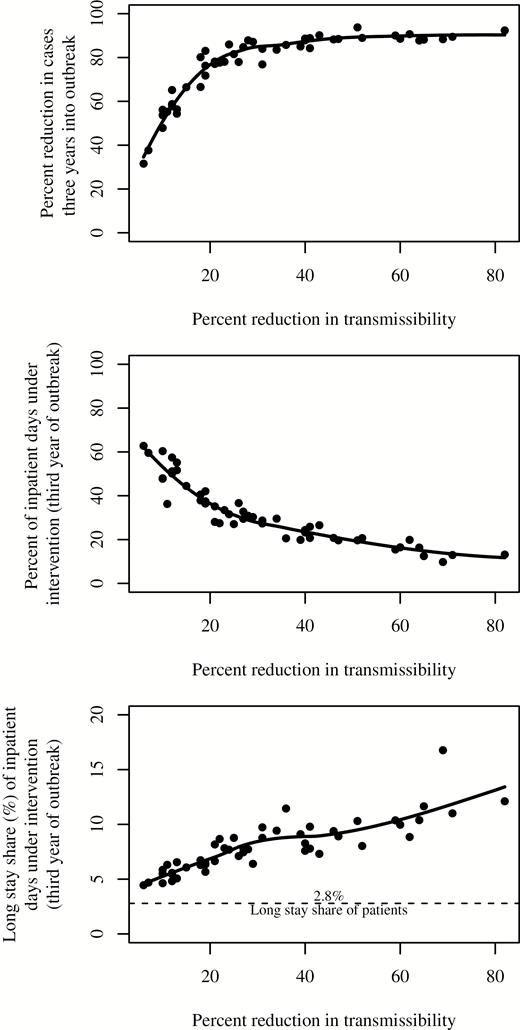
Relative reduction in prevalent case count 3 years into the outbreak (top), proportion of total inpatient days that were targeted for enhanced infection-control measures (intervention) during the third year of the outbreak (center), and proportion of inpatient days under additional infection-control measures that were at longer-stay hospitals during the third year of the outbreak (bottom) versus reduction in transmissibility within targeted facilities due to intervention. The solid lines are locally estimated scatterplot smoothing fits to the simulation results.
DISCUSSION
This model indicates that implementation of the CDC guidance for containing MDROs, simulated on a state network of healthcare facilities interconnected through patient transfers, may have a substantial impact on the regional spread of a healthcare-associated MDRO. The simulation suggests that the impact is achievable even when intervening in a subset of all facilities, and with modest reductions in intrafacility transmission. For example, a 20% reduction within intervention facilities results in an estimated 76% decrease in regional cases. The MDRO containment strategy parallels the successful ring vaccination strategy in smallpox eradication [10]. Ring vaccination followed up thorough investigation of confirmed smallpox patients with rapid vaccination of close contacts, as well as their close contacts. The containment strategy implements transmission risk reduction measures (akin to vaccination) at the facility, and then the neighboring facilities most connected through patient transfer (contacts) upstream and downstream. The success of ring vaccination for smallpox eradication exemplifies the judicious use of scarce resources. Similarly, the trade-off between the degree of reduction in transmissibility, and the duration and coverage of infection-control measures in our results, highlights opportunities for judicious allocation of resources by local health departments and hospitals to maximize impact. The diminishing returns on decrease in transmissibility, as well as the trade-off between decreasing transmissibility and duration of intervention, can be inputs to a planned cost analysis of the containment strategy.
Our results are consistent with successful demonstrations of MDRO containment through regional implementation of these types of responses in the past. After the 2006 introduction of a clonal outbreak of CRE in Israel, a national response aimed at preventing further CRE transmission was undertaken including hospital-level assessments of infection-control and microbiology practices, noting areas of improvement, contact isolation of CRE carriers, and monthly feedback on performance. These efforts resulted in a 71% decrease from peak incidence [11]. Smaller-scale public health responses in Tennessee and Iowa have also been successful in containing the introduction of novel organisms and resistance mechanisms [7].
Our results are based on a mathematical transmission model of an emerging MDRO (CRE) parametrized through novel statistical analyses of NHSN data on clinical isolates. The analyses yield estimates of the epidemiologically important ratio of clinical infections to carriers, as well as of setting-specific transmissibility parameters. This is salient since test results of clinical isolates may be all that is available in the emergent phase of a novel MDRO. Our parameter estimates are similar to those reported elsewhere using other analytical methods and based on different datasets [9, 12]. The analytical steps presented here, from model parametrization to evaluation of a containment strategy, are therefore robust and can be adapted to other novel MDROs that are principally transmitted in healthcare settings.
The interventions described here require a level of capacity and expertise that, until recently, has not been widely available in the United States. Beginning in 2016, CDC has used funding provided to combat antibiotic resistance to begin to build the public health infrastructure needed to support such a response. CDC now funds all 50 states, Puerto Rico, the District of Columbia, and 5 other large cities in order to build expertise in state and local health departments in responding to prevent transmission of resistant pathogens and to detect carbapenemase-producing organisms. Health departments have the capacity to work with and across all facilities in a jurisdiction and are well positioned to facilitate truly regional interventions. The Antibiotic Resistance Laboratory Network has increased early detection of emerging MDROs and provided free screening nationally (through 7 regional laboratories) for new and emerging MDROs. This work has led to unprecedented levels of facility- and patient-level data that continue to inform response efforts, including identifying more refined approaches to preventing transmission. These newly established laboratory and infection-control resources have the potential to slow the spread and reduce the impact of antibiotic resistance in the United States.
There are a number of limitations to this study. The results are based on the network of hospitals in 1 US state and may not be generalizable. In addition, nursing homes are not included in the model because data on them were either incomplete or unavailable. Longer-stay post–acute-care facilities were not included and the model might overestimate the importance of facility connectedness as means to target facilities at high risk for driving amplification of CP-CRE within a region over other characteristics like length of stay and acuity of care. Preliminary results from provisionally parametrized models suggest that the inclusion of nursing homes yields broadly similar results for the public health impact (proportion of cases averted, for example) of the intervention. Further, our model treats each hospital as a homogeneous unit and is unable to capture the finer ward-level components of the MDRO containment strategy. While deterministic models with wards, or agent-based models, may be able to capture such details, the paucity of data to parametrize more granular models is a challenge. Note that this lack of intrafacility granularity in our model is expected to lead to an overestimation of the number of patient-days under enhanced infection-control measures. Finally, the parametrization method we used assumes endemicity and is not, therefore, applicable to data from the emergent phase of an outbreak. However, the mathematical expressions remain good approximations even outside the strict bounds of endemicity, leading to reasonable parametric estimates. We note, too, that while simulations may be used to explore effects of variations in the containment protocol, a comprehensive examination of those effects is beyond the scope of this study. (Analyses of the effect of reducing start-up delay from 30 to 7 days show very small public health impact.)
In conclusion, in this model of a strategy to contain the emergence of a targeted resistant pathogen, even modestly effective infection-control interventions led to substantial reductions in transmission events. Further, targeting these interventions to a subset of facilities based on information on regional transfer of patients among hospitals enables targeted and more efficient use of prevention resources during an outbreak response. Further work will be needed to identify if these findings hold in more complex models that more closely resemble the current US healthcare system. In the meantime, use of models of this type, parameterized using local patient transfer data, might be a reasonable approach to guiding a public health response to containing MDROs in a region.
Supplementary Data
Supplementary materials are available at Clinical Infectious Diseases online. Consisting of data provided by the authors to benefit the reader, the posted materials are not copyedited and are the sole responsibility of the authors, so questions or comments should be addressed to the corresponding author.
Disclaimer. The findings and conclusions in this report are those of the authors and do not necessarily represent the official position of the Centers for Disease Control and Prevention.
Potential conflicts of interest. All authors: No reported conflicts of interest. All authors have submitted the ICMJE Form for Disclosure of Potential Conflicts of Interest. Conflicts that the editors consider relevant to the content of the manuscript have been disclosed.

