


Abstract
Methicillin-resistant Staphylococcus aureus (MRSA) and Clostridium difficile infections declined across the UK National Health Service in the decade that followed implementation of an infection control campaign. The national impact on intensive care unit (ICU)-acquired infections has not been documented.
Data on MRSA, C. difficile, vancomycin-resistant Enterococcus (VRE), and ICU–acquired bloodstream infections (UABSIs) for 1 189 142 patients from 2007 to 2016 were analyzed. Initial coverage was 139 ICUs increasing to 276 ICUs, representing 100% of general adult UK ICUs.
ICU MRSA and C. difficile acquisitions per 1000 patients decreased between 2007 and 2016 (MRSA acquisitions, 25.4 to 4.1; and C. difficile acquisitions, 11.1 to 3.5), whereas VRE acquisitions increased from 1.5 to 5.9. There were 13 114 UABSIs in 1.8% of patients who stayed longer than 48 hours on ICU. UABSIs fell from 7.3 (95% confidence interval [CI], 6.9–7.6) to 1.6 (95% CI, 1.5–1.7)/1000 bed days. Adjusting for patient factors, the incidence rate ratio was 0.21 (95% CI, 0.19–0.23, P < .001) from 2007 to 2016. The greatest reduction, comparing rates in 2007/08 and 2015/16, was for MRSA (97%), followed by P. aeruginosa (81%), S. aureus (79%) and Candida spp (72%), with lower reductions for the coliforms (E. coli 57% and Klebsiella 49%).
Large decreases in ICU-acquired infections occurred across the UK ICU network linked with the first few years of a national infection control campaign, but rates have since been static. Further reductions will likely require a new intervention framework.
()
Many countries and healthcare systems began implementing comprehensive multicomponent infection control surveillance and intervention campaigns in the mid-2000s [1, 2]. Campaigns included vertical measures that targeted specific organisms (eg, methicillin-resistant Staphylococcus aureus [MRSA] and Clostridium difficile) and device-related healthcare-associated infections due to vascular and urinary catheters and intubation, in addition to general (horizontal) measures such as increasing hand hygiene compliance and hospital cleaning. In England, the main components were in place by 2006, with mandatory reporting of specific organisms (MRSA bloodstream infections 2001, C. difficile 2004), national campaigns (Cleanyourhands 2004, Saving Lives 2005), evidence-based guidelines (epic1 2001, Winning Ways 2003), and acts of Parliament (the Health Act 2004, Health and Social Care Act 2008) (Figure 1) [3, 4]. Similar initiatives took place in Wales, Northern Ireland, and Scotland over the same time frame and were similar to programs introduced in the United States, Europe, Asia, South America, and Africa [5–7]. IPC surveillance and interventions are generally applied across the entire hospital, often with particular focus on high-risk areas such as intensive care units (ICUs) that have higher rates of device use and nosocomial infections [8].
![Secular trends in hospital-wide infections reported for the English hospital mandatory reported scheme with reference to publication of infection control guidelines, policies, and laws. National mandatory quarterly counts of all reported cases of methicillin-resistant Staphylococcus aureus bloodstream infections (BSIs) (quarter [Q] 2 2001 to Q1 2016), stool toxin positive Clostridium difficile infections in patients aged age >65 years (from Q4 2003) then extending to age >2 years (Q1 2007 to Q1 2016), vancomycin-resistant Enterococcus BSIs (Q4 2003 to Q1 2013), Escherichia coli BSIs (Q3 2011 to Q1 2016), and methicillin-susceptible Staphylococcus aureus BSIs (Q4 2010 to Q1 2016) [38]. Abbreviations: BSI, bloodstream infection; C. difficile, Clostridium difficile; E. coli, Escherichia coli; HCAI, healthcare-associated infection; MRSA, methicillin-resistant Staphylococcus aureus; MSSA, methicillin-susceptible Staphylococcus aureus; VRE, vancomycin-resistant Enterococcus.](https://oup.silverchair-cdn.com/oup/backfile/Content_public/Journal/cid/70/12/10.1093_cid_ciz720/1/m_ciz720f0001.jpeg?Expires=1749833001&Signature=Pv5Sb1F1uoMPhHLPSdTMXTq9KAhLEErzuWR5Zt5OBpG8xdU2cAglQ-S9lOdLfGciPDQUf12v4fKFgQD4xybrhXLm1UgHA7PMJb4ZIrawAZxU-w-Dt8xJZcB4Fx26PSiex2LGQpSu6gkY9RHVSHH05xRfLiTg8104GYrdX2eZazH~FQ6wuQIdl34KeInp8tBtVmlY5BhY9LIuNU0foibkJYq9i2O17yCEjDsjJacsGb6S7mn2qamvRTyW24WN0qbriZO-1K8GEsh5dFGHjgzm8tkHJ-33-JYCsnJzFOrgL7HieIeGelNnSb43DE9B-bDao2JvghLPDbcIy4bG4Qwklg__&Key-Pair-Id=APKAIE5G5CRDK6RD3PGA)
Secular trends in hospital-wide infections reported for the English hospital mandatory reported scheme with reference to publication of infection control guidelines, policies, and laws. National mandatory quarterly counts of all reported cases of methicillin-resistant Staphylococcus aureus bloodstream infections (BSIs) (quarter [Q] 2 2001 to Q1 2016), stool toxin positive Clostridium difficile infections in patients aged age >65 years (from Q4 2003) then extending to age >2 years (Q1 2007 to Q1 2016), vancomycin-resistant Enterococcus BSIs (Q4 2003 to Q1 2013), Escherichia coli BSIs (Q3 2011 to Q1 2016), and methicillin-susceptible Staphylococcus aureus BSIs (Q4 2010 to Q1 2016) [38]. Abbreviations: BSI, bloodstream infection; C. difficile, Clostridium difficile; E. coli, Escherichia coli; HCAI, healthcare-associated infection; MRSA, methicillin-resistant Staphylococcus aureus; MSSA, methicillin-susceptible Staphylococcus aureus; VRE, vancomycin-resistant Enterococcus.
In 2007, we began prospective collection of an infection dataset from all patients admitted to ICUs that participated in the Intensive Care National Audit & Research Centre (ICNARC) Case Mix Programme (CMP), which is the national clinical audit of adult critical care in England, Wales, and Northern Ireland [9]. The year 2007 also saw the first drop in UK mandatory-collected MRSA bloodstream infection (BSI) rates and C. difficile infection rates started to fall the following year (Figure 1) [10, 11].
There were 139 ICUs at the start of data collection, increasing to 100% of general ICUs and the vast majority of specialist ICUs (n = 276), thus becoming a near complete national ICU-population dataset. The objective was to assess the impact of the emerging IPC intervention program on ICU-acquired infections. MRSA, C. difficile, and vancomycin-resistant Enterococcus (VRE) data were collected as comparators with hospital-wide nationally mandated IPC organisms. ICU-acquired bloodstream infection (UABSI) data were used as performance indicators for the whole IPC framework and a measure of the overall burden of serious life-threatening, potentially preventable nosocomial infections. These data provide an unprecedented insight into the impact of an IPC program on incidence and etiology of ICU-acquired infections across a national healthcare system.
METHODS
Data Selection
Data were collected for all adult patients admitted to ICUs participating in the ICNARC CMP between 1 April 2007 and 31 March 2016. The infection data collection templates are presented in Supplementary Table 1A–1F. All recorded data were analysed for this study except for data for new antibiotics that were started 48 hours after admission to the ICU. The CMP database contains pooled case-mix and outcome data on consecutive admissions collected by trained data collectors and undergo extensive local and central validation before pooling. Details of the approach to data collection and validation in the CMP have been reported elsewhere and independently assessed as being of high quality [9, 12]. The CMP has approval under Section 251 of the National Health Service Act 2006 to process patient identifiable data without consent.
Colonization and Infection Definitions
Patients admitted with MRSA, VRE, or C. difficile infections were defined as those with the organism identified in any sample (for C. difficile infections, detection of toxin in a diarrheal stool sample) taken after hospital admission and either prior to ICU admission or <48 hours following ICU admission (for C. difficile infections, >48 hours if diarrhea was present on admission).
Patients who acquired MRSA, VRE, or C. difficile infections on the ICU were defined as those not known to be colonized or infected on ICU admission and with the organism identified in any sample (for C. difficile infection, any diarrheal stool sample) taken on the ICU >48 hours after ICU admission (for C. difficile infection, with diarrhea not present on admission).
The culture of organisms from a blood sample taken on the ICU >48 hours after admission was deemed to be significant and called a unit-acquired bloodstream infection. We excluded bacteria for which it is usually not possible to confidently ascribe clinical significance due to frequent contamination (eg, coagulase-negative staphylococci, corynebacteria, and propionibacteria; see Supplementary Table 2A). For each admission, the number of UABSI episodes (different organism cultured on a different day) and the top organism from a prioritization list (see Supplementary Table 2B) causing the first UABSI were recorded.
Contextual Data
MRSA, C. difficile, and VRE infection rates were compared with hospital-wide contextual data collected through national surveillance and mandatory reporting. From May 2006 to April 2009, national guidance in England recommended targeted admission MRSA screening in high-risk areas including ICUs [13]. Mandatory screening of all elective and emergency hospital admissions was introduced in England in April 2009 and December 2010, respectively [14]. Mandatory C. difficile infection screening was implemented for people aged >65 years in January 2004 and extended to everyone aged >2 years in April 2007 [15]. Mandatory reporting of VRE bacteremia was introduced in England in September 2003 but became voluntary in April 2013 [16]. Escherichia coli bacteremia mandatory surveillance was introduced in June 2011 following year-on-year increases identified in the voluntary surveillance program [17].
National data on MRSA, C. difficile, and E. coli surveillance were obtained from the Public Health England Data Capture System [10]. Historical national data on mandatory surveillance of VRE was accessed through the UK National Archives [16].
Statistical Analyses
Baseline characteristics and unadjusted outcomes for patients were tabulated using standard summary statistics. Continuous variables were summarized as mean (standard deviation) and median (interquartile range [IQR]), and categorical variables were summarized as number (percent). Trends in the proportions of admissions and acquisitions of MRSA, C. difficile, and VRE were presented by financial year (April–March). Logistic and polynomial regression with analysis of variance was used to model the time series data. A mixed-effects Poisson regression model on patients staying longer than 48 hours was developed to examine the association between important prespecified risk factors included as linear variables and rates of UABSIs. Statistical analyses were performed using Stata (version 13, StataCorp LP, College Station, TX). P values < .05 were considered significant.
RESULTS
Characteristics of Patients and the ICUs
A complete infection dataset was available for 1 189 142 consecutive patients admitted to 276 ICUs between 1 April 2007 and 31 March 2016 in England, Wales, and Northern Ireland; ICUs joined the program at different times over the 9 years. Patient characteristics are presented in Table 1, with a breakdown by type of unit specialty in Supplementary Table 3. Median age was 64 years (IQR, 49–75), 56% were male, the median length of stay (LOS) was 2.1 days (IQR 1.0–4.9), and ICU mortality was 14.2%. A total of 617 366 patients stayed longer than 48 hours on the ICU with a median LOS of 4.8 days (IQR, 3.0–8.8). After excluding the first 48 hours, these patients were at risk for an ICU-acquired infection for a median of 2.8 days (IQR, 1.0–6.8). The number of ICUs that contributed patient data increased from 139 in 2007 to 276 in 2016. Results from analysis of the whole dataset are presented in the Tables 1-3 and Figures 1-4. A sensitivity analysis restricted to 88 ICUs that contributed data continuously (as defined by 100% of the 134 CMP data fields completed and verified for the entire study period) was also undertaken and was consistent with results from the primary analysis (data not shown).
Characteristics and Outcomes of Patients Admitted to Participating Intensive Care Units between 1 April 2007 and 31 March 2016
| Characteristic | Value | |
|---|---|---|
| Total number of patients | 1 189 142 | |
| Age, y | ||
| Mean (SD) | 60.9 | (18.1) |
| Median (IQR) | 64 | (49–75) |
| Age group, n (%), y | ||
| 0–45 | 239 941 | (20.2) |
| 46–59 | 235 635 | (19.8) |
| 60–74 | 404 909 | (34.1) |
| ≥75 | 308 652 | (26.0) |
| Sex, n (%) | ||
| Female | 522 597 | (43.9) |
| Male | 666 542 | (56.1) |
| Immunosuppression, n (%) | ||
| Due to treatments | 75 568 | (6.3) |
| Due to illness | 59 651 | (5.0) |
| Reason for admission, n (%) | ||
| Cardiovascular (nonsurgical) | 110 440 | (9.3) |
| Cardiovascular (surgical) | 103 278 | (8.7) |
| Dermatological (nonsurgical) | 5 895 | (0.5) |
| Dermatological (surgical) | 6 177 | (0.5) |
| Endocrine, metabolic, thermoregulation, or poisoning (nonsurgical) | 69 418 | (5.8) |
| Endocrine, metabolic, thermoregulation, or poisoning (surgical) | 13 374 | (1.1) |
| Gastrointestinal (nonsurgical) | 75 185 | (6.3) |
| Gastrointestinal (surgical) | 227 384 | (19.1) |
| Genitourinary (nonsurgical) | 64 691 | (5.4) |
| Genitourinary (surgical) | 46 139 | (3.9) |
| Hematological/immunological (nonsurgical) | 12 152 | (1.0) |
| Hematological/immunological (surgical) | 763 | (0.1) |
| Musculoskeletal (nonsurgical) | 13 553 | (1.1) |
| Musculoskeletal (surgical) | 41 524 | (3.5) |
| Neurological (nonsurgical) | 103 607 | (8.7) |
| Neurological (surgical) | 54 115 | (4.6) |
| Respiratory (nonsurgical) | 213 785 | (18.0) |
| Respiratory (surgical) | 27 602 | (2.3) |
| Intensive Care National Audit & Research Centre Physiology Score | ||
| Mean (SD) | 16.5 | (9.3) |
| Median (IQR) | 15 | (10–22) |
| ICU length of stay, days | ||
| Mean (SD) | 4.7 | (8.3) |
| Median (IQR) | 2.1 | (1.0–4.9) |
| ICU outcome, n (%) | ||
| Survived | 1 020 290 | (85.8) |
| Died | 168 850 | (14.2) |
Abbreviations: ICU, intensive care unit; IQR, interquartile range; n, number of patients; SD, standard deviation.
Trends in Admission and Acquisition of Infection Control–Specific Organisms on the ICU
The proportion of patients admitted with and acquiring MRSA decreased over the 9 years (38.8 to 13.1/1000 admissions and 25.4 to 4.1/1000 admissions staying longer than 48 hours, respectively) predominantly during the first 5 years with comparable reducing trend lines (Figure 2A). The percentage of patients who had any sample sent to the microbiology laboratory for MRSA detection before or during their ICU stay increased from 92.5% to 96.7% between 2007 and 2016.
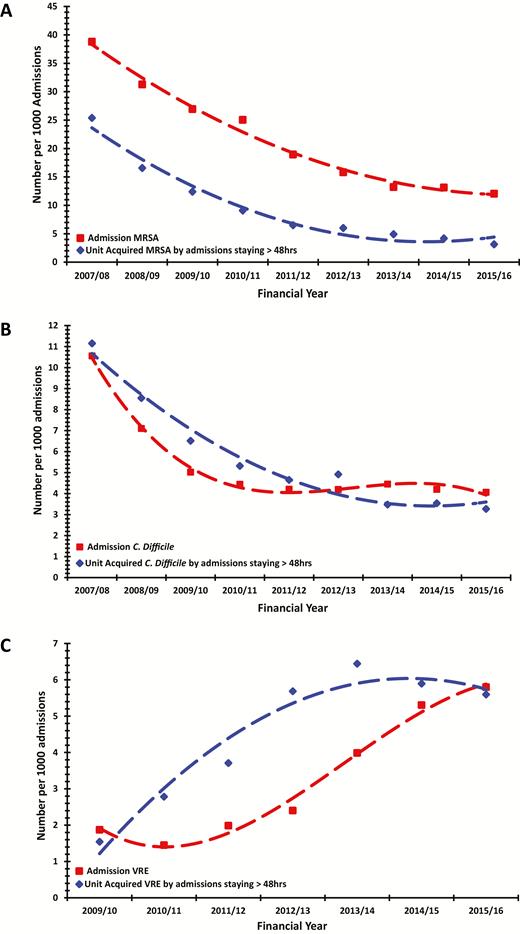
Secular trends in proportion of patients admitted with and acquiring (A) methicillin-resistant Staphylococcus aureus (MRSA), (B) Clostridium difficile (C. difficile), and (C) vancomycin-resistant Enterococcus (VRE) across all intensive care units (ICUs). ICU acquisitions are presented as number per 1000 patients staying longer than 48 hours. Trend reductions in the number of patients admitted with and acquiring MRSA on the ICU were statistically significant (r2 = 0.98, P < .0001 and r2 = 0.99, P < .0001, respectively). Trend reductions in the number of patients diagnosed with C. difficile infection before ICU admission or during the first 48 hours on the ICU and after the first 48 hours on the ICU were statistically significant (r2 = 0.99, P = .0002 and r2 = 0.97, P = .0002, respectively). Trend increase in the number of patients diagnosed with VRE infection before ICU admission and acquiring VRE after the first 48 hours on the ICU were statistically significant (r2 = 0.93, P = .0017 and r2 = 0.93, P = .003). Abbreviations: C. difficile, Clostridium difficile; MRSA, methicillin-resistant Staphylococcus aureus; VRE, vancomycin-resistant Enterococcus.
The proportion of patients who developed C. difficile infection diagnosed by toxin testing either prior to ICU admission or during their ICU stay also decreased over the 9 years. Again, this predominantly occurred during the first 4 years and with overlapping reducing trend lines (10.6 to 4.2/1000 admissions and 11.1 to 3.3/1000 admissions, respectively; Figure 2B), although there was a notable 29% drop in ICU-acquired C. difficile infection diagnosed by toxin testing between 2012 and 2013 (4.9 vs 3.5/1000 admissions), coinciding with release of updated guidance on C. difficile testing [15]. The percentage of patients having C. difficile toxin detection during their hospital stay reduced by almost half between 2007 and 2016 (44.9% to 23.8%).
There was an approximately 3-fold increase in the proportion of patients admitted with and acquiring VRE on the ICU (1.9 to 5.3/1000 admissions and 1.5 to 5.9, respectively), although there was a small decrease in acquisitions in the final 2 years (Figure 2C).
UABSIs
There were 13 114 UABSI episodes in 11 042 of 617 366 (1.8%) patients who stayed longer than 48 hours on the ICU. The UABSI rate fell consistently throughout the study from 7.3 (95% confidence interval [CI], 6.9–7.6)/1000 bed days to 1.6 (95% CI, 1.5–1.7)/1000 bed days (Figure 3A). UABSI rates fell in all 12 regions (10 strategic health authorities in England plus Northern Ireland and Wales), but there remained about a 6-fold variation in UABSI rates between regions (Figure 3A).
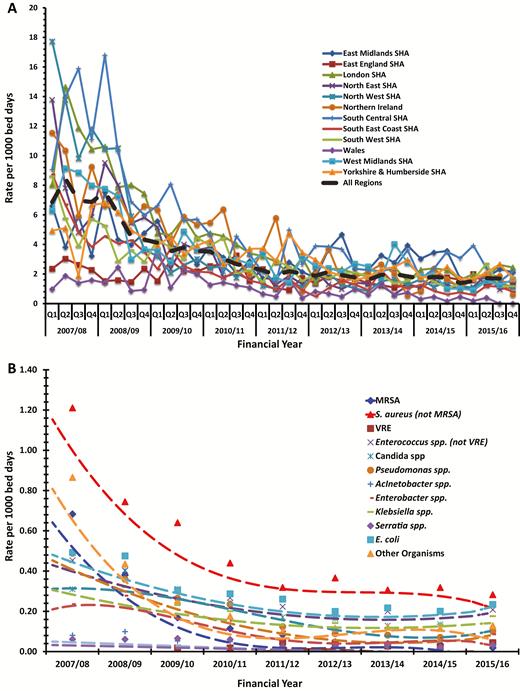
(A) Intensive care unit (ICU)–acquired bloodstream infection rates by geographical region. (B) Main organisms causing first ICU-acquired bloodstream infection. A list of invalid organisms can be found in Supplementary Table 2A and a list of valid “other” organisms can be found in Supplementary Table 2B. The trend reductions in individual organisms and other organisms were all significant (P < .01) apart from vancomycin-resistant Enterococcus (P = .56). Abbreviations: E. coli, Escherichia coli; MRSA, methicillin-resistant Staphylococcus aureus; S. aureus, Staphylococcus aureus; SHA, Strategic Health Authority; VRE, vancomycin-resistant Enterococcus.
Poisson regression modeling on patients who stayed longer than 48 hours and adjusted for age, sex, immunosuppression, reason for and severity of illness on admission, ICU size, and geographical location showed a reduction in the UABSI rate of 79% over time (incidence rate ratio [IRR] for 2015/2016 vs 2007/2008 0.21 [95% CI, 0.19–0.23] with a crude RR of 0.24 [0.22–0.26]; both P < .001; Table 2). The reduction took place during the first 5 years (Table 2), temporally associated with a greater trend reduction in ICU mortality compared with the subsequent 4 years (Table 2 and Figure 4). The model was also tested for robustness in a sensitivity analysis that removed the first 48 hours of ICU exposure in these patients. The results were consistent with the primary analysis (Supplementary Table 4).
Poisson Mixed Effects Model for Intensive Care Unit–Acquired Bloodstream Infection
| Variable | Incidence Rate Ratio (95% Confidence Interval) | P Value |
|---|---|---|
| Patient-level characteristics | ||
| Age (per 10 years) | 0.95 (.94, .96) | <.001 |
| Sex | … | <.001 |
| Male | 1.00 | … |
| Female | 0.89 (.86, .92) | … |
| Immunosuppression due to treatment | … | <.001 |
| No | 1.00 | … |
| Yes | 1.18 (1.10, 1.27) | … |
| Immunosuppression due to illness | … | .001 |
| No | 1.00 | … |
| Yes | 1.15 (1.06, 1.25) | … |
| Oncology reason for admission | … | <.001 |
| Nononcology | 1.00 | … |
| Tumor or malignancy | 0.81 (.74, .89) | … |
| Reason for admission | … | <.001 |
| Respiratory | 1.00 | … |
| Cardiovascular | 1.22 (1.14, 1.30) | … |
| Cardiovascular surgical | 1.19 (1.09, 1.30) | … |
| Dermatological | 2.39 (2.08, 2.75) | … |
| Dermatological surgical | 1.34 (1.05, 1.71) | … |
| Endocrine, metabolic, thermoregulation | 0.95 (.85, 1.05) | … |
| Endocrine, metabolic, thermoregulation surgical | 0.89 (.57, 1.41) | … |
| Gastrointestinal | 1.63 (1.53, 1.73) | … |
| Gastrointestinal surgical | 1.32 (1.25, 1.41) | … |
| Genitourinary | 1.26 (1.17, 1.37) | … |
| Genitourinary surgical | 0.99 (.82, 1.19) | … |
| Hematological/immunological | 1.66 (1.45, 1.89) | … |
| Hematological/immunological surgical | 1.10 (.49, 2.45) | … |
| Musculoskeletal | 1.31 (1.15, 1.50) | … |
| Musculoskeletal surgical | 1.04 (.88, 1.23) | … |
| Neurological (including eyes) | 1.09 (1.01, 1.17) | … |
| Neurological (including eyes) surgical | 1.05 (.94, 1.17) | … |
| Respiratory surgical | 0.98 (.83, 1.15) | … |
| Intensive Care National Audit & Research Centre Physiology Score (per point) | 1.03 (1.03, 1.03) | <.001 |
| Financial year of admission | … | <.001 |
| 2007–2008 | 1.00 | … |
| 2008–2009 | 0.74 (.69, .79) | … |
| 2009–2010 | 0.53 (.50, .57) | … |
| 2010–2011 | 0.41 (.38, .44) | … |
| 2011–2012 | 0.29 (.27, .32) | … |
| 2012–2013 | 0.25 (.23, .27) | … |
| 2013–2014 | 0.24 (.22, .26) | … |
| 2014–2015 | 0.21 (.20, .23) | … |
| 2015–2016 | 0.21 (.19, .23) | … |
| ICU-level characteristics | ||
| Number of ICU beds (per additional bed) | 1.02 (1.01, 1.02) | <.001 |
| SHA/country | … | <.001 |
| East Midlands | 1.00 | … |
| East of England | 0.48 (.38, .60) | … |
| London | 1.02 (.84, 1.25) | … |
| North East | 0.64 (.49, .82) | … |
| North West | 0.64 (.52, .80) | … |
| South Central SHA | 1.37 (1.07, 1.77) | … |
| South East Coast | 0.51 (.40, .65) | … |
| South West | 0.51 (.40, .64) | … |
| West Midlands | 0.49 (.38, .61) | … |
| Yorkshire and the Humber | 0.83 (.67, 1.04) | … |
| Northern Ireland | 0.55 (.41, .72) | … |
| Wales | 0.46 (.34, .62) | … |
Data from 617 336 patients staying longer than 48 hours on the ICU.
Abbreviations: ICU, intensive care unit; SHA, Strategic Health Authority.
![Annual trend change in admission Intensive Care National Audit & Research Centre (ICNARC) physiology score, intensive care unit mortality, and ICU–acquired bloodstream infection rate. ICNARC physiology score is a prognostic score recorded on the day of admission [40]. Abbreviations: ICNARC, Intensive Care National Audit & Research Centre; ICU, intensive care unit; UABSI, ICU–acquired bloodstream infection.](https://oup.silverchair-cdn.com/oup/backfile/Content_public/Journal/cid/70/12/10.1093_cid_ciz720/1/m_ciz720f0004.jpeg?Expires=1749833001&Signature=kmtWSNmMLDDm9taL1JLm26CU6MV2LwUObgzHXctFWyTG9LDzUHywjWZmbgBOGjDNsa~xAnWlcu2Ohlhszcgvql3KsJq55-7i8Ri7wHS7JuL2EPyKeVnl5jhUQwW9zf3mLOsqlVi3Q4iyd7-T-HXtHfbI1IH3hw76SKxPZ~XBg2neBWxW7rL82K2gbBevqah9x69q-8KF0Lh2gIWA7nBxY8AKJxCAngk4ed-5AWdFMXdpYWgQTjuON4aig6-X1YDth4JYIxi~yNodeLVhjt9oGSBjdVUW7MKsO4yFalzOeOh9P4fHCu~fhRffXkeYpq9I4D47IwcZbgm8Ebynt5kcZg__&Key-Pair-Id=APKAIE5G5CRDK6RD3PGA)
Annual trend change in admission Intensive Care National Audit & Research Centre (ICNARC) physiology score, intensive care unit mortality, and ICU–acquired bloodstream infection rate. ICNARC physiology score is a prognostic score recorded on the day of admission [40]. Abbreviations: ICNARC, Intensive Care National Audit & Research Centre; ICU, intensive care unit; UABSI, ICU–acquired bloodstream infection.
Trends in Organisms that Cause UABSIs
The organisms prioritized for recording that caused the first UABSI are presented in Table 3. Six organisms accounted for 73% of the first UABSIs across all years (S. aureus [not including MRSA], E. coli, Enterococci [not including VRE], Candida spp., Klebsiella sp., and Pseudomonas aeruginosa). The UABSI rate decreased for all individually identified organisms and for all valid “other organisms” grouped together. One notable exception was VRE UABSIs that increased, although numbers were comparatively small. Comparing rates in 2007/2008 and 2015/2016, the greatest reduction was for MRSA (97%) followed by P. aeruginosa (81%), S. aureus (79%), and Candida spp. (72%), with lower reductions for the coliforms (E. coli, 57% and Klebsiella, 49%). The “other” valid organism group fell by 86% (Figure 3B). The E. coli UABSI rate is shown in Figure 5, with mandatory collected national data on hospital and community-wide E. coli BSI data showing identical static UABSI and hospital BSI rates but increasing community E. coli BSI rates [10].
Number of Main Organisms Causing First Intensive Care Unit–Acquired Bloodstream Infection by Year
| Organism (n) | 2007–2008 | 2008–2009 | 2009–2010 | 2010–2011 | 2011–2012 | 2012–2013 | 2013–2014 | 2014–2015 | 2015–2016 |
|---|---|---|---|---|---|---|---|---|---|
| MRSA | 160 | 151 | 83 | 63 | 54 | 33 | 27 | 31 | 15 |
| Staphylococcus aureus (not MRSA) | 312 | 313 | 321 | 260 | 205 | 249 | 220 | 268 | 221 |
| VRE | … | … | 9 | 11 | 31 | 29 | 20 | 19 | 35 |
| Enterococcus spp. (not VRE) | 117 | 169 | 154 | 158 | 144 | 134 | 144 | 162 | 163 |
| Candida spp. | 80 | 170 | 156 | 144 | 110 | 112 | 93 | 114 | 74 |
| Pseudomonas spp.a | 126 | 151 | 133 | 139 | 80 | 61 | 59 | 60 | 80 |
| Acinetobacter spp. | 21 | 42 | 27 | 30 | 19 | 19 | 16 | 9 | 22 |
| Enterobacter spp. | 61 | 117 | 104 | 91 | 65 | 60 | 58 | 59 | 68 |
| Klebsiella spp. | 81 | 135 | 116 | 119 | 102 | 97 | 125 | 114 | 138 |
| Serratia spp. | 16 | 26 | 33 | 36 | 16 | 18 | 24 | 19 | 26 |
| Escherichia coli | 127 | 200 | 153 | 170 | 168 | 136 | 156 | 169 | 183 |
| Other organismsb | 223 | 183 | 127 | 104 | 64 | 79 | 87 | 97 | 101 |
| Total | 1324 | 1657 | 1416 | 1325 | 1058 | 1027 | 1029 | 1121 | 1126 |
Abbreviations: MRSA, methicillin-resistant Staphylococcus aureus; spp., species; VRE, vancomycin-resistant Enterococcus.
aUnits were not asked to distinguish Pseudomonas aeruginosa from Pseudomonas spp. The order of organism in this table (identical to the order in Supplementary Table 1) is the order units were asked to prioritize the recording of main organisms in the first intensive care unit–acquired bloodstream infection. Hence, for polymicrobial bloodstream infections, only the organism highest up in the table was recorded.
bOther organisms are listed in Supplementary Table 2B.
![Secular trends in Escherichia coli (E. coli) intensive care unit–acquired bloodstream infection (UABSI) rate in this study compared with published English national hospital and community E. coli UABSI rates. Vertical dashed line indicates change from voluntary to mandatory reporting to Public Health England of all E. coli BSIs identified in microbiology laboratories serving all English National Health Service Hospitals. Nationally reported data available from Public Health England Healthcare Associated Infection Data Capture System [10]. Abbreviations: BSI, bloodstream infection; E. coli, Escherichia coli; ICU, intensive care unit.](https://oup.silverchair-cdn.com/oup/backfile/Content_public/Journal/cid/70/12/10.1093_cid_ciz720/1/m_ciz720f0005.jpeg?Expires=1749833001&Signature=URnxUNTMlLP1Te9j4b~o2Yv~xm8jA1V-eDclPE9s7lWVtBdiEGf294GPjLepn1gI9IuwK2xDH31hYpXOIJUtU~L3Urz6eLdqSmBPv9NevZxiFGkBb1qdJPmTd~kwa2felNp~A11lb7CU0L0vMcUMn4ZT0~ndC6eiJZuL-I6k-hisly4MIc8P-w87SY9858Aoz4VugaFvyPavWH8ykFQmcXDGvpTjFPCP0zPYlBjpX-Wdmpu8i3KLr~q-~bcBSS-RS1ud1txQVUM16wF83QG62XbGIpVJX8790GvNpifHz2PltcBi8pFUEcvmyQi~PDy-z9VeuzbsE08ZSHUAOi51SA__&Key-Pair-Id=APKAIE5G5CRDK6RD3PGA)
Secular trends in Escherichia coli (E. coli) intensive care unit–acquired bloodstream infection (UABSI) rate in this study compared with published English national hospital and community E. coli UABSI rates. Vertical dashed line indicates change from voluntary to mandatory reporting to Public Health England of all E. coli BSIs identified in microbiology laboratories serving all English National Health Service Hospitals. Nationally reported data available from Public Health England Healthcare Associated Infection Data Capture System [10]. Abbreviations: BSI, bloodstream infection; E. coli, Escherichia coli; ICU, intensive care unit.
DISCUSSION
There is increasing evidence that national or organizational multicomponent infection control programs introduced in the mid-2000s reduced infection due to specific organisms of infection control significance (eg, MRSA and C. difficile), including in the United Kingdom [11, 18–23]. Evidence for the extent of these reductions is best provided by population-level data provided through schemes such as mandatory MRSA, C. difficile, and more recently E. coli reporting across the UK healthcare system. This enables healthcare-wide comparison of infection control performance and provides strong data to track responses to interventions and guide future infection control strategies.
It is also thought that national campaigns led to reductions in nosocomial infections at particular sites (eg, urinary and respiratory tract or surgical). However, this is largely based on retrospective studies restricted to groups of hospitals and therefore cannot easily be extrapolated across the healthcare system to determine impact [5]. The unique aspect of this study is that it provides prospective nationwide data collected through voluntary audit. This is achieved by demonstrating to each ICU the benefit of participation for local audit and comparative performance over time, rather than by imposing a mandatory directive.
The data therefore provide strong evidence for a large (about 80%) system-wide reduction in UABSIs in all geographical regions. The data also show parallel reductions in MRSA acquisition and C. difficile infection consistent with data collected from across each of the hospitals involved in this study. UABSI reductions were seen for essentially all organisms (except VRE), although the percentage varied, with the lowest being for Enterobacteriaceae (40%–50%). Lower reductions in E. coli and Klebsiella spp. BSIs compared with Pseudomonas spp. following infection control interventions have been reported in a large surveillance scheme [24].
One cannot determine the relative impact of individual interventions since many were recommended together (2001 and 2006) and likely implemented at various times and presumably at varying levels in each ICU. UABSIs have a variety of causes, in particular, vascular catheters, but they are also secondary to nosocomial skin and soft tissue, urinary, respiratory, and gastrointestinal tract infections; the proportions due to each infected focus are hard to confidently determine. Catheter-related BSIs were targeted by national and international campaigns that commenced around 2002 and ventilator-associated pneumonia (VAP) care bundles around 2005. There was widespread introduction of universal chlorhexidine skin decolonization in UK ICUs from 2006 and earlier in some UK units [13, 25–28]. Studies have demonstrated reductions in BSIs with vascular catheter care bundles and universal skin decolonization, but reductions are harder to demonstrate for VAP bundles [29–31]. This large reduction in UABSIs due to all organisms therefore presumably reflects the combined impact of many of these interventions. It also further demonstrates the impact of the cultural shift in infection control across a national healthcare service comprising very different hospital sizes, structures, and patient populations [3, 32].
The clinical and financial impact of reducing BSIs is presumably significant. Catheter-associated BSIs in ICUs have an attributable mortality of 12%–25%, and the attributable mortality for secondary BSIs is probably higher [33]. Furthermore, since bundles often target the underlying focus of infections, with UABSIs occurring in the most severe cases, the impact presumably extends beyond those with a UABSI [5, 33, 34]. A larger trend reduction in ICU mortality was observed between 2007 and 2012 compared with subsequent years, but this cannot be causally linked to infection control interventions.
There are a number of implications of this study for infection control policies and practices. The observation of no further significant reduction in UABSIs during the last 4 years of the study suggests that we may have obtained the maximum achievable benefit from this current infection control framework. There may be benefit in sharing best practices between ICUs with relatively high and low rates, but it seems more likely that new interventions will be required for rates to fall further, assuming we have not reached the plateau in preventable infections. There may also be benefit in further implementation of some aspects of ICU practices within general medical and surgical wards, although these benefits may already have been achieved during the same time period [27, 35, 36].
It was interesting to observe that the comparable MRSA and methicillin-susceptible Staphylococcus aureus (MSSA) UABSIs decreased between 2007 and 2012 despite only MRSA being a focus of intensive targeting. Subsequently, between 2012 and 2016, rates for both MRSA and MSSA remained static. Some previous reports suggested hospital-onset MSSA BSIs did not decrease along with MRSA BSIs between 2007 and 2012, although comprehensive MSSA BSI data were not being collected at that time [37]. Since 2012, we have had complete national hospital-onset MSSA data to compare and, in contrast to the ICU data presented here, data show increasing hospital-onset MSSA BSIs (Figure 1) [38]. Perhaps 1 or more interventions currently targeted only to high-risk areas such as the ICU could be introduced across general wards, such as universal skin antiseptic use that likely prevents progression from colonization to BSI [31], but this is not without risk given evidence for increasing selection for antiseptic resistance [25, 39]. It is also notable that C. difficile toxin testing decreased by almost half between 2007 and 2016 (44.9% to 23.8%). There are many reasons why liquid stool is found in an ICU, including to intentionally promote gastrointestinal motility. Therefore, clinical judgment is needed to determine whether infectious diarrheal disease has occurred, so the reduced testing may by a consequence of the decline in C. difficile infection.
Looking ahead, many countries are keen to build on past infection control successes by setting new targets for other potentially preventable infections. Public Health England set a 50% target reduction in healthcare-associated gram-negative bacterial BSIs by March 2021. For 2017/2018, a 10% target reduction in E. coli BSI across the entire healthcare environment was set as 1 of 5 components of the national quality premium scheme [17]. The observation of static, national hospital-wide and ICU E. coli UABSI rates (Figure 5), but increasing and much higher community rates, supports the community as being the logical main target for the next interventions. It is interesting that since 2012 the national hospital-onset E. coli BSI rates have been the same as the ICU E. coli UABSI rates presented here. This contrasts with the generally held view that infection rates are higher in ICUs compared with general wards. This is the first time such a comparison has been made through population data and might indicate that sustained IPC interventions on the ICU can bring infection rates down to rates seen on general wards.
This study has limitations. Species identification was only recorded for the first UABSI episode (84% of all UABSIs), and data on antimicrobial susceptibilities and focus of infection were not collected. This was decided at inception to make the collection of data from hospital electronic systems at all participating hospitals feasible. We also excluded skin organisms such as coagulase negative staphylococci because they frequently contaminate blood cultures, are of uncertain clinical significance, and would have dominated the dataset. We also had no data on key nosocomial risk factors for UABSIs (catheter insertion, surgery, ventilation) or the timing of infection control interventions on each ICU. It seems unlikely that inaccurate or incomplete data collection, particularly during the first few years, would confound the interpretation, because a microbiologist (J. D. E.) addressed questions from all ICUs throughout the 9 years. Furthermore, the trend was of a decrease, rather than an increase, in ascertainment over time.
In summary, this study provides evidence for a large sustained ICU population–level reduction in all significant ICU-acquired BSIs and, by inference, the underlying causative infection across the UK ICU network predominantly between 2007 and 2012. This ongoing dataset obtained through a voluntary audit scheme can provide early warning of changing epidemiology and inform future infection control priorities, targets, and impact.
Supplementary Data
Supplementary materials are available at Clinical Infectious Diseases online. Consisting of data provided by the authors to benefit the reader, the posted materials are not copyedited and are the sole responsibility of the authors, so questions or comments should be addressed to the corresponding author.
Notes
Author contributions. J. D. E., R. B., J. W., and D. H. conceived and designed the study. J. D. E., R. B., J. W., and D. H. contributed to the analysis of the data while J. W. and D. H. conducted the data modeling. J. D. E. wrote the first draft of the manuscript and all authors contributed to the final version. J. D. E., R. B., J. W., and D. H. had full access to all the data and take responsibility for the data integrity, accuracy of the analysis, and for the decision to submit for publication.
Disclaimer. The funders had no role in study design, data collection and analysis, decision to publish, or preparation of the manuscript.
Financial support. This research was funded/supported by the National Institute for Health Research (NIHR) Biomedical Research Centre based at Guy’s and St Thomas’ National Health Service (NHS) Foundation Trust and King’s College London, the programme of Infection and Immunity (RJ112/N027), and the NIHR Collaboration for Leadership in Applied Health Research and Care South London at King’s College Hospital NHS Foundation Trust, awarded to J. D. E. who is also supported by a charitable donation from the Lower Green Foundation.
Potential conflicts of interest. All authors report no potential conflicts of interest. All authors have submitted the ICMJE Form for Disclosure of Potential Conflicts of Interest. Conflicts that the editors consider relevant to the content of the manuscript have been disclosed.
References
The Health Foundation. Infection prevention and control: lessons from acute care in England, 2015. Available at: https://www.health.org.uk/publications/infection-prevention-and-control-lessons-from-acute-care-in-england. Accessed 02 April 2018.

