


Abstract
Data on noninvasive liver fibrosis staging after viral eradication are unclear. This histology-based study validated the performance of liver stiffness (LS) measurements after viral eradication.
Consecutive participants with chronic hepatitis C (CHC) who received concomitant LS measurements through acoustic radiation force impulse (ARFI) elastography and percutaneous liver biopsy were prospectively screened and analyzed.
Of the 644 patients, 521 (80.9%) underwent a biopsy at treatment baseline, and the remaining 123 (19.1%) underwent a biopsy at 3 years (median; interquartile range, 0.1) after the sustained virological response (SVR) to pegylated interferon–based and direct-acting antiviral treatments. The proportions of histological fibrosis stages did not differ significantly between the pretreatment and post-SVR groups (P = .0615). However, the LS values differed significantly (P < .0001). The median LS values (presented as shear wave velocities in meters per second) were 1.51 (0.92) for the pretreatment group and 1.22 (0.77) for the post-SVR group. The cutoffs (areas under the receiver operating characteristic curve, obtained using the bootstrap method) to dichotomize between METAVIR fibrosis stage F1 versus stages F2–F4, F1–F2 versus F3–F4, and F1–F3 versus F4 were 1.47 (0.8333, 95% confidence interval [CI] 0.7981–0.8663), 1.81 (0.8763, 95% CI 0.8376–0.9107), and 1.86 (0.8811, 95% CI 0.8378–0.9179) in the pretreatment group, respectively, and 1.22 (0.7872, 95% CI 0.7001–0.8624), 1.59 (0.8808, 95% CI 0.8034–0.9422), and 1.75 (0.9018, 95% CI 0.8201–0.9644) in the post-SVR group, respectively.
The performance of LS measurements through ARFI elastography is promising to determine the liver fibrosis stage on necroinflammation-resolved histology in CHC after viral eradication.
Chronic hepatitis C (CHC) treatment is a major healthcare challenge worldwide [1]. However, antiviral treatment can ameliorate or cure CHC, to achieve a resolution in hepatic necroinflammation and a regression in fibrosis, demonstrated chronologically by invasive and noninvasive diagnostic modalities [2–11].
Evaluating or quantifying pretreatment liver fibrosis is fundamental for determining treatment responses, treatment side effects, and liver-related endpoints [9, 12, 13]. Ultrasound-based elastography has evolved to determine liver stiffness (LS), with comparable validity and reliability for evaluating fibrosis at treatment baseline and during follow-ups [14, 15].
Studies on the kinetics of LS values have provided valuable insights into the magnitudes, rates, and correlates of LS changes over time [10, 16]. In groups with a sustained virological response (SVR) to pegylated interferon–based or direct-acting antiviral (DAA)-based therapy, the 2-phased kinetics (mostly declines) in LS can be explained through early, rapid, necroinflammatory resolution, with concurrent slow fibrosis regression. Moreover, both the treatment and the response constitute the critical factors that explain the stiffness declines [13]. Therefore, in the dichotomization of fibrosis stages in post-SVR patients on and off treatments through elastography, the need for lower cutoff values of LS than those at the treatment-naive baseline has been reported [17–19], but not definitely developed or validated based on histology for following up on CHC patients with resolved hepatic necroinflammation.
A liver histological analysis for fibrosis, using either categories [20] or collagen proportionate areas [21], remains the gold standard for assessing the diagnostic performance of LS measurements, and fibrosis stage is a significant covariate for explaining LS values through elastography. However, paired or multiple sessions of histological analyses [2, 18, 22, 23]—with or without concomitant LS measurements demonstrating regression, stasis, and progression in fibrosis stages—have remained rare in large cohorts with CHC, because of increasing patient reluctance to undergo liver biopsies.
This histology-based study aimed to demonstrate the discrepancies in LS and cutoff values; to validate LS measurements and offer post-SVR cutoffs; to estimate the significant and independent covariates that correlated with LS values at the pretreatment, treatment-naive baseline and post-SVR follow-up with resolved hepatic necroinflammation, respectively; and to delineate the significance of paired changes in LS values through elastographies, liver fibrosis stages, necroinflammation grades, and steatosis grades on histology in a subgroup, through paired liver biopsies.
Methods
Participants
Consecutive patients who had received a CHC diagnosis and liver biopsy at China Medical University Hospital from July 2010 to June 2018 were prospectively screened. Written informed consent was obtained from all the participants. The study protocol, including paired liver biopsies and serial LS measurements over time, was approved by the Research Ethics Committee of China Medical University Hospital (CMUH103-REC1-102 and CMUH103-REC1-150) and developed in accordance with the Declaration of Helsinki.
CHC infections were determined through positive results for hepatitis C virus (HCV) antibodies (Abbott Laboratories, Abbott Park, IL) for >6 months with detectable serum HCV RNA (detection limit: 15 IU/mL; COBAS Ampliprep/COBAS TaqMan HCV test, Roche Diagnostics, Branchburg, NJ). Patient exclusion criteria were an age <20 years, decompensated cirrhosis (Child–Turcotte–Pugh score of ≥7), a hepatocellular carcinoma, primary biliary cholangitis, primary sclerosing cholangitis, Wilson disease, autoimmune hepatitis, hemochromatosis, a coinfection with hepatitis B virus or human immunodeficiency virus, extrahepatic cholestasis, alcohol dependence (score ≥2 on the CAGE Questionnaire) [24], a myeloproliferative disorder, thalassemia, cardiac congestion, a blood product transfusion in the preceding 30 days, pregnancy, or a serum creatinine level of >2.5 mg/dL.
Blood Tests
The HCV RNA load, complete blood count (Sysmex Corp., Hyogo, Japan), and blood biochemistry (Beckman Coulter Inc., Brea, CA) were analyzed in the central laboratory of the hospital. The Fibrosis-4 index and the aspartate aminotransferase-to-platelet ratio index were calculated using previously defined formulas [25].
Liver Stiffness Measurement Through Acoustic Radiation Force Impulse Elastography
Participants were scheduled to undergo percutaneous, right-lobe liver biopsies within 1 hour of blood sampling and concomitant LS measurements after 4 hours of fasting, either at the baseline of antiviral treatment or at the follow-up visit after the end of treatment.
Acoustic radiation force impulse (ARFI) elastography was integrated into an ultrasound system (Acuson S2000 with a Siemens 4C1 curvilinear array, 2.67 MHz for push pulses, and 3.08 MHz for detection pulses; Siemens Medical Solutions, Mountain View, CA). LS measurements were obtained using detection pulses and presented as shear wave velocity in meters per second.
A single hepatologist, who was experienced in ARFI elastography and blinded to participants’ data, performed the LS measurements. Measurement results were deemed reliable when the interquartile range was lower than 0.3 of the median of 10 successful LS measurements and the successful LS measurement rate was higher than 60%. All other results were deemed unreliable and excluded [14, 26].
METAVIR Scoring on Histology
Senior hepatologists performed percutaneous, right-lobe liver biopsies using a spring-loaded 18G × 15 cm Temno biopsy needle (Cardinal Health Inc., McGaw Park, IL). A single, experienced pathologist who was blinded to the LS measurement results and participant data analyzed the liver tissues after staining them with Masson’s trichrome staining, hematoxylin and eosin, and reticulin. Biopsy specimens at least 15 mm in length were considered adequate [25]. On the basis of histological examinations, liver fibrosis was staged as F0 (no fibrosis), F1 (portal fibrosis without septa), F2 (portal fibrosis with few septa), F3 (numerous septa without cirrhosis), or F4 (cirrhosis) [27]. Furthermore, necroinflammatory activity was graded as A0 (no activity), A1 (mild), A2 (moderate), or A3 (severe), and steatosis was graded as S0 (no fatty metamorphosis), S1 (mild), S2 (moderate), or S3 (severe) [28].
Antiviral Therapy and Monitoring
Patients received either pegylated interferon–based [29] or DAA-based therapy. The SVR status was defined as undetectable HCV RNA at the end of treatment and at 24 weeks after the end of treatment for both the pegylated interferon– and DAA-based groups. Non-SVR status was defined as any detectable HCV RNA at or after the end of treatment.
Statistical Analyses
Data are presented as either a median value (interquartile range) or number (percentage). Between-group and overall differences were estimated using the Mann-Whitney U test or Kruskal-Wallis test for continuous variables and chi-square test or Fisher’s exact test for proportions between unpaired groups. Changes in paired patient parameters from baseline to the follow-up visit were compared using the Wilcoxon signed-rank test for continuous variables and the McNemar test for proportions. Multiple linear regression models were used to identify the independent factors that explained LS values. A receiver operating characteristic curve analysis was implemented to evaluate and compare [30] the diagnostic performance by using the area under the receiver operating characteristic curve (AUROC; and 95% confidence interval [CI]) to dichotomize the METAVIR fibrosis stages. The optimal cutoff values were identified to maximize the Youden index. Internal validations were performed using the bootstrap method, with 1000 replications to evaluate the AUROCs [31]. Data were analyzed using SAS version 9.3 (SAS Institute, Inc., Cary, NC) and SPSS version 12.0 for Microsoft Windows (SPSS, Inc., Chicago, IL). A 2-sided P value of <.05 indicated statistical significance.
Results
Participant Characteristics
In total, 718 intention-to-treat patients with chronic HCV monoinfections who had each received at least 1 liver biopsy session were screened. The specimens of patients who deferred or discontinued the intended standard-of-care treatment were included in the pretreatment group (Figure 1).
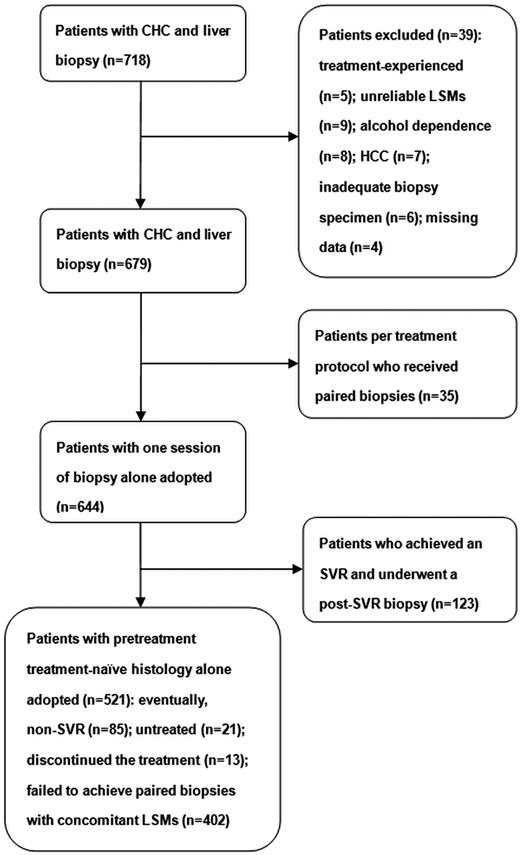
Patient recruitment flow chart. Abbreviations: CHC, chronic hepatitis C; HCC, hepatocellular carcinoma; LSM, liver stiffness measurement; SVR, sustained virological response.
In the final analysis, 679 patients (714 biopsies) were included. Of the patients with unpaired biopsies (n = 644), 314 (48.8%) were men, with a median age of 55 years (interquartile range, 17 years). Of the 644 patients, 521 (80.9%) patients underwent a percutaneous liver biopsy at the pretreatment, treatment-naive baseline (pretreatment group) and the remaining 123 (19.1%) with an SVR underwent a biopsy at a median of 3 years (interquartile range, 0.1) after the SVR to pegylated interferon–based and DAA treatments (post-SVR group; Figure 1). Of these 123 patients with an SVR, 108 (87.8%) and 15 (12.2%) received pegylated interferon– and DAA-based therapies, respectively (Supplementary Table 1). The METAVIR fibrosis stages and Fibrosis-4 index values did not differ significantly between the pretreatment and post-SVR groups. However, the serum levels of aspartate aminotransferase, alanine aminotransferase (ALT), and total bilirubin; METAVIR A grades; aminotransferase-to-platelet ratio indices; and LS values were significantly greater in the pretreatment group than in the post-SVR group (Table 1). Pretreatment (n = 83) and post-SVR (n = 109) subgroups with concurrent ALT levels <40 U/L were compared in Supplementary Table 2.
Patient Characteristics of the Pretreatment (n = 521) and Post–sustained Virological Response (n = 123) Groups
| Variables | Overall | Pretreatment | Post-SVRa | P Value |
|---|---|---|---|---|
| Median (IQR) or n (%) | (N = 644) | (n = 521) | (n = 123) | |
| Age, years | 55 (17) | 54 (18) | 59 (9) | <.0001 |
| Sex | … | … | … | .4257 |
| Female | 330 (51.2) | 263 (50.5) | 67 (54.5) | … |
| Male | 314 (48.8) | 258 (49.5) | 56 (45.5) | … |
| Body mass index, kg/m2 | 24.3 (4.2) | 24.3 (4.3) | 24.6 (3.7) | .2232 |
| METAVIR fibrosis | … | … | … | .0615 |
| F1 | 245 (38) | 195 (37.4) | 50 (40.7) | … |
| F2 | 239 (37.1) | 205 (39.3) | 34 (27.6) | … |
| F3 | 73 (11.3) | 57 (10.9) | 16 (13) | … |
| F4 | 87 (13.5) | 64 (12.3) | 23 (18.7) | … |
| METAVIR activity | … | … | … | <.0001 |
| A0 | 218 (33.9) | 111 (21.3) | 107 (87) | … |
| A1 | 338 (52.5) | 323 (62) | 15 (12.2) | … |
| A2 | 80 (12.4) | 79 (15.2) | 1 (0.8) | … |
| A3 | 8 (1.2) | 8 (1.5) | 0 (0) | … |
| Steatosis gradesb | … | … | … | .6757 |
| S0, S1 | 338 (52.9) | 273 (52.5) | 65 (54.6) | … |
| S2, S3 | 301 (47.1) | 247 (47.5) | 54 (45.4) | … |
| AST, U/L | 46 (47.5) | 53 (51) | 24 (9) | <.0001 |
| ALT, U/L | 61 (69.5) | 73 (68) | 21 (12) | <.0001 |
| ALT, U/L | … | … | … | <.0001 |
| <40 | 192 (29.8) | 83 (15.9) | 109 (88.6) | … |
| ≥40 | 452 (70.2) | 438 (84.1) | 14 (11.4) | … |
| Hemoglobin A1c, % | 5.8 (0.7) | 5.7 (0.8) | 5.8 (0.7) | .0496 |
| Total bilirubin, mg/dL | 0.92 (0.43) | 0.93 (0.41) | 0.85 (0.43) | .1488 |
| PT, INR | 1.03 (0.1) | 1.03 (0.11) | 1.02 (0.08) | .1224 |
| Platelet, ×103/μL | 169 (81) | 168 (85) | 173 (74) | .9249 |
| Creatinine, mg/dL | 0.79 (0.29) | 0.79 (0.3) | 0.79 (0.3) | .7155 |
| APRI | 0.69 (0.95) | 0.83 (1.08) | 0.37 (0.24) | <.0001 |
| FIB-4 | 2.02 (2.03) | 2.10 (2.39) | 1.91 (1.18) | .1199 |
| Liver stiffness, m/s | 1.46 (0.84) | 1.51 (0.92) | 1.22 (0.77) | <.0001 |
| F1 | 1.20 (0.24) | 1.21 (0.24) | 1.10 (0.18) | .0002 |
| F2 | 1.55 (0.66) | 1.60 (0.66) | 1.20 (0.42) | <.0001 |
| F3 | 2.09 (0.82) | 2.28 (0.86) | 1.69 (0.69) | .0011 |
| F4 | 2.49 (1.02) | 2.68 (1.04) | 2.28 (0.68) | .0137 |
Abbreviations: A0–3, necroinflammatory activity grades; ALT, alanine aminotransferase; APRI, AST-to-platelet ratio index; AST, aspartate aminotransferase; F1–F4, fibrosis stages; FIB-4, Fibrosis-4 index; INR, international normalized ratio; IQR, interquartile range; PT, prothrombin time; SVR, sustained virological response.
aThe post-SVR group (n = 123/644, 19.1%) underwent biopsies 3 years (median; IQR = 0.1) after the SVR visit.
bThere were 5 patients with indeterminate steatosis grades.
Only 35 of the 679 patients (5.2%) received paired biopsies at the treatment baseline (pretreatment) and at the follow-up visits (posttreatment). The median age was 57 years (interquartile range, 11 years), and 21 (60%) patients were men. Of the 35 patients with paired biopsies per the CHC treatment protocol, 28 (80%) achieved SVR (Table 2; Supplementary Table 3). The median time interval between the paired biopsies was 4.2 years (interquartile range, 0.8 years).
Pretreatment and Posttreatment Characteristics of Patients With Paired Biopsies (n = 35)
| Variables | Pretreatment | Posttreatmenta | |
|---|---|---|---|
| Median (IQR) or n (%) | (n = 35) | (n = 35) | P Value |
| Age, years | 57 (11) | 61 (12) | … |
| Sex, male | 21 (60) | 21 (60) | … |
| Body mass index | 23.6 (4.1) | 25.0 (3.8) | .8336 |
| METAVIR fibrosis | … | … | <.0001 |
| F1 | 3 (8.6) | 13 (37.1) | … |
| F2 | 18 (51.4) | 8 (22.9) | … |
| F3 | 9 (25.7) | 6 (17.1) | … |
| F4 | 5 (14.3) | 8 (22.9) | … |
| METAVIR activity | … | … | <.0001 |
| A0 | 2 (5.7) | 28 (80) | … |
| A1 | 22 (62.9) | 6 (17.1) | … |
| A2 | 11 (31.4) | 1 (2.9) | … |
| A3 | 0 (0) | 0 (0) | … |
| Steatosis grades | … | … | .1053 |
| S0, S1 | 17 (48.6) | 22 (62.9) | … |
| S2, S3 | 18 (51.4) | 13 (37.1) | … |
| Hemoglobin A1c, % | 5.6 (0.6) | 5.7 (0.5) | .3062 |
| AST, U/L | 73 (52) | 25 (10) | <.0001 |
| ALT, U/L | 90 (97) | 23 (22) | <.0001 |
| Total bilirubin, mg/dL | 1.10 (0.49) | 1.0 (0.3) | .0057 |
| Prothrombin time, INR | 1.05 (0.11) | 1.02 (0.08) | .0082 |
| Platelet, ×103/μL | 133 (69) | 152 (56) | .0090 |
| Creatinine, mg/dL | 0.82 (0.37) | 0.83 (0.43) | .0845 |
| APRI | 1.43 (2.30) | 0.39 (0.33) | <.0001 |
| FIB-4 | 3.72 (3.76) | 2.01 (1.80) | .0002 |
| Liver stiffness, m/s | 1.93 (0.95) | 1.36 (0.55) | <.0001 |
| F1 | 1.37 (0.37) | 1.20 (0.38) | … |
| F2 | 1.79 (1.09) | 1.59 (0.59) | … |
| F3 | 2.21 (0.60) | 1.30 (0.32) | … |
| F4 | 2.57 (0.44) | 1.78 (1.34) | … |
Abbreviations: A0–3, necroinflammatory activity grades; ALT, alanine aminotransferase; APRI, AST-to-platelet ratio index; AST, aspartate aminotransferase; F1–F4, fibrosis stages; FIB-4, Fibrosis-4 index; INR, international normalized ratio; IQR, interquartile range.
aThe median time interval between the paired biopsies was 4.2 years (IQR = 0.8).
Liver Histology
The median length of the included liver biopsy specimens was 21 mm (interquartile range, 1). The proportions of histological fibrosis stages did not differ significantly between the pretreatment and post-SVR groups (P = .0615). By contrast, necroinflammatory degrees differed significantly between these 2 groups (P < .0001). Furthermore, steatosis grades did not differ significantly between these 2 groups (P = .6757; Table 1).
The histological fibrosis stages regressed significantly between the pretreatment baseline and posttreatment follow-up in the 35 patients with paired liver biopsies (P < .0001). The changes in fibrosis stages were stratified as progression (≥1 increase in paired fibrosis stages; n = 6, 17.1%); stasis (n = 17, 48.6%); and regression (≥1 decline in fibrosis stages; n = 12, 34.3%). No baseline features distinguished posttreatment patients with fibrosis progression from those without progression (Supplementary Tables 4 and 5). Furthermore, necroinflammation resolved significantly between the pretreatment baseline and posttreatment follow-up (Table 2; Supplementary Table 3). Steatosis grades did not differ significantly between the pretreatment and posttreatment groups (Table 2; Supplementary Table 3).
Overall, necroinflammatory resolution was marked on the post-SVR liver histology. Of the total 123 biopsies, 107 (86.9%), 15 (12.2%), and 1 (0.8%) exhibited METAVIR A0, A1, and A2 grades, respectively, on the post-SVR liver histology (Table 1). Moreover, 26 (92.9%) and 2 (7.1%) exhibited METAVIR A0 and A1 grades, respectively, on the post-SVR histology for the 28 patients with SVR and paired liver biopsies (Supplementary Table 3).
Liver Stiffness Measurement
The fibrosis stages of the biopsies did not differ significantly between the unpaired, pretreatment, treatment-naive (n = 521) and post-SVR groups (n = 123; P = .0615; Table 1). However, the LS values differed significantly. The median LS values were 1.51 (0.92) and 1.22 (0.77) for the pretreatment and post-SVR groups, respectively (P < .0001; Figure 2). The necroinflammatory grades on histology significantly explained the LS values (Figure 2). The cutoffs (AUROCs using the bootstrap estimates) to dichotomize between F1 versus F2–F4, F1–F2 versus F3–F4, and F1–F3 versus F4 were 1.47 (0.8333, 95% CI 0.7981–0.8663), 1.81 (0.8763, 95% CI 0.8376–0.9107), and 1.86 (0.8811, 95% CI 0.8378–0.9179) in the pretreatment group, respectively, and 1.22 (0.7872, 95% CI 0.7001–0.8624), 1.59 (0.8808, 95% CI 0.8034–0.9422), and 1.75 (0.9018, 95% CI 0.8201–0.9644) in the post-SVR group, respectively (Table 3; Supplementary Tables 6–10).
Diagnostic Performance of Liver Stiffness Values Dichotomizing Fibrosis Stages on Histology
| AUROC | P Valuea | Cutoff | Sensitivity | Specificity | PPV | NPV | Bootstrap AUROC | |
|---|---|---|---|---|---|---|---|---|
| Pretreatment, n = 521 | ||||||||
| F1 vs F2–F4 | 0.8336 (0.7987–0.8685) | … | 1.47 | 83.6% (163/195) | 72.7% (237/326) | 64.7% (163/252) | 88.1% (237/269) | 0.8333 (0.7981–0.8663) |
| F1–F2 vs F3–F4 | 0.8763 (0.8404–0.9123) | … | 1.81 | 86.0% (104/121) | 80.3% (321/400) | 56.8% (104/183) | 95.0% (321/338) | 0.8763 (0.8376–0.9107) |
| F1–F3 vs F4 | 0.8805 (0.8399–0.9210) | … | 1.86 | 90.6% (58/64) | 74.6% (341/457) | 33.3% (58/174) | 98.3% (341/347) | 0.8811 (0.8378–0.9179) |
| Post-SVR, n = 123 | ||||||||
| F1 vs F2–F4 | 0.7873 (0.7081–0.8664) | .2941 | 1.22 | 76.0% (38/50) | 67.1% (49/73) | 61.3% (38/62) | 80.3% (49/61) | 0.7872 (0.7001–0.8624) |
| F1–F2 vs F3–F4 | 0.8788 (0.8077–0.9499) | .9510 | 1.59 | 76.9% (30/39) | 85.7% (72/84) | 71.4% (30/42) | 88.9% (72/81) | 0.8808 (0.8034–0.9422) |
| F1–F3 vs F4 | 0.9024 (0.8292–0.9756) | .6080 | 1.75 | 82.6% (19/23) | 86.0% (86/100) | 57.6% (19/33) | 95.6% (86/90) | 0.9018 (0.8201–0.9644) |
Values in parentheses are either 95% confidence intervals or n/N.
Abbreviations: AUROC, area under the receiver operating characteristic curve; F1–F4, fibrosis stages; NPV, negative predictive value; PPV, positive predictive value; SVR, sustained virological response.
aIndependent comparison of the AUROCs between pretreatment and post-SVR.
![Box plots of liver stiffness values in stratified subgroups of the pretreatment (n = 521) and post-SVR (n = 123) groups. A, The liver stiffness values stratified with METAVIR fibrosis stages were significantly lower (all P values < .05) in the post-SVR group than the pretreatment group. B, The liver stiffness values of the 3 subgroups (A2 and A3 in pretreatment, A0 and A1 in pretreatment, and post-SVR [only 1 patient with A2]; P according to the Kruskal–Wallis test: all P values < .05). C, The liver stiffness values of the 2 subgroups with necroinflammatory resolution (A0 in the pretreatment and A0 in the post-SVR; P value = .753). Abbreviations: A0–3, METAVIR activity grade; SVR, sustained virological response.](https://oup.silverchair-cdn.com/oup/backfile/Content_public/Journal/cid/70/1/10.1093_cid_ciz161/1/m_ciz161f0002.jpeg?Expires=1750330651&Signature=aRAA67FimxtUa4NMENwTk5F~x6AhCNLHoL6XVXD9WjTreHCYvZZ99nbJWR-MCMlDi5VQ~WVUvcuPB5OmgoCUYNa9VQ~nDJSJmwRdlDwcCi2qPR-N48Jio5KfC9hza8Uqa2fe2oJWdqOFhp26GBpU-wu1bWZIKQe3IkKYzaWHYMic69nWs6L~GuVOT-F71XZk2656f4huU-LTMdJHNeWjzoGgloZZRV19h2VzuJ9oVdHahzrPR33aiySvgV0kvTuJJm1HJmG8fndfj0KWu-Oh9txqdECeAUzyKcbz6TLBwczBE8SpCdRyu24KcOicZtWvUrA3qVBR5975bliYT1r5lA__&Key-Pair-Id=APKAIE5G5CRDK6RD3PGA)
Box plots of liver stiffness values in stratified subgroups of the pretreatment (n = 521) and post-SVR (n = 123) groups. A, The liver stiffness values stratified with METAVIR fibrosis stages were significantly lower (all P values < .05) in the post-SVR group than the pretreatment group. B, The liver stiffness values of the 3 subgroups (A2 and A3 in pretreatment, A0 and A1 in pretreatment, and post-SVR [only 1 patient with A2]; P according to the Kruskal–Wallis test: all P values < .05). C, The liver stiffness values of the 2 subgroups with necroinflammatory resolution (A0 in the pretreatment and A0 in the post-SVR; P value = .753). Abbreviations: A0–3, METAVIR activity grade; SVR, sustained virological response.
In the subgroup (n = 35) with paired biopsies, the LS values were available at the defined SVR visits, too. In the subgroup with SVR (n = 28), the median paired concomitant LS values of the fibrosis stages declined significantly in total (2.24 to 1.32, rate = −0.17 m/s/y), for those in stasis (2.32 to 1.46, rate = −0.15 m/s/y), and for those with regression (1.90 to 1.20, rate = −0.21 m/s/y), but not for those in progression (1.78 to 1.15, rate = −0.09 m/s/y; Table 4). The LS values significantly declined from the pretreatment biopsy to the SVR visit and from the SVR visit to the posttreatment biopsy in patients with stasis of the fibrosis stages (Table 4). The LS declines in patients whose necroinflammation on liver biopsy changed from METAVIR A1 to A0 (n = 16) and those whose necroinflammation changed from METAVIR A2 to A0 (n = 10) were not significantly different (0.68 [0.77] versus 0.75 [0.73], respectively; P = .1966). The discordance between histology and elastography to liver fibrosis stage was significantly minimized in the posttreatment group (Figure 3).
Stratified Comparison of Liver Stiffness Changes Pretreatment Versus Posttreatment in Patients With Paired Biopsies (n = 35)
| Sessions | Timeframesa | Rate (m/s/y)b | |||||
|---|---|---|---|---|---|---|---|
| Pre | SVRc | Postd | Δ(Pre–Post) | Δ(Pre–SVR) | Δ(SVR–Post) | ||
| Total, n = 35 | 1.93 | 1.40 | 1.36 | −0.63 (−28%)f | −0.34 (−18%)f | −0.06 (−5%)f | −0.13 |
| Progression, stasis, or regression in METAVIR fibrosis stages | |||||||
| Progression,e n = 6 | 1.71 | 1.42 | 1.40 | −0.22 (−14%) | −0.20 (−11%) | +0.02 (+1%) | −0.05 |
| Stasis, n = 17 | 2.21 | 1.54 | 1.39 | −0.63 (−28%)f | −0.34 (−18%)f | −0.07 (−4%) | −0.13 |
| Regression, n = 12 | 1.79 | 1.30 | 1.20 | −0.77 (−38%)f | −0.40 (−20%)f | −0.07 (−6%) | −0.20 |
| SVR and non-SVR | |||||||
| SVR, n = 28 | 2.24 | 1.43 | 1.32 | −0.66 (−31%)f | −0.38 (−19%)f | −0.07 (−5%)f | −0.17 |
| Progression, n = 3 | 1.78 | 1.44 | 1.15 | −0.41 (−26%) | −0.34 (−19%) | 0 (0%) | −0.09 |
| Stasis, n = 14 | 2.32 | 1.72 | 1.46 | −0.64 (−30%)f | −0.39 (−18%)f | −0.09 (−6%)f | −0.15 |
| Regression, n = 11 | 1.90 | 1.28 | 1.20 | −0.78 (−43%)f | −0.45 (−21%)f | −0.06 (−5%) | −0.21 |
| SVR with ALT normalization, n = 27 | 2.21 | 1.42 | 1.28 | −0.66 (−32%)f | −0.41 (−19%)f | −0.07 (−5%)f | −0.17 |
| Progression, n = 3 | 1.78 | 1.44 | 1.15 | −0.41 (−26%) | −0.34 (−19%) | 0 (0%) | −0.09 |
| Stasis, n = 13 | 2.26 | 1.54 | 1.39 | −0.66 (−31%)f | −0.45 (−18%)f | −0.10 (−9%)f | −0.16 |
| Regression, n = 11 | 1.90 | 1.28 | 1.20 | −0.78 (−43%)f | −0.45 (−21%)f | −0.06 (−5%)f | −0.21 |
| Non-SVR, n = 7 | 1.59 | 1.33 | 1.37 | −0.20 (−10%) | −0.26 (−16%) | 0.07 (5%) | −0.03 |
| Progression, n = 3 | 1.64 | 1.39 | 1.65 | 0.18 (9%) | 0.02 (2%) | 0.10 (5%) | 0.04 |
| Stasis, n = 3 | 1.52 | 1.30 | 1.37 | −0.20 (−10%) | −0.27 (−18%) | 0.07 (5%) | −0.03 |
| Regression, n = 1 | 1.59 | 1.33 | 1.20 | −0.39 (−25%) | −0.26 (−16%) | −0.13 (−10%) | −0.07 |
| Pretreatment METAVIR fibrosis stages | |||||||
| F1, n = 3 | 1.37 | 1.30 | 1.37 | 0.22 (19%) | 0.02 (2%) | 0.07 (5%) | 0.05 |
| F2, n = 18 | 1.79 | 1.32 | 1.25 | −0.36 (−25%)f | −0.31 (−18%)f | −0.05 (−3%) | −0.07 |
| F3, n = 9 | 2.21 | 1.50 | 1.23 | −0.85 (−39%)f | −0.50 (−26%)f | −0.14 (−9%)f | −0.17 |
| F4, n = 5 | 2.57 | 2.23 | 1.94 | −0.63 (−24%) | −0.34 (−13%) | −0.29 (−13%) | −0.13 |
Δ indicates the paired difference (= follow-up value minus pretreatment value). Values are presented as medians (percentages).
Abbreviations: ALT, alanine aminotransferase; F1–F4, fibrosis stages; Pre, pretreatment biopsy; Post, posttreatment biopsy; SVR, sustained virological response.
aThe timeframe of “Pre–SVR” in the subgroup with non-SVR (n = 7) was from the pretreatment biopsy to 24 weeks after the end of treatment. The timeframe of “SVR–Post” in the subgroup with non-SVR (n = 7) was from 24 weeks after the end of treatment to the posttreatment follow-up.
bRate = liver stiffness change (meter per second), divided by years apart.
cIn this subgroup (n = 35) with paired biopsies, the liver stiffness value was available at the defined SVR visit, too.
dThe median time interval between the paired biopsies was 4.2 years (interquartile range = 0.8).
eProgression: ≥1 increase in paired fibrosis stages; regression: ≥1 decline in fibrosis stages on histology.
fP < .05. using the Wilcoxon signed-rank test.
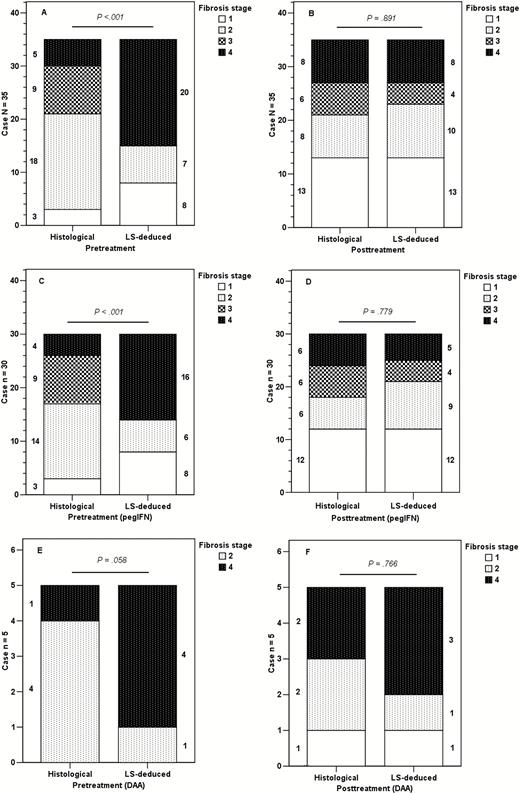
Comparisons between the pretreatment and posttreatment proportions, stratified by histological fibrosis stages and stiffness-deduced fibrosis stages. LS-deduced fibrosis staging was implemented by applying the following cutoff values (m/s): METAVIR fibrosis stage F1 versus F2–F4, F1–F2 versus F3–F4, and F1–F3 versus F4 by 1.47, 1.81, and 1.86 in the pretreatment group, respectively, and 1.22, 1.59, and 1.75 in the post-SVR group, respectively. (A, B) Total patients with paired biopsies (n = 35). (C, D) Patients who received pegIFN-based therapy (n = 30). (E, F) Patients who received DAA-based therapy (n = 5; numbers beside the plotted bars indicate the case number for each fibrosis stage). Abbreviations: DAA, direct-acting antiviral-based therapy; LS, liver stiffness; pegIFN, pegylated interferon–based therapy.
Linear Regression Analyses for Liver Stiffness Values
Through univariate and multiple linear regression analyses, concurrent body mass indices, the concurrent METAVIR fibrosis stages, and serum ALT levels or METAVIR activity, the grades were identified as significant factors that explained the pretreatment, treatment-naive and post-SVR LS values (Supplementary Tables 11 and 12).
Discussion
In this histology-based study, we validated the diagnostic performance of the ARFI elastography through the bootstrap method in staging histological fibrosis in CHC patients with resolved hepatic necroinflammation after viral eradication. Through independent comparisons of the pretreatment and post-SVR AUROCs, the results indicate that ARFI elastography is a comparable option to liver fibrosis stage at both the pretreatment baseline and the post-SVR follow-up (Table 3, Supplementary Table 10).
Over the decades, LS has become a valuable, noninvasive biomarker for modeling liver disease progression and regression on a continuous, noncategorical scale as LS changes [32]. The paradigm of LS measurements has changed from cross-sectional, liver fibrosis staging alone to comprehensive, liver-related risk estimation. With the DAAs as the standard of care for CHC, monitoring the fibrosis status of patients following the SVR is essential, because residual liver fibrosis—in particular, fibrosis stage ≥2—is a predictor of future hepatocellular carcinoma development [9, 33]. We demonstrated that ARFI elastography stages liver fibrosis, with promising performances in CHC at the pretreatment, treatment-naive baseline and after viral eradication. Thus, ARFI elastography can be recommended as a reliable tool for monitoring liver fibrosis and predicting long-term outcomes in patients with CHC, whether on or off treatment.
In this study, multiple regression analyses further revealed that the concurrent liver fibrosis histological stage and serum- and histology-based necroinflammatory activity explained pretreatment and post-SVR LS values (Supplementary Tables 11 and 12). LS values were significantly lower in the post-SVR group, given the same fibrosis stage, which highlights the potential effect of necroinflammation on LS (Table 1; Figure 2). Likewise, in the subgroup with paired biopsies, LS values mainly declined between the pretreatment biopsy and SVR visits (or 24 weeks after the end of treatment), but minimally between the SVR visit and posttreatment biopsy, which indicates the early effect of necroinflammation on LS. Furthermore, a significant decline in LS values in both the stasis and regression subgroups of fibrosis stages, but not in the progression subgroup (Table 4), reflects the limitations of METAVIR fibrosis staging using morphology categories to indicate the actual, concurrent fibrosis content, as shown recently [23].
This study had several potential limitations. First, only those willing to undergo a biopsy during the study period were included [32]. Second, this study included only those exhibiting a uniform treatment response—namely, SVR alone—because heterogeneity was observed in LS changes in treated groups without SVR [13]. Thus, comparisons [8] between groups with and without SVR were infeasible. Third, fibrosis progression may be underscored in baseline METAVIR fibrosis stage 4, which encompasses a broad spectrum of fibrogenesis. Fourth, early LS declines are significant in treatment-experienced patients with chronic hepatitis B or C [10, 34]. Although we measured LS at the SVR visit in patients with paired biopsies to demonstrate this decline (Table 4), more or earlier LS measurements than the present one, in a larger cohort of patients, are warranted to validate this finding and delineate clearly the kinetics of the 2-phased declines in LS. Fifth, a minority of post-SVR patients still had low degrees of necroinflammation [7], which were attributed to steatosis. The percentages of patients with METAVIR A1 or A2 and concurrent serum ALT levels ≥40 U/L were 13.0% (n = 16/123) and 11.4% (n = 14/123), respectively (Table 1). Sixth, despite the decreased confounding effect of necroinflammation on LS measurements, the diagnostic performance of ARFI elastography at the post-SVR follow-up was not higher than that at the pretreatment baseline (Table 3). The diagnostic performances of ARFI elastography were likewise comparable between the pretreatment (n = 83) and post-SVR (n = 109) subgroups with concurrent ALT levels <40 U/L (Supplementary Tables 9 and 10). Furthermore, the diagnostic performances of ARFI elastography were comparable to other noninvasive modalities (Supplementary Tables 6–8). The limited number of patients (n = 123) and the narrower range of distribution of the LS values in the post-SVR cohort may have offset the diagnostic performance of ARFI elastography in this population. Further large-scale studies on patients receiving DAA-based therapy are warranted to validate and compare the diagnostic performances of these modalities in fibrosis staging at the pretreatment and post-SVR measurements. Last, the collagen-proportionate areas in liver tissue sections may be measured and compared between the pretreatment and post-SVR groups in the same METAVIR fibrosis stage. Information on collagen content may allow us to estimate the relative contributions of necroinflammatory resolution and fibrosis regression to the LS decline observed in the post-SVR group.
Although this histology-based study included only a small sample size with paired liver biopsies, the serial changes in METAVIR fibrosis stages and LS values illustrated that LS values declined in patients with stasis and regression of the fibrosis stages (Table 4; Supplementary Tables 3–5). These data support the finding that the cutoffs for predicting the fibrosis stages in patients with CHC post-SVR were lower than those in patients at pretreatment. Despite these potential limitations, this study clearly indicated that distinct and lower cutoff values should be adopted for predicting liver fibrosis stages when ARFI elastography is applied for patients with CHC post-SVR. Adopting the same cutoff values will underrate fibrosis stages in patients post-SVR, as reported previously [23]. Moreover, we demonstrated the significant concordance between the histology and elastography to stage posttreatment liver fibrosis in the subgroup with paired liver biopsies (Figure 3).
In conclusion, after viral eradication, the performance of LS measurements through ARFI elastography is promising to stage the liver fibrosis on necroinflammation-resolved histology in patients with CHC. Our subgroup study revealed that LS declined in values and cutoffs in parallel with regressions in liver fibrosis stages and resolutions in necroinflammatory degrees, and even with stases in fibrosis stages on paired histology in patients treated for CHC. Concurrent histological fibrosis stages and the necroinflammatory degrees explained the treatment-naive and post-SVR LS values.
Supplementary Data
Supplementary materials are available at Clinical Infectious Diseases online. Consisting of data provided by the authors to benefit the reader, the posted materials are not copyedited and are the sole responsibility of the authors, so questions or comments should be addressed to the corresponding author.
Notes
Financial support. This study was supported by the Ministry of Science and Technology, Taiwan (grant number MOST 104-2314-B-039-014).
Potential conflicts of interest. The authors: No reported conflicts of interest. All authors have submitted the ICMJE Form for Disclosure of Potential Conflicts of Interest. Conflicts that the editors consider relevant to the content of the manuscript have been disclosed.

