


Abstract
Minimum inhibitory concentration (MIC) testing, unlike routine drug susceptibility testing (DST) at a single critical concentration, quantifies drug resistance. The association of MICs and treatment outcome in multidrug-resistant (MDR)–tuberculosis patients is unclear. Therefore, we correlated MICs of first- and second-line tuberculosis drugs with time to sputum culture conversion (tSCC) and treatment outcome in MDR-tuberculosis patients.
Clinical and demographic data of MDR-tuberculosis patients in Sweden, including DST results, were retrieved from medical records from 1992 to 2014. MIC determinations were performed retrospectively for the stored individual Mycobacterium tuberculosis (Mtb) isolates using broth microdilution in Middlebrook 7H9. We fitted Cox proportional hazard models correlating MICs, DST results, and clinical variables to tSCC and treatment outcome.
Successful treatment outcome was observed in 83.5% (132/158) of MDR-tuberculosis patients. Increasing MICs of fluoroquinolones, diabetes, and age >40 years were significantly associated with unsuccessful treatment outcome. Patients treated with pyrazinamide (PZA) had a significantly shorter tSCC compared to patients who were not (median difference, 27 days).
Increasing MICs of fluoroquinolones were correlated with unsuccessful treatment outcome in MDR-tuberculosis patients. Further studies, including MIC testing and clinical outcome data to define clinical Mtb breakpoints, are warranted. PZA treatment was associated with shorter tSCC, highlighting the importance of PZA DST.
The increased incidence of multidrug-resistant (MDR) tuberculosis is a major cause for concern. For example, by 2040, MDR tuberculosis is predicted to account for 12.4% of all tuberculosis cases in India, 8.9% in the Philippines, and 32.5% in Russia, leading to serious public health implications [1]. Treatment outcomes of MDR tuberculosis are poor, with 54% treatment success in Europe for patients initiating treatment in 2014 [2].
The importance of drug susceptibility testing (DST) to individualize tuberculosis treatment is well established, and resistance to key drugs has been linked with poor treatment outcome [3]. However, DST for Mycobacterium tuberculosis (Mtb) does not quantify resistance, and the critical concentrations (CCs) used for DST have not been derived from clinical outcome or pharmacokinetic/pharmacodynamics data, which is routine when committees such as the European Committee on Antimicrobial Susceptibility Testing set clinical breakpoints for other bacteria [4]. Minimum inhibitory concentration (MIC) testing has been highlighted as a tool to differentiate susceptibility levels close to and above the CC, where an intermediate category, that is, susceptible, increased exposure, has been proposed. In this category, low-level resistant isolates may be accessible to treatment by increasing drug exposure [5, 6]. However, studies regarding the association between Mtb MICs and MDR-tuberculosis treatment outcome are scarce.
Pyrazinamide (PZA) is pivotal for the shortening of standard tuberculosis treatment [7] but is often used without prior DST since PZA DST is not widely available in high-endemic settings [8]. PZA is now regarded as an add-on agent in the recently revised World Health Organization (WHO) treatment guidelines, and the benefit of PZA in MDR tuberculosis is unclear [9–12]. PZA MICs are even more rarely performed than routine DST, as they require Bactec MGIT 960 and are not available in microdilution methods. In this study, we collected extensive clinical and microbiological data for all MDR-tuberculosis patients from 1992 to 2014 in Sweden. We hypothesized that there was an association of MICs for second-line drugs with treatment outcome and time to sputum culture conversion (tSCC) in MDR-tuberculosis patients.
METHODS
Setting
Tuberculosis is a notifiable disease in Sweden, with mandatory reporting by laboratories and clinicians, enabling full-coverage identification of all diagnosed cases. National identification numbers are used in reporting, ensuring reliable data. Tuberculosis treatment is free of charge and individualized according to DST results.
Study Design and Study Population
We performed a national retrospective observational cohort study of all MDR-tuberculosis cases diagnosed in Sweden from 1992 to 2014. All MDR-tuberculosis cases were confirmed by DST and identified through the national tuberculosis registry at the Public Health Agency of Sweden.
Data Collection
Two infectious diseases consultants and 1 medical student reviewed the medical records using a standardized form, with a 20% overlap for quality control. Data were collected regarding sociodemographic information (ie, gender, age, country of origin, years in Sweden, asylum status, use of interpreter) and clinical characteristics (ie, smoking, alcohol/drug use, height, weight, comorbidities, radiology reports, treatment regimens and duration, adverse drug reactions, tSCC, treatment outcome, and microbiological data including routine DST). Treatment with a drug was defined as treatment duration of 1month or longer. Comorbidities were categorized according to International Classification of Diseases, Tenth Edition, Clinical Modification [13].
Outcome Measures
Successful treatment outcome was defined as cure or treatment completion. We defined unsuccessful treatment outcome as death/failure/relapse/loss to follow-up, according to WHO definitions, although death/failure/relapse was also analyzed since the reasons for loss to follow-up are multifactorial. Treatment outcome was defined according to WHO 2006 definitions [14], and outcomes from medical records were cross-referenced with outcomes in the registry for quality assurance. “Relapse patient” was defined according to WHO as a patient with tuberculosis previously cured or treatment completed but now diagnosed with a recurrent episode of tuberculosis (either a true relapse or a new episode of tuberculosis caused by reinfection). Sputum culture was routinely performed weekly, and sputum culture conversion was defined as 2 consecutive negative cultures, collected >30 days apart [12].
Laboratory Methods
Drug Susceptibility Testing
DST for second-line tuberculosis drugs is performed at the tuberculosis laboratory at the Public Health Agency of Sweden, a national and supranational reference laboratory. DST, including PZA, was performed according to WHO-based CCs by the proportion method in Bactec 460 tuberculosis until 2008, when it was replaced by Bactec MGIT 960. The solid medium Löwenstein-Jensen (LJ) proportion method was used for para-aminosalicylic acid and cycloserine according to WHO recommendations [15]. Ofloxacin (OFX) was used as a marker for fluoroquinolone resistance as it was consistently tested during the study period at the same CC (2 mg/L) [16].
Minimal Inhibitory Concentration Determination
After initial DST, all Mtb isolates were stored at −80°C at the Public Health Agency of Sweden. The isolates were later thawed and cultured on LJ media for subsequent MIC determination using 2 custom-made broth microdilution plates, CML1FSWE and UKMYC5 (Thermo Fisher Scientific, Cleveland, OH; Supplementary Figure 1) [17].
The CML1FSWE plates were thawed and inoculated according to the manufacturer’s instructions. In short, a 0.5 McFarland equivalent suspension with Mtb in Sensititre Saline Tween was diluted in 7H9 with OADC (oleic acid albumin dextrose catalase) to a final inoculum of 1 × 10⁵ colony-forming units per milliliter. Finally, 100 µL was distributed to each well, incubated at 37°C, and read after 10 days up to 21 days when growth in the positive control was visible, aided by Sensititre Mirror. In some cases, MIC results were available in both plates (CML1FSWE or UKMYC5) and the selection criteria were based on the performance of the quality control (H37Rv ATCC 27294) [18]. The MIC was defined as the lowest drug concentration inhibiting visible growth of bacteria. MIC determination was not performed for PZA.
STATISTICAL ANALYSES
Descriptive data were presented as percentages for categorical variables and medians and interquartile range (IQR) for continuous variables. Categorical data were compared using Pearson χ2 test. When testing the association between MICs and treatment outcome, the main analysis was restricted to patients with susceptible Mtb and treated with the drug group corresponding to the MIC analyzed. We performed a complete case analysis using Cox proportional hazard model with time since start of MDR-tuberculosis treatment as the time scale. Patients were followed until time of event (SCC or composite treatment outcome) or up to 18 months after treatment completion, whichever occurred first.
The Kaplan-Meier curve was used to visualize differences in tSCC. All tests were 2-sided, and a P value < .05 was defined as statistically significant. We used Stata version 13.1 for all analyses (StataCorp 2013, College Station, TX).
RESULTS
Over the 22-year study period, there were 12 463 tuberculosis cases reported in Sweden, of which 163 (1.3%) were MDR tuberculosis (Supplementary Figure 2) [18]. After review, 5 cases were excluded (1 found not to be MDR tuberculosis, 4 without available medical records), leaving 158 for analysis. Country of origin and sociodemographic and clinical characteristics are summarized in Figure 1 and Table 1, respectively. The majority were male (91/158, 57.6%), the median age was 29 (range, 1–85 years), and there were 22 children (13.9%, aged <18 years). Foreign origin was common (149/158, 94.3%) with a median time in Sweden of 1 year (IQR, 1–2), and language interpreters were used in 80% (116/145) of the cases. Pulmonary tuberculosis (PTB) was the most common form of tuberculosis (122, 77.2%), of which 65 (53.3%) were sputum smear positive. Seven patients had type 2 diabetes, of which 6 were on insulin treatment.
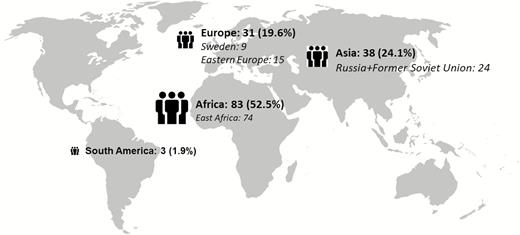
Country of origin for multidrug-resistant tuberculosis patients in Sweden, 1992–2014. Missing = 3.
Characteristics of the 158 Multidrug-resistant Tuberculosis Patients in Sweden, 1992–2014
| Variable | Number or Median (% or IQR) | |
|---|---|---|
| Male sex | 91/158 | (57.6) |
| Age, y (IQR) | ||
| <18 | 22 | (13.9) |
| 18–39 | 94 | (59.5) |
| 40–59 | 33 | (20.9) |
| ≥60 | 9 | (5.7) |
| Alcohol abusea | 7/136 | (5.1) |
| Smokerb | 33/136 | (24.3) |
| Years in Sweden | 1 | (1–2) |
| Previous tuberculosis treatmentc | 45/154 | (29.2) |
| Human immunodeficiency virus | 10/134 | (7.5) |
| Diabetes mellitus | 7/156 | (4.5) |
| Body mass index (n = 65) | 20.2 | (18.1–22.5) |
| PTB | 122/158 | (77.2) |
| Cavitary PTBd | 50/122 | (41.0) |
| Sputum smear + | 65/122 | (53.3) |
| Time to SCC in days (n = 86) | 47 | (30–60) |
| SCC at 2 monthse | 54 | (34.2) |
| SCC at 3 monthse | 66 | (41.8) |
| Poor adherencef | 36/151 | (23.8) |
| Pre-XDR tuberculosis | 22/158 | (14.0) |
| XDR tuberculosis | 9/158 | (5.7) |
| Treatment duration (months, IQR)g n = 155 | 19 | (18–243) |
| No. of drugs n = 149 | 4 | (3–4) |
| No. of regimen changes n = 151 | 4 | (2–7) |
Abbreviations: IQR, interquartile range; PTB, pulmonary tuberculosis; SCC, sputum culture conversion; XDR, extensively drug-resistant tuberculosis.
aAlcohol abuse as noted in the medical records.
bPrevious or current smoker at diagnosis.
cPrevious tuberculosis treatment was defined as patients previously treated with first- or second-line tuberculosis drugs.
dPresence of cavity on chest X-ray was based on radiology reports.
eNumber of patients achieving sputum culture conversion after 2 and 3 months of MDR-TB treatment respectively.
fPoor adherence noted in the medical records; no objective measure of drug intake recorded.
gTreatment duration for patients with successful treatment outcome.
Drug-resistance Patterns
Resistance to the first- and second-line drugs was 52.5% for PZA, 43.7% for ethambutol (EMB), 15.2% for second-line injectable drugs (SLID) such as amikacin, kanamycin, or capreomycin, and 10.1% for OFX. There was a significant association between previously treated (first-/second-line treatment) tuberculosis patients and resistance to fluoroquinolones (22.2% vs 5.5% for treatment naive patients; P = .002) and SLID (24.4% vs 11.8% for treatment naive patients; P = .049) but not with PZA and EMB. The DST results for first- and second-line drugs are summarized in Table 2.
Resistance Patterns Using Routine Drug Susceptibility Testing and Drug Use in Multidrug-resistant Tuberculosis Patients in Sweden, 1992–2014
| Drug | Number of Patients Treated (%) (n = 155) | Total Drug Susceptibility Tests Performed for Each Drug | Drug Resistance (%) |
|---|---|---|---|
| Group A | 128 (83.7) | 158 | 16 (10.1) |
| Ofloxacina | 8 (5.2) | 158 | 16 (10.1) |
| Levofloxacin | 102 (65.8) | nd | nd |
| Moxifloxacin | 41 (26.5) | 89 | 7 (7.9) |
| Group B | 137 (88.4) | 158 | 24 (15.2) |
| Amikacin | 136 (87.7) | 132 | 15 (11.4) |
| Capreomycin | 4 (2.6) | 98 | 15 (15.3) |
| Kanamycin | 1 (0.6) | 83 | 14 (16.9) |
| Group C | |||
| Pro/Ethionamide | 98 (63.2) | 110 | 37 (33.6) |
| Cycloserine | 90 (58.1) | 93 | 0 |
| Linezolid | 67 (43.2) | 107 | 1 (1.0%) |
| Clofazimine | 21 (13.5) | nd | nd |
| Group D | |||
| Ethambutol | 109 (70.3) | 158 | 69 (43.7) |
| Pyrazinamide | 92 (59.3) | 158 | 83 (52.5) |
| High-dose isoniazid | 26 (16.8) | 158 | 158 (100) |
| Bedaquiline | 3 (1.9) | nd | nd |
| Delamanid | 0 | nd | nd |
| Para-aminosalicylic acid | 41 (26.5) | 92 | 7 (8.5%) |
| Amoxicillin-clavulanate | 8 (5.2) | nd | nd |
| Carbapenemsb | 2 (1.3) | nd | nd |
n = 158.
Abbreviation: nd, no data.
aOfloxacin drug susceptibility testing was used to guide the use of levofloxacin for treatment.
bUsed in combination with amoxicillin-clavulanate.
Treatment Regimens and Outcomes
The median treatment length was 19 months (IQR, 18–24) for patients with a successful treatment outcome; a majority of patients were treated with 4 or more active drugs using recommended dosages (Table 1, Supplementary Table 1), with directly observed therapy for 45.4% (69/152). Levofloxacin (LFX) and amikacin (AM), together with PZA and EMB, were the most common combination, with the addition of prothionamide, cycloserine, and/or linezolid, in order of decreasing frequency. Treatment changes were common, with a median number of changes of 4 (IQR, 3–4), and adverse events were reported for 68.1% patients (98/144). The most common dosing scheme for SLID was 2 weeks of daily administration, followed by thrice weekly administration (69/138 patients with SLID treatment) with a median dose of 875 mg (IQR, 650–1000), with no difference in treatment outcomes between more frequent dosing scheme and thrice weekly (P = .552). Although not recommended at the time of the study, there were 48 (30.3%) patients who were eligible for the recently introduced WHO short-course regimen [19].
Successful treatment outcomes were observed in 83.5% of patients (132/158, Figure 2). When the revised WHO definitions from 2013 were applied [20], where a permanent regimen change of at least 2 drugs due to adverse events is defined as treatment failure, treatment failure occurred in 51 patients (32.3%) compared to 3 patients (1.9%) using the earlier WHO definitions (P < .001) [14]. True relapse of tuberculosis was confirmed by whole-genome sequencing (WGS) analysis for 5 of the 7 relapse patients, according to previously defined thresholds [21]. The remaining 2 relapse patients had Mtb strains epidemiologically unique to Sweden and no probable source of reinfection. Since only 1 isolate was stored, WGS confirmation of true relapse was not possible, and the episodes were classified as recurrent tuberculosis.
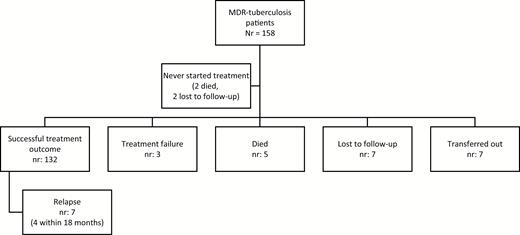
Treatment outcome of MDR tuberculosis patients in Sweden, 1992–2014, according to World Health Organization definitions. Abbreviation: MDR, multidrug-resistant.
MIC Distributions and Variables Associated With Treatment Outcome
MICs for first- and second-line drugs were obtained for 142 of 158 Mtb isolates (10 isolates were not stored, 6 did not grow). The MIC distributions are listed in Table 3, and the relationship between MICs vs routine DST and treatment outcome is shown in Supplementary Figure 3 [22, 23].
Minimum Inhibitory Concentrations for Multidrug-resistant Mycobacterium tuberculosis Isolates
| Drug concentration (mg/L) | ||||||||||||
|---|---|---|---|---|---|---|---|---|---|---|---|---|
| Drug | ≤0.015 | 0.03 | 0.06 | 0.12 | 0.25 | 0.5 | 1 | 2 | 4 | 8 | 16 | >16 |
| Ofloxacina | … | … | ... | 0 | 17 | 50 | 49 | 21 | 4 | 4 | 3 | 1 |
| Levofloxacin | ... | ... | ... | 2 | 37 | 81 | 8 | 7 | 6 | 1 | ... | ... |
| Moxifloxacin | ... | ... | 6b | 37 | 70 | 19 | 3 | 4 | 2 | 1 | ... | ... |
| Amikacina | ... | ... | ... | 2 | 34 | 59 | 21 | 7 | 3 | 1 | 1 | 14 |
| Capreomycina | ... | ... | ... | ... | 0 | 13 | 43 | 16 | 16 | 7 | 3 | 3 |
| Kanamycina | ... | ... | ... | ... | 0 | 49 | 44 | 13 | 11 | 5 | 1 | 19 |
| Ethionamide | ... | ... | ... | ... | 5 | 37 | 40 | 37 | 8 | 5 | 10 | |
| Cycloserinea | ... | ... | ... | ... | ... | ... | ... | ... | 17 | 52 | 58 | 15 |
| Linezolid | ... | 0 | 4 | 10 | 63 | 62 | 1 | 1 | 1 | ... | ... | ... |
| Clofazimine | ... | ... | 128b | 13 | 1 | 0 | 0 | 0 | ... | ... | ... | ... |
| Ethambutola | ... | ... | ... | ... | 0 | 5 | 25 | 20 | 29 | 23 | 13 | 4 |
| Para-aminosalicylic acida | ... | ... | ... | 24c | 35 | 31 | 19 | 11 | 9 | 2 | 4 | 7 |
| Bedaquiline | 50 | 74 | 18 | 0 | 0 | 0 | 0 | ... | ... | ... | ... | ... |
| Delamanid | 137 | 3 | 2 | 0 | 0 | 0 | 0 | 0 | ... | ... | ... | ... |
n = 142. Two customized microdilution plates (UKMYC5 and CML1FSWE; Supplementary Figure 1) were used to cover for new and old drugs used for treatment for the multidrug-resistant tuberculosis patients in the cohort. Both microdilution plates were analyzed in parallel and always with H37Rv American Type Culture Collection (ATCC) 27294 included in each round. In general, when the same drug was tested in both plates (levofloxacin, moxifloxacin, amikacin, kanamycin, ethambutol, ethionamide, and para-aminosalicylic acid [PAS]), the minimum inhibitory concentration (MIC) from the microdilution plate was selected where the MICs of H37Rv ATCC 27294 were closest to the mode and within the MIC ranges, where defined by Kaniga et al [17]. For example, the MIC range in the UKMYC5 plate for amikacin led to a substantial truncation with 108/142 (76.1%) isolates ≤0.25 mg/L of amikacin, making a more exact MIC determination impossible and the CML1FSWE plate more suitable.
Ethionamide was out of quality control range for H37Rv in the CML1FSWE but not in the UKMYC5 plate, whereas the reverse was the case for PAS. Ofloxacin, capreomycin, and cycloserine were only present in the CML1FSWE microdilution plate. Bedaquiline, delamanid, linezolid, and clofazimine were only present in the UKMYC5 plate and were included even if the MIC range was truncated both for H37Rv and a substantial amount of clinical isolates for clofazimine (90.1%, 128/142) and delamanid (96.5%, 137/142).
aCML1FSWE microdilution plate. All the other MCIs were determined using the UKMYC5 plate.
b≤0.06 mg/L.
c≤0.12 mg/L.
In a univariate analysis, the MICs of LFX, OFX, and ethionamide (ETO) were significantly correlated to treatment outcome, with lower MICs associated with an increased rate of successful treatment outcome (Table 4). In a multivariate model, including all patients regardless of use of or resistance to fluoroquinolones and adjusting for age, gender, and year of diagnosis, higher MICs of LFX were still significantly associated with unsuccessful treatment outcome (adjusted hazard ratio [aHR], 1.77; 95% confidence interval [CI], 1.15–2.71; P = .009). When restricting analysis to patients with an LFX-susceptible Mtb isolate treated with a fluoroquinolone (n = 125), the association was significant in univariate analysis (cHR, 2.00; 95% CI, 1.19–3.37; P = .009) but not in multivariate analysis (aHR, 1.70; 95% CI, 0.85–3.40; P = .134). Using these criteria, the higher MICs of OFX remained significantly associated with unsuccessful treatment outcome after adjustment (aHR, 1.25; 95% CI, 1.02–1.53; P = .030). In a sensitivity analysis of treatment outcome, not including relapses (ie, death/failure), the results for the fluoroquinolones were still significant (data not shown). In contrast, increments of MIC of ETO were not significantly associated with unsuccessful treatment outcome in the adjusted analysis (aHR, 1.18; 95% CI, 0.98–1.41; P = .074) for patients with ETO-susceptible isolates and receiving ETO/prothionamide.
Univariate Cox Regression Analysis Regarding Individual Minimum Inhibitory Concentrations of First- and Second-line Tuberculosis Drugs and Corresponding Composite Treatment Outcomes*
| Death/Failure/Relapse, n = 15/158 | Death/Failure/Relapse/Lost to Follow-up, n = 22/158 | ||||
|---|---|---|---|---|---|
| Minimum Inhibitory Concentration (mg/L) | Total | HR (95% CI) | P Value | HR (95% CI) | P Value |
| Group A | |||||
| Levofloxacin | 125 | 2.08 (1.10–3.92) | .024 | 2.00 (1.19–3.37) | .009 |
| Moxifloxacin | 125 | 2.09 (0.30–14.52) | .458 | 2.06 (0.42–10.07) | .374 |
| Ofloxacin | 125 | 1.33 (1.03–1.73) | .030 | 1.43 (1.19–1.72) | <.001 |
| Group B | |||||
| Amikacin | 118 | 0.98 (0.77–1.24) | .852 | 0.98 (0.80–1.18) | .799 |
| Kanamycin | 118 | 1.01 (0.92–1.10) | .899 | 1.03 (0.98–1.09) | .265 |
| Capreomycin | 115 | 1.06 (0.94–1.19) | .326 | 1.08 (1.01–1.16) | .025 |
| Group C | |||||
| Prothionamide | 77 | 1.11 (0.79–1.56) | .555 | 1.17 (0.92–1.49) | .205 |
| Ethionamide | 77 | 1.25 (1.05–1.48) | .013 | 1.17 (1.01–1.37) | .038 |
| Cycloserine | 85 | 0.95 (0.82–1.11) | .522 | 0.96 (0.86–1.07) | .459 |
| Linezolid | 62 | 0.89 (0.00–2141.01) | .977 | 5.79 (0.02–1716.30) | .545 |
| Group D | |||||
| Ethambutol | 74 | 0.88 (0.65–1.21) | .436 | 0.84 (0.62–1.16) | .289 |
| Para-aminosalicylic acid | 38 | 0.06 (0.00–55.57) | .426 | 1.11 (1.03–1.19) | .009 |
| Clinical data | |||||
| Gender | 154 | 1.08 (0.34–3.42) | .893 | 1.33 (0.52–3.39) | .548 |
| Age | 154 | 1.07 (1.04–1.10) | <.001 | 1.05 (1.03–1.08) | <.001 |
| Year of diagnosis | 154 | 0.93 (0.86–1.02) | .109 | 0.96 (0.89–1.03) | .248 |
| Diabetes | 152 | 8.97 (1.87–43.1) | .006 | 8.09 (2.30–28.5) | <.001 |
Statistically significant values are shown in bold.
For all drugs listed, the analysis was restricted to patients with a susceptible isolate who received treatment with the drug or group of drugs analyzed. For example, for analysis of levofloxacin, all patients treated with a fluoroquinolone with an ofloxacin-susceptible isolate were included. No patients were treated with bedaquiline or delamanid and no minimum inhibitory concentration (MIC) determination of pyrazinamide was performed. Analysis of MIC of clofazimine was not possible due to too few treated patients. Diabetes mellitus type II (7 cases), no cases of type I.
Nonsignificant variables: gender, alcohol abuse, smoking, previous tuberculosis treatment, human immunodeficiency virus, body mass index, cavitary pulmonary tuberculosis, pre-extensively drug-resistant (XDR) and XDR tuberculosis, number of resistant drugs.
The proportional hazard assumption for the Cox models was formally tested using Schoenfeld residuals, and proportionality was met for all models. The individual MICs were entered as a discrete variable in the model (Table 3). The hazard ratio applies to an increment of MIC dilution step.
The individual MICs were entered as a continuous variable in the model (Table 3) and the hazard ratio applies to an increment of MIC dilution-step.
Abbreviations: CI, confidence interval; HR, hazard ratio.
*Death/failure/relapse and death/failure/relapse/lost to follow-up.
Diabetes comorbidity (aHR, 5.52; 95% CI, 1.42–21.55; P = .014) was significantly associated with unsuccessful treatment outcome (death/failure/relapse/lost to follow-up) after adjustment for age, gender, and year of diagnosis, and similar results were seen for increased age (age >40 years: aHR, 4.51; 95% CI, 1.74–11.67; P = .002), adjusted for gender and year of diagnosis. No associations between DST results (susceptible vs resistance) of the different drugs, previous tuberculosis, cavitary PTB, and pre-extensively drug-resistant (XDR) and XDR tuberculosis, and treatment outcome were seen.
PZA Treatment and Resistance in Association With Time to Sputum Culture Conversion
Sputum culture conversion was achieved for 84 of the 87 patients with available information for tSCC; the median time to conversion was 46 days (IQR, 13.8–79.3).
In a univariate analysis, PZA treatment, AM treatment, later year of diagnosis, and increasing body mass index were significantly associated with shorter tSCC, whereas PZA resistance, previous tuberculosis treatment, sputum smear positivity, and poor adherence were associated with longer tSCC (Table 5). The median tSCC was 27 days shorter for patients who received PZA in their MDR-tuberculosis regimen compared to patients who did not. The significant association with PZA treatment and tSCC is shown in Figure 3. Cavitary PTB, pre-XDR and XDR tuberculosis, and human immunodeficiency virus (HIV) were not associated with tSCC.
Univariate and Multivariate Cox Regression Analysis of Variables Associated With Time to Sputum Culture Conversion
| Univariate | Multivariatea | |||||
|---|---|---|---|---|---|---|
| Variable | Total | Crude HR (95% CI) | P Value | Total | Adjusted HR (95% CI) | P Value |
| Year diagnosed | 79 | 1.11 (1.04–1.17) | .001 | 78 | 1.10 (1.03–1.17) | .003 |
| Previous tuberculosis treatment | 79 | 0.50 (0.30–0.83) | .007 | 78 | 0.49 (0.28–0.84) | .010 |
| Body mass index | 40 | 1.15 (1.05–1.26) | .002 | 40 | 0.99 (0.87–1.13) | .918 |
| Smear positive at diagnosis | 78 | 0.39 (0.23–0.67) | .001 | 78 | 0.42 (0.24–0.74) | .003 |
| Poor adherenceb | 79 | 0.57 (0.33–0.97) | .039 | 78 | 0.60 (0.34–1.05) | .075 |
| Pyrazinamide treatment | 78 | 1.84 (1.12–3.04) | .017 | 77 | 2.38 (1.39–4.06) | .002 |
| Pyrazinamide resistance | 79 | 0.49 (0.29–0.83) | .008 | 79 | 0.52 (0.29–0.91) | .022 |
| Amikacin treatment | 78 | 2.18 (1.03–4.62) | .042 | 77 | 1.39 (0.59–3.28) | .456 |
Statistically significant values are shown in bold.
Pyrazinamide and amikacin treatment defined as treatment for 1 month or more as part of the multidrug-resistant tuberculosis regimen.
Abbreviations: CI, confidence interval; HR, hazard ratio.
aAdjusted for gender, age, year of diagnosis, previous tuberculosis treatment, and sputum smear positivity at diagnosis.
bPoor adherence noted in the medical records; no objective measure of drug intake recorded.
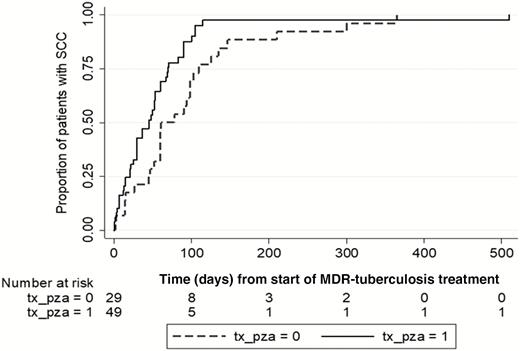
Kaplan-Meier failure curve for time to sputum culture conversion (SCC) from start of multidrug-resistant (MDR) tuberculosis (TB) treatment. Complete case analysis showing both patients receiving treatment with pyrazinamide (PZA) (solid line, tx_pza=1) one month or longer at any time during TB treatment as well as patients not receiving PZA (dashed line, tx_pza=0).
In a multivariate analysis, PZA included in the MDR-tuberculosis regimen for 1 month or more was significantly associated with a shorter tSCC (aHR, 2.38; 95% CI, 1.39–4.06; P = .002). PZA treatment (≥1 month) was initially given to 31.7% (26/83) of patients prior to DST and MDR-tuberculosis diagnosis where DST later showed PZA resistance. In these patients, PZA treatment was not associated with a shortened tSCC as opposed to when PZA treatment was guided by DST results. No significant interactions were found between PZA and treatment with second-line drugs such as fluoroquinolones.
DISCUSSION
Here, we show that higher MICs of fluoroquinolones, as well as diabetes and increasing age, were associated with an increased rate of unsuccessful treatment outcomes, including relapses in MDR-tuberculosis patients. In support of the importance of MICs, a recent clinical study showed increased pretreatment MICs for either isoniazid or rifampicin to be associated with an increased relapse rate [24], although it is unclear whether differences within the wild type can be detected in a reproducible manner [25]. Furthermore, PZA treatment was associated with shorter tSCC when the Mtb isolate was PZA susceptible.
The importance of fluoroquinolones in MDR-tuberculosis treatment is well known, and fluoroquinolone resistance according to current CCs has been associated with treatment failure [3, 26]. The correlation between MIC of fluoroquinolones and treatment outcome has been shown previously as increasing odds of failure with increasing MICs of gatifloxacin on LJ media [27], a finding our study corroborates with added information on LFX. There could be several reasons why the MICs were associated with the treatment outcome in MDR tuberculosis. The attainment of a pharmacokinetic/pharmacodynamic target is highly dependent on the MIC, although subtherapeutic drug exposure is common [28–30].
There are ongoing efforts to correlate broth microdilution MICs to resistance mutations in a large CRyPTIC study [17]; however, to date, no CCs have been established specifically for this method. Apart from MIC distributions and drug resistance mutations, clinical outcome data in relation to drug exposure are vital factors in establishing clinical breakpoints. In our study, it was the level of MIC in the broth microdilution method, rather than the dichotomous DST result based on current CCs in MGIT, that was associated with treatment outcome. In an exploratory analysis, a cutoff MIC of LFX at 2 mg/L in broth microdilution could not significantly predict treatment outcome in our cohort. The limited number of patients and the multifactorial nature of tuberculosis treatment complicate the identification of a clear cutoff for clinical breakpoints.
We chose microdilution plates for a simple, cost-effective, and high-throughput method for MIC determination. Until the relationships between genotype, phenotype, and clinical breakpoints have been properly defined in a reference DST method, MIC determination is a useful clinical tool to better ascertain the level of resistance for complicated MDR-tuberculosis cases.
Increasing age and concomitant diabetes were also associated with unsuccessful treatment outcome, similar to previous findings [26, 31–33]. The effect estimate of diabetes should be interpreted cautiously due to the small number of diabetic patients (n = 7). The variables not significantly associated with MDR-tuberculosis treatment outcomes are in contrast to previous studies, such as concomitant HIV and XDR tuberculosis [34], possibly explained by lack of power.
PZA treatment was associated with shorter tSCC, but there was no significant association in our study between either PZA resistance or PZA treatment and final treatment outcome. Our results give no support for an indiscriminate use of PZA but reinforce the importance of DST-guided treatment. A Chinese study also showed a significant association between PZA susceptibility in MGIT and reduced tSCC in MDR-tuberculosis treatment [35], although there are conflicting results on the impact of PZA treatment on the treatment outcome in MDR tuberculosis [3, 11, 12]. In the largest individual patient-data metaanalysis to date, the use of PZA, when the Mtb isolate was PZA susceptible, was associated with decreased mortality, although the risk difference was low (−0.03; 95% CI, −0.05 to −0.01) [12]. Nevertheless, with a markedly reduced tSCC with the appropriate use of PZA, our results emphasize the added value of PZA in MDR-tuberculosis treatment.
Treatment outcome definitions affect results of association studies. In our cohort, successful treatment outcome decreased from 83.5% to 51.2% when the revised WHO guidelines were applied [20]. In a setting with active screening for adverse events and individualized therapy, these definitions might be misleading, as highlighted by others [36]. Our study also indicates that a thrice weekly regimen of AM is sufficient, which is in line with a Dutch study where SLID was administered thrice weekly and with a lower median dose of 400 mg [37].
Interestingly, there seems to be an opportunity to use the WHO short-course regimen in Sweden, since approximately one third of patients were eligible in this cohort. This is in contrast with other European settings, possibly due to differences in origin of migrants with MDR tuberculosis [38].
Our study has several limitations including the relatively small number of patients along with high treatment success, making adjustment for all confounders difficult; residual confounding cannot be excluded. There is no reference method for MIC determination for Mtb, and the innate method variability in MIC testing needs to be considered. Thus, any measured MIC value used to guide therapy in a patient is recommended to be inflated with 1 to 2 dilution steps [39]. Nevertheless, our nationwide cohort study covers more than 2 decades of culture-verified MDR-tuberculosis patients with well-characterized clinical data and with MIC distributions for most second-line drugs.
In conclusion, the level of MIC for fluoroquinolones was associated with the final treatment outcome for MDR-tuberculosis patients diagnosed in Sweden over 2 decades. PZA treatment for MDR-tuberculosis patients with PZA susceptibility was associated with shorter tSCC, highlighting the value of PZA DST. With individualized MDR-tuberculosis treatment based on MIC determinations and drug concentrations, it should be possible to reach the same treatment outcome goals as set by the WHO for susceptible tuberculosis.
Supplementary Data
Supplementary materials are available at Clinical Infectious Diseases online. Consisting of data provided by the authors to benefit the reader, the posted materials are not copyedited and are the sole responsibility of the authors, so questions or comments should be addressed to the corresponding author.
Notes
Acknowledgments. The authors thank the CRyPTIC Consortium for the opportunity to use the UKMYC5 plate, Juan-Carlos Toro at the Public Health Agency for contributing to the minimum inhibitory concentration determinations, and Brian Davies for language revision.
Financial support. This work was supported by the Swedish Heart Lung Foundation (grant number 20150508) and the Swedish Research Council (grant number 540-2013-8797).
Potential conflicts of interest. T. S. is the scientific secretary of the European Committee on Antimicrobial Susceptibility Testing (EUCAST) Subcommittee on Antimycobacterial Susceptibility Testing, and C. G. G. is the chair of EUCAST. All other authors report no potential conflicts. All authors have submitted the ICMJE Form for Disclosure of Potential Conflicts of Interest. Conflicts that the editors consider relevant to the content of the manuscript have been disclosed.

