


Abstract
Dipeptidyl peptidase-4 (DPP-4) inhibitors have pleotropic anti-inflammatory and immune regulatory effects in addition to glucoregulation. We evaluated inflammation and immune markers in suppressed human immunodeficiency virus (HIV) infection during treatment with the DPP-4 inhibitor sitagliptin.
Virologically suppressed adults with HIV without diabetes on stable antiretroviral therapy (ART) with ≥100/μL CD4 cells were randomized to 16 weeks of sitagliptin 100 mg/day vs placebo in a multicenter trial. The primary endpoint was the change in plasma soluble CD14 (sCD14) from baseline to week 15–16.
Ninety participants were randomized, and 42 from each arm were included in per-protocol analyses. Participants were 45% non-Hispanic white, 38% non-Hispanic black, and 15% Hispanic, with a median age of 51 years; 83% were male; and the median CD4 count was 602 cells/μL. At week 15–16, there was no difference in sCD14 change between the 2 arms (P = .69). Relative to placebo, the sitagliptin arm had 47% greater decline in CXCL10 (95% confidence interval, –57% to –35%) at week 15 (P < .001). There were no significant between-arm differences in other soluble biomarkers, total CD4 and CD8 counts, or markers of lymphocyte or monocyte activation. Sitagliptin was well tolerated.
Sixteen weeks of sitagliptin had no effect on sCD14 levels in virologically suppressed participants with HIV. CXCL10, a chemokine involved in atherogenesis that predicts non-AIDS events during ART, declined markedly with sitagliptin. This suggests that DPP-4 inhibition has the potential to reduce cardiovascular morbidity in treated HIV infection.
NCT01426438.
Chronic inflammation and immune activation contribute to the higher risk for type 2 diabetes (T2D), cardiovascular disease, and other comorbid complications as well as mortality in people living with human immunodeficiency virus type 1 (HIV-1) infection (PLWH). Although the exact proinflammatory mechanisms are unclear, interventions that reduce inflammation and immune activation are believed to reduce morbidity and mortality and may also reduce cardiometabolic complications and cardiovascular disease risk in PLWH.
Dipeptidyl peptidase-4 inhibitors (DPP4i; eg, sitagliptin, alogliptin, saxagliptin, linagliptin) are a relatively new class of oral antidiabetes medications. In animal models and clinical studies of T2D, DPP4i appear to have many beneficial cardiometabolic, anti-inflammatory, immunoregulatory, and hematopoietic effects [1–8] in addition to their glucoregulatory actions.
In single-center pilot studies that enrolled a relatively small number of participants with controlled HIV infection but without T2D, sitagliptin did not adversely affect plasma HIV RNA or CD4 T-cell counts [9], and it improved select soluble inflammatory biomarkers [10]. These pilot studies did not select for participants with low baseline CD4+ T-cell counts (<350 cells/µL), or elevated levels of proinflammatory biomarkers, that is, those that could benefit most from the potential immunoregulatory or anti-inflammatory actions of DPP4i. Also, the pilot studies did not control for the use of lipid-lowering medications (eg, statins) that are reported to have anti-inflammatory properties in PLWH. To overcome these limitations, the current randomized, double-blinded, placebo-controlled multicenter trial tested whether 16 weeks of sitagliptin (100 mg/day; Januvia) reduces inflammatory biomarkers and immune cell surface activation markers in PLWH on antiretroviral therapy (ART) who were stratified by baseline CD4+ T-cell count and statin use. The primary hypothesis was that sitagliptin will reduce soluble CD14 concentrations (sCD14; a marker of monocyte activation). Secondary hypotheses were that sitagliptin will (1) reduce circulating levels of other soluble markers of inflammation; (2) reduce T-cell and monocyte immune activation markers and increase the CD4+/CD8+ ratio; and (3) not be associated with significantly more grade 3 or 4 events than placebo.
MATERIALS AND METHODS
Participants
PLWH aged 18 years or older with a CD4+ count ≥100 cells/μL were eligible if they had ≥48 weeks of continuous ART with HIV viral suppression prior to study entry, no ART regimen changes within the prior 12 weeks, and HIV-1 RNA below the limit of detection. ART interruption of ≤7 consecutive days during that period was allowed. Single HIV-1 RNA measurements between the assay quantification limit and 500 copies/mL were allowed if the preceding and subsequent determinations were below the level of quantification. Entry laboratory criteria included hemoglobin A1C ≤6.5%, platelets ≥50 000/μL, absolute neutrophil count ≥750/μL, hemoglobin ≥8.0 g/dL, liver aminotransferases ≤5 times the upper limit of normal, and estimated creatinine clearance ≥60 mL/minute (Cockcroft-Gault formula). Participants on statin therapy were required to be taking the same dose for at least the prior 12 weeks with no anticipated change in statin or dose during the study. Exclusion criteria included a diagnosis of T2D or congestive heart failure, a history of pancreatitis, current hepatitis C virus infection with detectable hepatitis C RNA, current hepatitis B virus infection with detectable hepatitis B DNA or surface antigen, known intolerance of the study medication, severe substance abuse, active opportunistic infection, or other acute illness. Institutional review boards at each site approved the study. All participants provided written informed consent.
Randomization and Drug Treatment
Participants were randomized at a 1:1 ratio (sitagliptin:placebo) using permuted blocks without institutional balancing with stratification by statin use and screening CD4+ T-cell count (100–350 vs >350 cells/μL). Sitagliptin (Januvia) 100 mg tablets and matching placebo were supplied by Merck Pharmaceuticals. Study drug was taken as 1 tablet daily for 16 weeks.
Evaluations
At a preentry visit, plasma samples were obtained for sCD14, ≤7 days prior to the entry visit. At study entry and at weeks 8 and 15, samples were obtained for sCD14 and other soluble markers of activation and inflammation, along with safety laboratory tests, and peripheral blood mononuclear cells (PBMCs) for lymphocyte and monocyte phenotyping. At week 16, repeat samples were obtained for sCD14. Samples were obtained for fasting metabolic testing and CD4/CD8 counts at entry and week 15. Sample collection was delayed by at least 7 days after any acute inflammatory condition, severe illness, or vaccination, or if a participant had a temperature >38°C at the research visit.
Primary adverse events for this study included events that meet the International Council for Harmonisation definitions for a serious adverse event; postentry, new signs/symptoms and laboratory abnormalities of grade ≥2 or that lead to a change in treatment, regardless of grade; and any diagnoses.
Assays
Centrally performed assays used specimens stored at –70°C and shipped on dry ice. Plasma glucose, liver aminotransferase, and hemoglobin A1C concentrations were measured locally at sites. Serum insulin concentration was measured in batch by an enzyme-labeled immunometric assay (DPC Immulite 2000, Quest Diagnostics, Baltimore, Maryland). Total cholesterol, high-density lipoprotein cholesterol (HDL-C), and triglycerides were measured enzymatically. Low-density lipoprotein cholesterol (LDL-C) was calculated by the Friedewald equation when triglycerides were <400 mg/dL. Non-HDL cholesterol was calculated as total cholesterol minus HDL cholesterol. Soluble CD14, high-sensitivity C-reactive protein, CXCL10 (also known as interferon gamma-inducible protein 10 [IP-10]), soluble CD163, soluble tumor necrosis factor receptors 1 and 2, and soluble CD26 protein were measured in batch analysis by enzyme-linked immunosorbent assay (R&D Systems) at Rush University.
Lymphocyte and monocyte activation markers were quantified by flow cytometry on PBMCs that were processed and frozen at sites using a standard protocol [11, 12] at Rush University. The percentage of CD4+ and CD8+ lymphocytes expressing both activation markers CD38 and HLA-DR were reported. The percentage of CD14+CD16– (classical), CD14+CD16+ (intermediate), and CD14dimCD16++ (nonclassical) monocyte subpopulations were quantified.
Statistical Analysis
The primary hypothesis was that treatment of PLWH with suppressed HIV infection with the DPP-4 inhibitor sitagliptin will result in an anti-inflammatory effect, as assessed by reduction in circulating concentration in the monocyte activation marker sCD14 over 16 weeks, as compared to placebo. The primary outcome measure was change in sCD14 from baseline to week 16. To reduce variability, the sCD14 results from the preentry and entry visits were averaged for the baseline value, and the week 15 and 16 sCD14 results were averaged for the week 16 outcome. The target of 72 evaluable participants (36 per arm) was chosen to provide 90% power to detect a clinically relevant difference of 0.07 log10 (15%) in the change in sCD14 levels between arms. The preplanned primary analysis and secondary analyses for immunology outcomes were per-protocol and limited to participants who completed study treatment and had complete data. A per-protocol analysis was chosen to best confirm a positive biologic effect of the intervention and thus potentially justify more advanced-phase studies of sitagliptin in this clinical setting. The primary analysis used linear regression models to evaluate the treatment effect, adjusted for the stratification factors screening CD4+ T-cell count (100–350 vs >350 cells/μL) and statin use (yes/no). Stratified Wilcoxon rank-sum exact tests were used to evaluate treatment group differences in primary and secondary outcomes, also stratified by screening CD4+ T-cell count (100–350 vs >350 cells/μL) and statin use. Spearman correlations evaluated the associations between pairs of continuous variables. All statistical tests are 2-sided with a nominal α level of .05. No adjustment for multiple testing was performed.
RESULTS
Participant flow through the study is shown in Figure 1. One hundred thirty individuals were screened for participation. The most common reason for not enrolling was a laboratory value that did not meet entry criteria. Ninety participants were randomized (45 sitagliptin, 45 placebo). Only 3 participants from each group were not included in the per-protocol analysis.
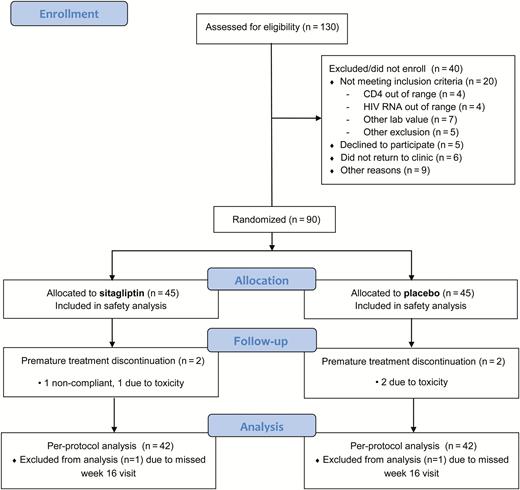
Consolidated Standards of Reporting Trials (CONSORT) participant flowchart. Abbreviation: HIV, human immunodeficiency virus.
Demographics and baseline characteristics of the per-protocol, primary analysis population (42 sitagliptin, 42 placebo) are shown in Table 1. The majority were men (82%) and either non-Hispanic white (45%) or non-Hispanic black (38%). The treatment groups were evenly distributed with respect to ART duration, type, and abacavir use. Statin use at baseline (a stratification factor) was 33% in the sitagliptin group and 31% in the placebo group. Median CD4 cells counts tended to be high overall (641 cells/μL sitagliptin, 551 cells/μL placebo), but 10 (24%) in the sitagliptin group and 13 (31%) in the placebo group had a CD4 count between 100 and 350 cells/μL.
Demographics and Baseline Characteristics: per-protocol, Primary Analysis Population
| Characteristic | Sitagliptin (n = 42) | Placebo (n = 42) |
|---|---|---|
| Age, y, median (IQR) | 52 (40–55) | 51 (45–56) |
| Male sex | 37 (88) | 33 (79) |
| Race/ethnicity | ||
| Hispanic (regardless of race) | 6 (14) | 7 (17) |
| White non-Hispanic | 22 (52) | 16 (38) |
| Black non-Hispanic | 14 (33) | 18 (43) |
| >1 race | 0 (0) | 1 (2) |
| BMI, kg/m2, median (IQR) | 27.7 (25.4–30.8) | 27.7 (23.6–30.6) |
| Months on current ART, median (IQR) | 37 (18–94) | 27 (12–79) |
| ART | ||
| Integrase inhibitor | 16 (38) | 17 (40) |
| Protease inhibitor | 15 (36) | 12 (29) |
| NNRTI | 17 (40) | 19 (45) |
| NRTI | 41 (98) | 40 (95) |
| Abacavir | 7 (17) | 7 (17) |
| Statin use | 14 (33) | 13 (31) |
| CD4+ count, cells/μL, median (IQR) | 641 (351–806) | 551 (317–816) |
| CD4+ count ≤350 cells/μL | 10 (24) | 13 (31) |
| Hemoglobin, g/dL, median (IQR) | 14.5 (13.2–15.3) | 14.4 (13.1–15.1) |
| Hemoglobin A1C, % | 5.5 (5.3–5.7) | 5.5 (5.1–5.7) |
| Total cholesterol, mg/dL, median (IQR) | 180 (157–208) | 172 (157–201) |
| Fasting insulin, μIU/mL, median (IQR) | 8.5 (5.1–12.1) | 8.0 (5.2–13.0) |
Abbreviations: ART, antiretroviral therapy; BMI, body mass index; IQR, interquartile range; NNRTI, nonnucleoside reverse transcriptase inhibitor; NRTI, nucleoside reverse transcriptase inhibitor.
Results for soluble markers of inflammation and activation are shown in Figure 2. For the primary endpoint sCD14 (Figure 2A), there was no significant difference in the change from baseline to week 15–16, with an estimated sitagliptin treatment effect of 2% (95% confidence interval [CI], –7% to 12%; P = .69 from regression model comparing week 16 changes between arms, adjusting for screening CD4 stratum and statin use). There was also no difference in the estimated treatment effect by tertiles of baseline sCD14. Of the remaining soluble markers tested, a significant difference between the 2 treatment groups in changes from baseline to week 15 was detected only for CXCL10 (Figure 2B). With sitagliptin, CXCL10 levels fell by a median of 50.5% from baseline to week 15 (interquartile range [IQR], –60.1 to –28.9) and increased by a median of 70.6% during the posttreatment phase (IQR, 48.0–149.5). Relative to placebo, the sitagliptin arm had an estimated effect of 47% greater decline in CXCL10 (95% CI, –57 to –35) at week 15 (between-arm P < .001, regression model adjusting for screening CD4 stratum and statin use). At week 20, 4 weeks after cessation of sitagliptin, levels of CXCL10 returned to near-baseline levels and were not significantly different than placebo. There were no significant correlations between the week 15–16 changes in the levels of CXCL10 and the week 15 changes of any other soluble biomarker (data not shown).
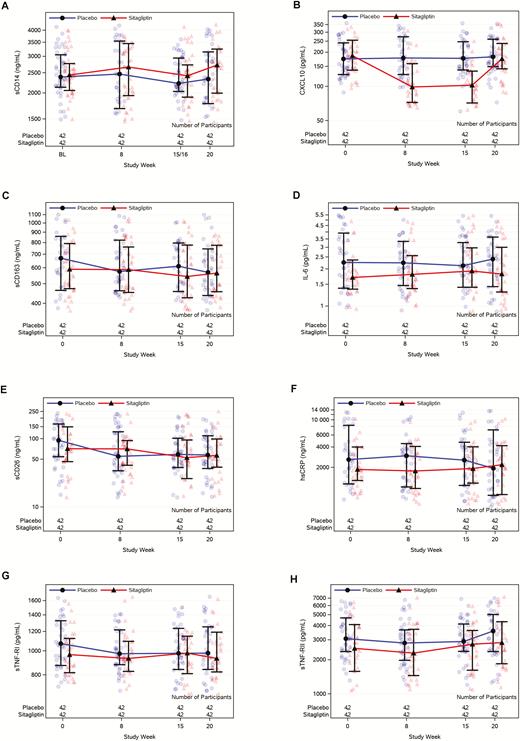
Soluble biomarkers over time. A, sCD14. B, CXCL10. C, sCD163. D, IL-6. E, sCD26. F, hsCRP. G, sTNF-RI. H, sTNF-RII. Abbreviations: BL, baseline; hsCPR, high-sensitivity C-reactive protein; IL-6, interleukin 6; sCD14, soluble CD14; sCD26, soluble CD26; sCD163, soluble CD163; sTNF-RI, soluble tumor necrosis factor receptor I; sTNF-RII, soluble tumor necrosis factor receptor II.
Results for lymphocyte and monocyte activation markers are shown in Table 2. Lymphocyte activation tended to be low at baseline for this group of individuals with suppressed HIV infection. There were no differences in change from baseline to week 15 between the 2 treatment arms in any of the cellular markers (all P > .30), nor were there any significant within-arm changes.
Lymphocyte and Monocyte Activation Markers
| Marker | Baseline | Week 15 | Absolute Change | P Valuea |
|---|---|---|---|---|
| % CD4+CD38+/HLA-DR+ | ||||
| Sitagliptin | 2.60 (2.02–3.62) | 2.75 (2.11–4.05) | 0.12 (–0.15 to 0.52) | .77 |
| Placebo | 2.48 (2.00–3.68) | 2.46 (1.99–4.19) | 0.08 (–0.41 to 0.43) | |
| % CD8+CD38+/HLA-DR+ | ||||
| Sitagliptin | 5.16 (3.89–7.70) | 6.63 (4.08–8.62) | 0.03 (–0.90 to 1.83) | .67 |
| Placebo | 6.59 (4.56–8.99) | 6.65 (4.13–10.30) | –0.27 (–1.11 to 1.33) | |
| % CD3–CD14+/CD16+ | ||||
| Sitagliptin | 80.60 (76.00–83.40) | 79.30 (72.00–82.90) | –2.30 (–6.20 to 3.20) | .51 |
| Placebo | 80.55 (72.10–86.60) | 79.95 (72.10–85.80) | –0.80 (–4.75 to 2.75) | |
| % CD3–CD14+/CD16+ | ||||
| Sitagliptin | 4.49 (3.00–7.39) | 5.25 (3.22–9.19) | 0.87 (–1.32 to 3.08) | .46 |
| Placebo | 5.94 (3.00–9.01) | 4.55 (2.89–7.65) | –0.12 (–2.33 to 1.97) | |
| % CD3–CD14dim/CD16++ | ||||
| Sitagliptin | 5.84 (4.01–9.89) | 6.18 (4.70–9.61) | 0.31 (–1.02 to 2.05) | .36 |
| Placebo | 5.32 (3.26–8.17) | 6.00 (2.94–9.18) | –0.03 (–2.08 to 2.31) |
All values are presented as median (interquartile range).
aStratified Wilcoxon rank-sum P value evaluating the difference in absolute changes between the 2 treatment groups, stratified by screening CD4 count (100–350 or >350 cells/μL) and statin use.
Metabolic, renal, and hepatic variables are listed in Table 3. There were no differences in change from baseline to week 15 between the 2 treatment arms in any of these measures (P > .40).
Fasting Metabolic, Liver, and Renal Variables
| Variable | Baseline | Absolute Change at Week 15 | P Valuea |
|---|---|---|---|
| Total cholesterol, mg/dL | |||
| Sitagliptin | 180 (157–208) | 1 (–14 to 14) | .842 |
| Placebo | 172 (157–201) | 6 (–11 to 11) | |
| HDL cholesterol, mg/dL | |||
| Sitagliptin | 46 (38–57) | –1 (–3 to 3) | .915 |
| Placebo | 50 (43–58) | 0 (–6 to 5) | |
| LDL cholesterol–calculated, mg/dL | |||
| Sitagliptin | 108 (88–121) | –4 (–14 to 10) | .495 |
| Placebo | 94 (78–118) | 2 (–15 to 12) | |
| Triglycerides, mg/dL | |||
| Sitagliptin | 109 (75–178) | 5 (–20 to 20) | .416 |
| Placebo | 104 (76–156) | –4 (–18 to 18) | |
| Non-HDL cholesterol, mg/dL | |||
| Sitagliptin | 124 (108–167) | 0 (–12 to 12) | .895 |
| Placebo | 128 (93–141) | 2 (–16 to 9) | |
| Serum insulin, μIU/mL | |||
| Sitagliptin | 8.5 (5.1–12.1) | 0.2 (–1.8 to 1.9) | .868 |
| Placebo | 8.0 (5.2–13.0) | 0.0 (–2.5 to 2.5) | |
| AST, × ULN | |||
| Sitagliptin | 0.60 (0.51–0.80) | –0.05 (–0.13 to 0.06) | .816 |
| Placebo | 0.62 (0.52–0.73) | –0.04 (–0.11 to 0.01) | |
| ALT, × ULN | |||
| Sitagliptin | 0.58 (0.33–0.75) | 0.00 (–0.11 to 0.06) | .818 |
| Placebo | 0.53 (0.43–0.70) | –0.04 (–0.10 to 0.05) | |
| Calculated CrClb, mL/min | |||
| Sitagliptin | 106 (92–122) | –3 (–7 to 7) | 0.506 |
| Placebo | 105 (79–124) | –3 (–10 to 4) |
All values are presented as median (interquartile range).
Abbreviations: ALT, alanine aminotransferase; AST, aspartate aminotransferase; CrCl, creatinine clearance; HDL, high-density lipoprotein; LDL, low-density lipoprotein; ULN, upper limit of normal.
aStratified Wilcoxon rank-sum P value evaluating the difference in absolute changes between the 2 treatment groups, stratified by screening CD4 count (100–350 or >350 cells/μL) and statin use.
bCockcroft-Gault estimation.
Sitagliptin was generally well tolerated. Of 90 enrolled participants in the safety analysis, 42 (47%) reported at least 1 primary adverse event, 22 (49%) from the sitagliptin arm and 20 (44%) from the placebo arm. The proportion of participants with grade 3 or grade 4 primary adverse events was 11% for the sitagliptin arm compared to 16% for the placebo arm. Only 1 participant (in the sitagliptin arm) reported a grade 4 primary adverse event. This participant had a grade 4 myocardial infarction at week 11 that was assessed as not related to the study treatment by the site investigator. Study treatment was completed, and this participant was included in the per-protocol analysis. Because this event occurred 4–5 weeks prior to the primary endpoint evaluations, it is unlikely that it influenced the results. There were 3 participants whose primary adverse events were determined by the site investigators as possibly related to study treatment, all from the sitagliptin arm: 1 had a grade 3 low creatinine clearance at week 8, 1 had grade 3 elevated triglycerides at week 15, and 1 had a grade 2 rash at week 15. There were no grade 2 or higher low blood glucose values reported during the course of this study. No deaths were reported.
DISCUSSION
Sixteen weeks of the DPP-4 inhibitor sitagliptin had no effect on the primary endpoint measure sCD14, a soluble marker of monocyte activation, when administered to participants with treated and suppressed HIV infection. There was a large and statistically significant fall in CXCL10 with sitagliptin, a chemokine that is implicated in cardiovascular disease and atherogenesis [13] and distal sensorimotor polyneuropathy [14], and predicts non-AIDS events in participants on ART [12]. However, no significant changes in other soluble or cellular markers of inflammation and activation were detected.
The primary endpoint of changes in sCD14 was chosen because levels of this circulating marker of monocyte activation have shown strong association with mortality and morbidity in cohort studies during ART [12, 15, 16] as well as with key HIV comorbidities [17–23]. Longitudinal data from the Multicenter AIDS Cohort Study [24] suggest that, among multiple inflammatory biomarkers measured (including CXCL10, interleukin 6, and C-reactive protein), sCD14 fulfills multiple criteria for a highly relevant soluble biomarker. Specifically, sCD14 was higher in both untreated and virologically suppressed HIV infection compared with controls, did not normalize with effective ART, and predicted mortality across the range of untreated to long-term treated HIV infection; in addition, changes in sCD14 after ART initiation predicted mortality. To date, no anti-inflammatory intervention tested in individuals with treated HIV has been shown to favorably affect sCD14 concentrations, with the notable exceptions of rosuvastatin [25] and pitavastatin [26]. Despite being well powered, we found no signal for improvement in the biomarker with 16 weeks of sitagliptin. It is possible that our participants, who were largely well with good immune reconstitution (median CD4 count, 586 cells/μL), had limited room for improvement in sCD14. However, there was no suggestion of any differential treatment effects by entry sCD14 tertile in secondary analyses. Similarly, compared to other populations of treated and suppressed HIV infection [25, 27, 28], our participants had relatively lower levels of lymphocyte activation, likely limiting the ability to detect changes in this outcome.
There was a marked effect of sitagliptin treatment on the inflammatory chemokine CXCL10, which decreased by a median of approximately 50% in the sitagliptin arm and promptly returned to baseline levels 4 weeks after drug discontinuation. Smaller, but nonetheless significant decreases in CXCL10 levels were seen in a smaller study of 8 weeks of sitagliptin in participants with HIV and impaired glucose tolerance [10]. CXCL10 was increased in untreated HIV infection, and its levels correlated with viral replication and more rapid CD4 cell decline [29]. CXCL10 levels remained significantly elevated even after successful ART [29], and on-treatment levels predicted non-AIDS events on ART [12]. CXCL10 levels decreased with rosuvastatin therapy in treated HIV infection [25]. Moreover, CXCL10 is a ligand for CXCR3, which is expressed in immune cells of atherosclerotic plaque [30] and is involved in atherogenesis [13]. CXCL10 promotes T-cell adhesion to endothelial cells during atheroma formation [31]. Thus, it is plausible that reduced CXCR3 signaling mediated by a sizable drug-induced decrease in CXCL10 levels may have beneficial cardiovascular and virologic effects in treated HIV infection. With the prompt return to baseline levels after discontinuation of sitagliptin, it would be expected that this intervention would require long-term use to maintain a benefit. Further study is needed to explore this hypothesis.
CXCL10 is a substrate for DPP-4, and DPP-4 inhibition with sitagliptin is known to affect the relative levels of different CXCL10 isoforms [32] with minimal impact on total levels of the chemokine in healthy participants. Moreover, the biology of CXCR3-induced signaling is complex, with multiple ligands and CXCR3 isoforms [33]. More work is needed to evaluate the functional implications at the cellular level of sitagliptin-induced reductions in CXCL10 levels.
Our study has several limitations. Mostly men were enrolled, limiting generalizability of our results to women. Participants were largely well, with good immune reconstitution and low levels of lymphocyte activation. It is possible that individuals with lower CD4 counts may benefit more from sitagliptin, but we found no evidence for this in our secondary analyses. Similarly, no evidence was found for a differential effect with higher baseline levels of sCD14. Due to the number of variables examined, it is possible that the CXCL10 results were due to chance. However, this seems very unlikely for multiple reasons. First, the magnitude of the difference was large, approximately 50%, and highly statistically significant. Although we did not perform statistical comparisons for the week 8 changes, there was a very similar fall in CXCL10 at week 8 (Figure 2B). Last, there was a prompt and clear return to near-baseline levels of CXCL10 4 weeks after sitagliptin discontinuation.
In conclusion, in treated and suppressed HIV infection, 16 weeks of sitagliptin was well tolerated and had a major impact on the proinflammatory chemokine CXCL10, but no effect on other soluble and cellular markers thought to contribute to HIV-related comorbidities and mortality including the primary endpoint sCD14. More work is needed to determine the implications of these findings.
Notes
Acknowledgments. The authors are indebted to the study participants, without whom this project would not have been possible. Protocol support was provided by Linda Boone, BS. Karin L. Klingman, MD, provided oversight from the Division of AIDS. Data management was overseen by Dave H. Rusin, MT, Allison Reading, and Kaitely Wozer. Sadia Shaik, MD (Harbor–University of California, Los Angeles Medical Center Clinical Research Site [CRS]) and Todd Stroberg, RN (Cornell Clinical Trials Unit [CTU]) served as AIDS Clinical Trials Group (ACTG) field representatives. Paris Mullen, BA, University of Washington AIDS CTU, served as the community scientific subcommittee representative for this protocol.
Disclaimer. The opinions expressed in this article are those of the authors and do not necessarily represent those of Merck Sharp & Dohme. The content is solely the responsibility of the authors and does not necessarily represent the official views of the National Institutes of Health (NIH).
Financial support. Research reported in this publication was supported by the National Institute of Allergy and Infectious Diseases (NIAID) of the NIH (award numbers UM1 AI068634, UM1 AI068636, and UM1 AI106701). From the sites, the authors acknowledge the following personnel and AIDS CTU grants: Chapel Hill CRS (site 3201), UM1 5UM1AI068636-12 and P30 AI50410—Donna Pittard, RN and Nazneen Howerton; Case Western CRS (site 2501), AI69501—Julie Pasternak, BSN, MBA, RN and Jane Baum, BSN, RN, CCRP; University of Southern California CRS (site 1201), 5 U01 AI069428 and 5 UM1 AI069432; University of Pittsburgh (site 1001), UM1AI069494—Sara Onesi, RN, BSN and Renee Weinman, MPPM; Cincinnati CRS (site 2401), UM1AI068636—Jenifer Baer, RN, BSN and Carl J. Fichtenbaum, MD; University of Rochester Adult HIV Therapeutic Strategies Network CRS (site 31787); Philadelphia HIV Therapeutics and Prevention CTU (site 6201), UM1AI068636 and UM1AI069534—Mark Bardsley, BSN and Deborah Kim, RPh; Greensboro CRS (site 3203), 5UM1 A1068636-12 and UM1 A1069423-13—Cornelius N. Van Dam, MD and Kimberly Epperson; Washington University (site 2101), UM1-AI069439—Michael Klebert and Teresa Spitz; Ohio State University (site 2301), UM1AI069494—Dr Susan Koletar and Leah Kofmehl; Columbia Physicians and Surgeons CRS (site 30329), UM1 AI069470 and UL1TR001873—Brett Gray and Jolene Noel-Connor; Houston AIDS Research Team (site 31473), 5 UM1 AI069503 and 5 UM1 AI068636—Roberto C. Arduino, MD and Maria Laura Martinez, BS; Whitman Walker Health CRS (site 31791), UM1 AI069465-08—W. David Hardy, MD and Lynsay MacLaren, MPH, MPAS, PA-C; Harbor University of California Los Angeles Center CRS (site 603), UM1 AI069424-08; Weill Cornell Chelsea CRS (site 7804), UM1AI069419 and UL1TR000457—Todd Stroberg, RN and Tiina Ilmet, MA.
Potential conflicts of interest. This work was supported in part by a research grant from the Investigator-Initiated Studies Program of Merck Sharp & Dohme Corporation, which provided study drug and placebo. M. P. D. has served as a consultant to Gilead and Thera and receives research support through his university from Gilead, Merck, and ViiV. J. E. L. has served as a consultant to Merck and Gilead Sciences, and receives research support through her university from Gilead Sciences. H. J. R. has received grants from the NIH (NIAID; National Heart, Lung, and Blood Institute; National Institute of Diabetes and Digestive and Kidney Diseases; and National Institute of Nursing Research). All other authors report no potential conflicts. All authors have submitted the ICMJE Form for Disclosure of Potential Conflicts of Interest. Conflicts that the editors consider relevant to the content of the manuscript have been disclosed.

