


Abstract
More data are needed about the safety of antibiotic de-escalation in specific clinical situations as a strategy to reduce exposure to broad-spectrum antibiotics. The aims of this study were to investigate predictors of de-escalation and its impact on the outcome of patients with bloodstream infection due to Enterobacteriaceae (BSI-E).
A post hoc analysis was performed on a prospective, multicenter cohort of patients with BSI-E initially treated with ertapenem or antipseudomonal β-lactams. Logistic regression was used to analyze factors associated with early de-escalation (EDE) and Cox regression for the impact of EDE and late de-escalation (LDE) on 30-day all-cause mortality. A propensity score (PS) for EDE vs no de-escalation (NDE) was calculated. Failure at end of treatment and length of hospital stay were also analyzed.
Overall, 516 patients were included. EDE was performed in 241 patients (46%), LDE in 95 (18%), and NDE in 180 (35%). Variables independently associated with a lower probability of EDE were multidrug-resistant isolates (odds ratio [OR], 0.50 [95% confidence interval {CI}, .30–.83]) and nosocomial infection empirically treated with imipenem or meropenem (OR, 0.35 [95% CI, .14–.87]). After controlling for confounders, EDE was not associated with increased risk of mortality; hazard ratios (HR) (95% CIs) were as follows: general model, 0.58 (.25–1.31); model with PS, 0.69 (.29–1.65); and PS-based matched pairs, 0.98 (.76–1.26). LDE was not associated with mortality. De-escalation was not associated with clinical failure or length of hospital stay.
De-escalation in patients with monomicrobial bacteremia due to Enterobacteriaceae was not associated with a detrimental impact on clinical outcome.
Patients with sepsis are frequently treated empirically with broad-spectrum drugs (BSDs) because the early administration of active drugs has been associated with improved outcome, particularly in the presence of septic shock [1]. This can lead to overuse of these drugs, which is usually considered to be one of the contributing factors for the spread of multidrug-resistant (MDR) bacteria [2]. To minimize this problem, streamlining or de-escalation from broad- to narrower-spectrum drugs is usually advocated once the susceptibility of the causative agent of the infection is known, and antimicrobial stewardship programs frequently include interventions facilitating or recommending this practice [3]. However, de-escalation is performed less frequently than is desirable. Barriers include uncertainty among many prescribers; indeed, although de-escalation is considered standard of care for most infectious disease specialists, a recent systematic review concluded that there is no adequate evidence as to whether de-escalation of antimicrobial agents is effective and safe for adults with sepsis [4]. Hence, providing more information about the safety of de-escalation would help increase implementation, and knowledge of the variables influencing the performance of de-escalation would lead to better targeting of interventions promoting this practice.
Bloodstream infections (BSIs) are an ideal model for de-escalation, as etiology and susceptibility are known and a more specialized evaluation of patients is possible [5]. A meta-analysis including studies of sepsis, bacteremia, and pneumonia found a trend toward higher mortality with de-escalation in 3 randomized trials, but lower mortality in observational studies [6]. However, the studies were heterogeneous with respect to type of patient and infection, etiology, definitions used, and interventions, which precludes high confidence in the meta-analytic estimates. Studies of specific populations and etiologies are needed therefore. A randomized trial of patients with bacteremia due to Enterobacteriaceae is now recruiting [7], although the results will not be available for 2 years. The objectives of this study were to evaluate the frequency of variables associated with de-escalation, and the impact of de-escalation on prognosis only among patients with bacteremia due to Enterobacteriaceae.
METHODS
Study Design, Sites, and Study Population
This is a post hoc analysis of the prospective Bactaeremia-MIC (minimum inhibitory concentration) cohort, which included BSI episodes due to Enterobacteriaceae at 13 university hospitals in Spain. The methods are detailed in previous reports [8, 9]. In brief, consecutive adult patients with monomicrobial bacteremia due to Enterobacteriaceae who received empirical treatment in the first 12 hours after the blood cultures were drawn were included. The original study was conducted between January 2011 and December 2013. Exclusion criteria were polymicrobial bacteremia, nonhospitalized patients, do-not-resuscitate orders, neutropenia (<500 cells/µL), and survival <24 hours after blood cultures were drawn. For this analysis, patients from the Bacteraemia-MIC cohort were selected if (1) initial treatment was monotherapy with an in vitro active BSD, including antipseudomonal β-lactams such as meropenem, imipenem, doripenem, ceftazidime, cefepime or piperacillin-tazobactam, and ertapenem; and (2) the causative microorganism was susceptible to any of the following narrower-spectrum drugs (NSD): ampicillin, amoxicillin-clavulanic acid, nonantipseudomonal cephalosporins such as cefazolin, cefuroxime, cefotaxime or ceftriaxone, trimethoprim-sulfamethoxazole, aminoglycosides, fosfomycin, and fluoroquinolones. The classification of antibiotics as BSD or NSD was based on a previously published consensus ranking of β-lactams according to spectrum and resistance-promoting potential [10]. Exclusion criteria were treatment change to another broader-spectrum drug between days 2 and 5 (as we were unable to rule out patients having secondary infections that would overestimate the comparative efficacy of NSD) and death before the susceptibility tests were available (as these patients did not have the opportunity to de-escalate). All patients were followed for 30 days.
The Institutional Review Board of the University Hospital Virgen Macarena, Sevilla, Spain, approved the study and waived the need to obtain informed consent due to the observational nature of the study. This analysis was reported according to Strengthening the Reporting of Observational Studies in Epidemiology (STROBE) recommendations (Supplementary Table 1) [11].
Variables and Definitions
The main outcome variable was 30-day all-cause mortality. Secondary outcomes were clinical response at day 21, and length of hospital stay among survivors. Clinical response was classified as clinical cure if all signs and symptoms of infection had been completely resolved, and failure if there were any persistent, recurrent, or new signs and symptoms related to infection, or if death occurred.
The main exposure of interest was de-escalation, defined as switching from the empirical BSD to any of the NSDs, or from piperacillin-tazobactam, imipenem, or meropenem to ertapenem. De-escalation was classified as early de-escalation (EDE) if performed within ≤4 days (the day when blood cultures were drawn was considered day 0); late de-escalation (LDE) if performedfrom day 5 to day 7; or non-de-escalation (NDE) if the empirical drug was continued for at least ≥7 days.
Other exposure variables included demographic data, type of onset of infection (nosocomial, healthcare-associated, or community), chronic underlying conditions, and severity according to the Charlson index [12]; acute severity of underlying condition according to Pitt score [13] measured on day –1; Sequential Organ Failure Assessment (SOFA) score measured on day 0 [14]; severe sepsis or septic shock at day 0 [15]; source of infection using Centers for Disease Control and Prevention criteria [16]; and microorganism.
All isolates were sent to the Hospital Universitario Virgen Macarena, where identification was confirmed and susceptibility to antimicrobials was studied using microdilution and interpreted according to European Committee on Antimicrobial Susceptibility Testing breakpoints [17]. Extended-spectrum beta-lactamase (ESBL), AmpC, and carbapenemase production were studied by phenotypic methods, followed by polymerase chain reaction amplification and molecular sequencing. For the sake of simplicity, isolates producing ESBLs, AmpC, or carbapenem resistance were considered as MDR.
Statistical Analysis
The χ2 test or Fisher exact test was used to compare categorical variables. The Mann–Whitney U test was used to compare continuous variables. When appropriate, continuous variables were dichotomized according to their association with death, using classification and regression tree analysis. Multivariate Cox regression analysis was used to analyze the impact of EDE and LDE on 30-day mortality. Logistic regression and linear regression were used to identify the impact of EDE and LDE on failure and length of hospital stay among survivors, respectively. Variables with a P value <.2 in univariate comparisons and those considered of clinical importance were entered into the multivariate model. The variables in the models were selected manually using a backward stepwise process. Interactions and collinearity were evaluated. Sensitivity analyses were performed by reclassifying the main exposure as EDE vs LDE + NDE, and as EDE + LDE vs NDE.
In addition, a propensity score (PS) was calculated for receiving EDE instead of NDE. Its predictive ability was calculated using the area under the receiver operating characteristic curve (AUROC) with 95% confidence interval (CI), and the Hosmer-Lemeshow test was used for goodness of fit. The PS was used in 2 ways: as a covariate to control for residual confounding in multivariate models after checking for collinearity, and to perform a matched cohort analysis in which patients undergoing EDE and NDE were matched (1:1) according to their PSs using calipers of width 0.007. Statistical analysis was carried out using SPSS software (SPSS 25.0, IBM Corp, Armonk, New York).
RESULTS
The Bacteraemia-MIC cohort included 1058 patients with BSI due to Enterobacteriaceae; of these, 516 (48.7%) patients fulfilled the criteria for the de-escalation analysis (Figure 1). The number of patients per hospital ranged from 8 (1.6%) to 69 (13.4%). Overall, 241 (46.7%) patients received EDE, 95 (18.4%) received LDE, and 180 (34.8%) were not de-escalated. The proportion of EDE among hospitals with >20 cases ranged from 13% to 75.4%. The patients’ characteristics are shown in Table 1. Compared to patients who underwent EDE, those in the NDE group more frequently had nosocomial infections, had been admitted to the intensive care unit, had respiratory tract infections, and received empiric therapy with meropenem. Overall, 70 (13.6%) isolates were ESBL producers, 26 (5.1%) AmpC producers, and 3 (0.6%) were carbapenem resistant (none were carbapenemase producers). Among patients undergoing de-escalation, the most frequent empirical drugs were piperacillin-tazobactam and imipenem or meropenem, and the most frequent drugs used for de-escalation were fluoroquinolones (68 patients in EDE and 38 in LDE), cefotaxime or ceftriaxone (92 and 20 patients), and amoxicillin-clavulanic acid (43 and 26 patients) (Supplementary Table 2).
Features of Patients With Bacteremia due to Enterobacteriaceae According to De-escalation Group
| Variable | EDE (n = 241) | LDE (n = 95) | NDE (n = 180) | P Value (Early vs NDE) | P Value (Late vs NDE) |
|---|---|---|---|---|---|
| High-mortality hospital | 81 (33.6) | 31 (32.6) | 69 (38.3) | .31 | .35 |
| Etiology: Escherichia coli | 164 (68) | 60 (63.2) | 111 (61.7) | .17 | .80 |
| ESBL-producing Enterobacteriaceae | 26 (10.6) | 11 (11.6) | 31 (17.2) | .05 | .21 |
| AmpC-producing Enterobacteriaceae | 7 (2.9) | 3 (3.2) | 16 (8.9) | .01 | .12 |
| Carbapenem-resistant Enterobacteriaceae | 0 | 2 (2.1) | 1 (0.6) | .88 | .57 |
| MDR Enterobacteriaceaea | 33 (13.7) | 16 (16.8) | 48 (26.7) | <.001 | .06 |
| Male sex | 158 (65.6) | 64 (67.4) | 117 (65) | .90 | .69 |
| Age >60 y | 187 (77.6) | 79 (83.2) | 126 (70) | .07 | .01 |
| Nosocomial acquisition | 57 (23.7) | 23 (24.2) | 76 (42.2) | <.001 | .003 |
| ICU admission | 7 (2.9) | 1 (1.1) | 14 (7.8) | .02 | .02 |
| Previous surgery | 32 (13.3) | 14 (14.7) | 41 (22.8) | .01 | .11 |
| Previous antimicrobial therapy | 104 (43.2) | 33 (34.7) | 75 (41.7) | .76 | .26 |
| Charlson index >3 | 60 (24.9) | 17 (17.9) | 42 (23.3) | .71 | .29 |
| Source | |||||
| Urinary tract | 104 (43.2) | 30 (31.6) | 59 (32.8) | .03 | .94 |
| Biliary tract | 86 (35.7) | 39 (41.1) | 52 (28.9) | .17 | .39 |
| Other intra-abdominal source | 18 (7.5) | 15 (15.8) | 26 (14.4) | .03 | .90 |
| Skin and skin structures | 4 (1.7) | 2 (2.1) | 8 (4.4) | .16 | .51 |
| Catheter-related | 10 (4.1) | 3 (3.2) | 9 (5) | .85 | .68 |
| Respiratory tract | 5 (2.1) | 2 (2.1) | 11 (6.1) | .05 | .54 |
| Others | 2 (0.8) | 1 (1.1) | 3 (1.7) | .74 | .68 |
| Unknown source | 12 (5) | 1 (1.1) | 11 (6.1) | .77 | .10 |
| Pitt score >3 | 25 (10.4) | 3 (3.2) | 22 (12.2) | .55 | .01 |
| Severe sepsis/septic shock | 83 (34.4) | 24 (25.3) | 67 (37.2) | .55 | .04 |
| SOFA score >4 (day 0) | 59 (24.5) | 14 (14.7) | 45 (25) | .90 | .04 |
| Empirical therapy | |||||
| Piperacillin-tazobactam | 124 (51.5) | 54 (56.8) | 82 (45.6) | .27 | .09 |
| Ceftazidime | 10 (4.1) | 1 (1.1) | 6 (3.3) | .86 | .45 |
| Cefepime | 5 (2.1) | 0 | 2 (1.1) | .70 | .77 |
| Ertapenem | 37 (15.4) | 14 (14.7) | 22 (12.2) | .43 | .68 |
| Imipenem | 29 (12) | 2 (2.1) | 15 (8.3) | .28 | .07 |
| Meropenem | 36 (14.9) | 24 (25.3) | 53 (29.4) | <.001 | .55 |
| Mortality at day 30 | 10 (4.1) | 6 (6.3) | 17 (9.4) | .02 | .37 |
| Failure at the end of treatment | 11 (4.6) | 6 (6.3) | 162 (10) | .02 | .30 |
| Median hospital stay, d (IQR) | 14 (9–28) | 13 (7–20) | 15 (10–25) | .21 | .003 |
Abbreviations: EDE, early de-escalation; ESBL, extended-spectrum β-lactamase; ICU, intensive care unit; IQR, interquartile range; LDE, late de-escalation; MDR, multidrug-resistant; NDE, no de-escalation; SOFA, Sequential Organ Failure Assessment.
aMDR isolates were those producing ESBL or AmpC or that were carbapenem resistant.
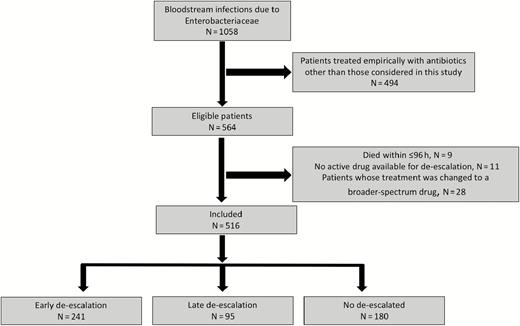
Study flowchart.
Variables Associated With EDE
The association of different variables with EDE is shown in Table 2. The variable “center” was dichotomized into low and high proportions of patients with EDE. In multivariate analysis, bacteremia caused by MDR isolates and nosocomial episodes empirically treated with imipenem or meropenem were associated with a lower probability of receiving EDE. Even after controlling for these variables, patients hospitalized in centers with a high proportion of EDE still had a higher probability of receiving EDE. The AUROC for the model was 0.72 (95% CI, .66–.75).
Analysis of the Association of Different Variables With Early De-escalation
| Variable | EDE (n = 241) | LDE or NDE (n = 275) | Crude OR (95% CI) | P Value | Adjusted OR (95% CI)a | P Value |
|---|---|---|---|---|---|---|
| Hospital with high rate of de-escalation | 131 (54.4) | 59 (21.5) | 4.36 (2.97–6.39) | <.001 | 4.34 (2.93–6.45) | <.001 |
| Etiology: Escherichia coli | 164 (68) | 171 (62.2) | 1.29 (.90–1.86) | .16 | … | … |
| MDR isolateb | 33 (13.7) | 64 (23.3) | 0.52 (.33–.83) | .006 | 0.50 (.30–.83) | .007 |
| Empirical treatment with piperacillin-tazobactam | 124 (51.5) | 136 (49.5) | 1.08 (.76–1.53) | .65 | … | … |
| Empirical treatment with ertapenem | 37 (15.4) | 36 (13.1) | 1.20 (.73–1.97) | .46 | … | … |
| Empirical treatment with imipenem or meropenem | 65 (27) | 94 (34.2) | 1.40 (.96–2.05) | .07 | 1.20 (.73–1.99) | .46 |
| Male sex | 158 (65.7) | 181 (65.8) | 0.98 (.68–1.42) | .95 | … | … |
| Age >60 y | 187 (77.6) | 205 (74.5) | 1.18 (.78–1.77) | .41 | … | … |
| Nosocomial infection | 57 (23.7) | 99 (36) | 0.55 (.37–.81) | .002 | 0.83 (.50–1.39) | .49 |
| ICU admission | 7 (2.9) | 15 (5.5) | 0.51 (.20–1.29) | .15 | … | … |
| Previous surgery | 32 (13.3) | 55 (20) | 0.61 (.38–.98) | .04 | … | … |
| Charlson index >3 | 60 (24.9) | 59 (21.5) | 1.21 (.80–1.82) | .35 | … | … |
| Urinary and biliary tract source | 190 (78.8) | 180 (65.5) | 1.96 (1.32–2.92) | <.001 | … | … |
| Pitt score >3 | 25 (10.4) | 25 (9.1) | 1.15 (.64–2.07) | .62 | … | … |
| Severe sepsis/septic shock | 83 (34.4) | 91 (33.1) | 1.06 (.73–1.53) | .74 | … | … |
| SOFA score >4 (day 0) | 59 (24.5) | 59 (21.5) | 1.18 (.78–1.79) | .41 | … | … |
| Interaction: nosocomial infection and empirical treatment with imipenem or meropenem | … | … | … | … | 0.35 (.14–.87) | .02 |
Abbreviations: CI, confidence interval; EDE, early de-escalation; ICU, intensive care unit; LDE, late de-escalation; MDR, multidrug-resistant; NDE, no de-escalation; OR, odds ratio; SOFA, Sequential Organ Failure Assessment.
aHosmer-Lemeshow test, P value = .99; area under the receiver operating characteristic curve = 0.71 (95% CI, .66–.75), P < .001.
bMDR isolates were those producing extended-spectrum β-lactamases or AmpC or that were carbapenem-resistant.
Mortality Analysis
Mortality rates were 4.1% (10/241), 6.3% (6/95), and 9.4% (17/180) in patients with EDE, LDE, and NDE, respectively (Table 1). The univariate and multivariate analysis of variables associated with 30-day mortality are shown in Table 3. Source of bacteremia was dichotomized into urinary or biliary tract vs others, according to their association with mortality. Hospitals were also classified into those with lower and higher mortality, and this variable was retained in the models. Multivariate analysis (Table 3) selected Charlson >3, source other than urinary or biliary tract, presentation with severe sepsis or shock, and SOFA >4 as associated with mortality. Among de-escalated patients, no trend toward higher mortality was found, although the model showed poor discrimination (AUROC, 0.64 [95% CI, .52–.75]). In sensitivity analysis, the adjusted HRs for mortality were 0.67 (95% CI, .33–1.36; P = .27) for EDE or LDE vs NDE, and 0.60 (95% CI, .27–1.30; P = .19) for EDE vs LDE-NDE. No significant interactions were found in either model.
Univariate and Multivariate Analyses of Risk Factors Associated With All-cause 30-Day Mortality Using Cox Regression
| Crude Analysis | Adjusted Analysisa | EDE vs NDE, Adjusted by PSb | ||||||
|---|---|---|---|---|---|---|---|---|
| Variable | Deceased (n = 33) | Alive (n = 483) | HR (95% CI) | P Value | HR (95% CI) | P Value | HR (95% CI) | P Value |
| Hospital with high mortality | 19 (57.6) | 162 (33.5) | 2.56 (1.28–5.12) | .007 | 1.68 (.80–3.53) | .16 | 1.91 (.83–4.36) | .12 |
| Etiology: Escherichia coli | 17 (51.5) | 318 (65.8) | 0.56 (.28–1.12) | .10 | … | … | … | … |
| Male sex | 22 (66.7) | 317 (65.6) | 1.05 (.51–2.17) | .88 | … | … | … | … |
| Age >60 y | 27 (81.8) | 365 (75.6) | 1.45 (.61–3.52) | .40 | … | … | … | … |
| Nosocomial acquisition | 18 (54.5) | 138 (28.6) | 2.84 (1.43–5.64) | .003 | … | … | … | … |
| ICU admission | 5 (15.2) | 17 (3.5) | 4.15 (1.60–10.76) | .003 | … | … | … | … |
| Charlson index >3 | 14 (42.4) | 105 (21.7) | 0.54 (1.27–5.07) | .008 | 3.02 (1.50–6.09) | .002 | 3.69 (1.65–8.24) | .001 |
| Urinary or biliary source | 14 (42.4) | 356 (73.7) | 0.28 (1.14–.56) | <.001 | 0.35 (.17–.74) | .006 | 0.23 (.08–.61) | .004 |
| Pitt score >3 | 10 (30.3) | 40 (8.3) | 4.33 (2.06–9.10) | <.001 | … | … | … | … |
| Severe sepsis/septic shock | 23 (69.7) | 151 (31.3) | 4.76 (2.26–10.01) | <.001 | 3.06 (1.32–7.09) | .009 | 3.29 (1.25–8.63) | .01 |
| SOFA score >4 (day 0) | 17 (51.5) | 101 (21) | 3.81 (1.92–7.54) | <.001 | 2.18 (1.03–4.57) | .03 | 2.73 (1.20–6.23) | .01 |
| Empirical meropenem | 9 (27.3) | 104 (21.5) | 1.35 (1.62–2.91) | .44 | … | … | … | … |
| De-escalation | ||||||||
| No de-escalation | 17 (51.5) | 163 (33.7) | Reference | .10 | Reference | .41 | Reference | … |
| Early de-escalation | 10 (30.3) | 231 (47.8) | 0.42 (.19–.93) | .03 | 0.58 (.25–1.31) | .19 | 0.69 (.29–1.65) | .41 |
| Late de-escalation | 6 (18.2) | 89 (18.4) | 0.65 (.25–1.66) | .37 | 0.89 (.35–2.26) | .80 | Excluded | … |
| Propensity scorec | … | … | … | … | … | … | 0.81 (.06–10.42) | .87 |
Data are presented as no. (%) unless otherwise indicated.
Abbreviations: CI, confidence interval; EDE, early de-escalation; HR, hazard ratio; ICU, intensive care unit; NDE, no de-escalation; PS, propensity score; SOFA, Sequential Organ Failure Assessment.
aThe area under the receiver operating characteristic (AUROC) curve of the model was 0.64 (95% CI, .52–.75), P = .007.
bPatients in the late de-escalation group were excluded from this analysis.
cCalculated only for patients in the early de-escalation and no de-escalation groups. The variables included in the propensity score were high-risk hospital, microorganism, sex, age, acquisition, department, Charlson index, previous antibiotic therapy, urinary and biliary source, Pitt score, SOFA score at day 0, severe sepsis and septic shock, and empirical therapy. The AUROC curve of the PS model was 0.68 (95% CI, .63–.73), P = .001, Hosmer–Lemeshow test = 0.84.
We then investigated the impact of EDE vs NDE including the PS for EDE (LDE patients were excluded from this analysis) (Table 3). No significant collinearity was found between the PS and other variables. Again, EDE did not show an association with higher 30-day mortality (adjusted hazard ratio [HR], 0.69 [95% CI, .29–1.65]; P = .41); the AUROC of this model was higher (0.72 [95% CI, .61–.82]). Finally, we matched 137 pairs of patients receiving EDE or NDE according to PS. Matched subcohorts had exposure to all other variables (Supplementary Table 3). Mortality was 5.4% (n = 7) in EDE and 7.7% in NDE (n = 10) (HR, 0.98 [95% CI, .76–1.26]; P = .84).
Clinical Cure and Length of Stay
Overall, 35 patients showed failure at the end of antibiotic treatment (6.7%): 11 of 2421 (4.6%) with EDE, 6 of 95 (6.3%) with LDE, and 18 of 180 (10%) with NDE. The univariate and multivariate analyses of variables associated with failure are shown in Table 4. The multivariate model showed that Charlson index >3, severe sepsis/septic shock at presentation, and SOFA score at day 0 were associated with higher treatment failure, while a urinary or biliary source were protective factors. De-escalation was not found to be associated with failure (Table 4).
Univariate and Multivariate Model of Variables Associated With Failure at the End of Antibiotic Treatment
| Crude analysis | Adjusted analysisa | |||||
|---|---|---|---|---|---|---|
| Variable | Failure (n = 35) | Cure (n = 481) | OR (95% CI) | P Value | OR (95% CI) | P Value |
| Hospital with high proportion of failure | 17 (48.6) | 131 (27.2) | 2.52 (1.26–5.04) | .009 | 1.70 (.78–3.70) | .17 |
| Etiology: Escherichia coli | 20 (57.1) | 315 (65.5) | 0.70 (.35–1.40) | .32 | … | … |
| Male sex | 22 (62.9) | 317 (65.9) | 0.87 (.43–1.78) | .71 | … | … |
| Age >60 y | 29 (82.9) | 363 (75.5) | 1.57 (.63–3.87) | .32 | … | … |
| Nosocomial acquisition | 17 (48.6) | 139 (28.9) | 2.32 (1.16–4.64) | .01 | … | … |
| ICU admission | 4 (11.4) | 18 (3.7) | 3.31 (1.05–10.40) | .04 | … | … |
| Charlson index >3 | 14 (40) | 105 (21.8) | 2.38 (1.17–4.85) | .01 | 2.87 (1.31–6.29) | .008 |
| Urinary or biliary tract source | 14 (40) | 356 (74) | 0.23 (.11–.47) | <.001 | 0.24 (.11–.52) | <.001 |
| Pitt score >3 | 10 (28.6) | 40 (4.3) | 4.41 (1.97–9.83) | <.001 | … | … |
| Severe sepsis/septic shock | 24 (68.6) | 150 (31.2) | 4.81 (2.29–10.08) | <.001 | 3.09 (1.27–7.50) | .01 |
| SOFA score >4 (day 0) | 19 (54.3) | 99 (20.6) | 4.58 (2.27–9.23) | <.001 | 2.76 (1.21–6.25) | .01 |
| De-escalation | ||||||
| No de-escalation | 18 (51.4) | 162 (33.7) | Reference | Reference | ||
| Early de-escalation | 11 (31.4) | 230 (47.8) | 0.43 (.19–.93) | .03 | 0.56 (.24–1.32) | .18 |
| Late de-escalation | 6 (17.1) | 89 (18.5) | 0.60 (.23–1.58) | .30 | 0.98 (.34–2.83) | .98 |
Abbreviations: CI, confidence interval; ICU, intensive care unit; OR, odds ratio; SOFA, Sequential Organ Failure Assessment.
aThe area under the receiver operating characteristic curve of this model was 0.81 (95% CI, .74–.89), P < .001, Hosmer–Lemeshow test = 0.61.
The median hospital stay after BSI was 14 (interquartile range [IQR], 9–24) days, and according to group it was 14 (IQR, 9–28) days for EDE, 13 (IQR, 7–20) days for LDE, and 15 (IQR, 10–25) days for NDE. The univariate analysis of variables associated with length of hospital stay is shown in Supplementary Table 4. Linear regression modeling of variables associated with length of hospital stay showed that nosocomial acquisition, Charlson index >3, and the presence of severe sepsis/septic shock at presentation were associated with more days of hospitalization (P = .006, P < .001, and P = .01, respectively). EDE and NDE were not found to be associated with longer hospital stay (P = .56 and P = .67, respectively) (Supplementary Table 5).
DISCUSSION
In this cohort, less than half the candidate patients received EDE, and one-third of patients were never de-escalated. Patients with MDR isolates or nosocomial infections empirically treated with imipenem or meropenem had a lower probability of de-escalation. Finally, neither EDE nor LDE were shown to be associated with worse outcomes.
To our knowledge, this is by far the biggest study of de-escalation among patients with bacteremia [6]. It is important to note that we only included nonneutropenic, adult patients with monomicrobial bacteremia due to Enterobacteriaceae who received early active empirical monotherapy with antipseudomonal β-lactams or ertapenem. We are not therefore addressing the impact of changing from combination therapy to monotherapy, but only of changes in the empirical drug used. This population is somewhat more homogeneous than those considered in most previous studies.
The definition of de-escalation used is open to debate [18]. Unfortunately, many previous studies did not provide a specific definition of de-escalation and/or the drugs considered. The objective of de-escalation is to reduce exposure at the individual and group levels to drugs with a high negative ecological impact. However, the ecological impact of the drugs may depend on different variables, including local epidemiology, the previous colonization status of patients, microbiota composition, and the dosing or duration of antibiotic therapy. In this study we used a classification of β-lactams developed by consensus [10]; in this consensus, imipenem and meropenem ranked highest in terms of spectrum width and highest resistance-selecting potential, followed by ertapenem and piperacillin-tazobactam or antipseudomonal cephalosporins. As drugs for de-escalation, we included the lower-ranked β-lactams in the consensus, in addition to other drugs suitable for oral use [19] that would allow the earlier discharge of patients, such as fluoroquinolones and trimethoprim-sulfamethoxazole. We also analyzed LDE.
De-escalation is performed less frequently than is desirable [20]. The main barriers identified for de-escalations are uncertainties about etiology, inadequate empirical therapy, and isolation of MDR bacteria [19, 20]. In patients with monomicrobial bacteremia due to Enterobacteriaceae, the only uncertainty about etiology is the possibility of polymicrobial infection in certain types of infection, typically intra-abdominal and some skin/skin structure–associated infections. In our study, source of BSI was not associated with higher rates of de-escalation when controlling for confounders, and inadequate empirical therapy was an exclusion criterion. However, MDR bacteria were associated with a lower probability of de-escalation. We also identified nosocomial infection as a predictor for NDE when these patients had been empirically treated with imipenem or meropenem, which may be a marker for more complex clinical situations. We suspect that other factors, such as stewardship interventions, less awareness of susceptibility results at weekends, and the training and opinions of individual prescribers, could also play a role in de-escalation practice and merit specific studies.
In crude analysis, de-escalation was associated with lower mortality and failure. This was probably due to confounding by indication as the associations were no longer significant when other mortality predictors were considered in multivariate analysis, which is similar to the results found in the meta-analysis by Paul et al for observational studies of patients with severe sepsis or bacteremia [6]. The results are reinforced by the fact that all our estimates in different analyses were consistent, and that we included mortality, failure of treatment, and length of stay as outcome variables. Interestingly, the estimates provided by multivariate analysis were much less accurate than those provided by the PS-based matched-pairs analysis. Our results strongly suggest therefore that de-escalation is safe. In fact, theoretically, it may have some individual beneficial effects if secondary infections caused by MDR bacteria are reduced, although demonstrating such an effect would require specific studies with a very large number of patients. Any analysis of population-level benefits would also require specific studies.
Our study has several limitations. Because it is not a randomized controlled trial, unmeasured confounding variables or residual confounding cannot be ruled out. The data were collected several years ago and changes in antimicrobial resistance may influence the results. Moreover, despite being controlled in the analysis, differences in clinical practice at each center might have influenced the outcomes. Some strengths of the study are its multicenter character, the use of clearly specified definitions, and the use of advanced statistical methodologies to control for confounders.
In conclusion, the results of this study reinforce the fact that antibiotic de-escalation in patients with monomicrobial bacteremia due to Enterobacteriaceae does not have a detrimental impact on outcome, 30-day all-cause mortality, failure, or length of hospital stay when compared with continuation with broad-spectrum antibiotics. These results may be useful for antibiotic stewardship activities.
Supplementary Data
Supplementary materials are available at Clinical Infectious Diseases online. Consisting of data provided by the authors to benefit the reader, the posted materials are not copyedited and are the sole responsibility of the authors, so questions or comments should be addressed to the corresponding author.
Notes
Other REIPI/GEIH-SEIMC Bacteraemia-MIC group members. M. de Cueto (Unidad Clínica Intercentros de Enfermedades Infecciosas, Microbiología y Medicina Preventiva, Hospital Universitario Virgen Macarena, Seville, Spain); A. M. Planes Reig (Departamento de Microbiología, Hospital Universitari Vall d’Hebron, Barcelona, Spain); F. Tubau Quintano (Servicio de Microbiología, Hospital Universitario de Bellvitge-Institut d’Investigació Biomédica de Bellvitge, Barcelona, Spain); C. Peña (Servicio de Enfermedades Infecciosas, Hospital Universitario de Bellvitge-IDIBELL, Barcelona, Spain); M. E. Galán Otalora (Hospital de la Santa Creu i Sant Pau, Barcelona, Spain); C. Ruíz de Alegría (Servicio de Microbiología, Hospital Universitario Marqués de Valdecilla, Santander, Spain); R. Cantón (Servicio de Microbiología, Hospital Universitario Ramón y Cajal and Instituto Ramón y Cajal de Investigación Sanitaria, Madrid, Spain); J. A. Lepe and J. M. Cisneros (Unidad Clínica de Enfermedades Infecciosas, Microbiología y Medicina Preventiva, Hospital Virgen del Rocío, Seville, Spain); J. Torre-Cisneros, R. Lara (Unidad Clínica de Enfermedades infecciosas Hospital Universitario Reina Sofía, Instituto Maimónides de Investigación Clínica, Universidad de Córdoba, Spain).
Financial support. This work was supported by the Instituto de Salud Carlos III, Ministry of Science, Innovation and Universities, Spain (grant number PI10/02021), co-financed by European Development Regional Fund “A Way to Achieve Europe,” Spanish Network for Research in Infectious Diseases (grant number REIPI RD16/0016/ 0001,0003,0004,0005, 0006,0007,0009,0011,0013,0016).
Potential conflicts of interest. Z. R. P.-B. has received personal fees from Gilead. J. R.-B. has received personal fees from Merck, personal fees from AstraZeneca for a non-drug-related research project, and grants from the Innovative Medicines Initiative. All other authors report no potential conflicts. All authors have submitted the ICMJE Form for Disclosure of Potential Conflicts of Interest. Conflicts that the editors consider relevant to the content of the manuscript have been disclosed.
References
Author notes
Other members of the REIPI/GEIRAS-SEIMC Bacteraemia-MIC Group are listed in the Notes.

