


Abstract
Rotavirus vaccine efficacy (VE) estimates in low-resource settings are lower than in developed countries. We detected coinfections in cases of severe rotavirus diarrhea in a rotavirus VE trial to determine whether these negatively impacted rotavirus VE estimates.
We performed TaqMan Array Card assays for enteropathogens on stools from rotavirus enzyme immunoassay–positive diarrhea episodes and all severe episodes (Vesikari score ≥11), from a phase 3 VE trial of Rotavac, a monovalent human–bovine (116E) rotavirus vaccine, carried out across 3 sites in India. We estimated pathogen-specific etiologies of diarrhea, described associated clinical characteristics, and estimated the impact of coinfections on rotavirus VE using a test-negative design.
A total of 1507 specimens from 1169 infants were tested for the presence of coinfections. Rotavirus was the leading cause of severe diarrhea even among vaccinated children, followed by adenovirus 40/41, Shigella/enteroinvasive Escherichia coli, norovirus GII, sapovirus, and Cryptosporidium species. Bacterial coinfections in rotavirus-positive diarrhea were associated with a longer duration of diarrhea and protozoal coinfections with increased odds of hospitalization. Using the test-negative design, rotavirus VE against severe rotavirus gastroenteritis increased from 49.3% to 60.6% in the absence of coinfections (difference, 11.3%; 95% confidence interval, –10.3% to 30.2%).
While rotavirus was the dominant etiology of severe diarrhea even in vaccinated children, a broad range of other etiologies was identified. Accounting for coinfections led to an 11.3% increase in the VE estimate. Although not statistically significant, an 11.3% decrease in VE due to presence of coinfections would explain an important fraction of the low rotavirus VE in this setting.
Rotavirus is the leading cause of diarrhea in children <5 years of age, with >215000 deaths in 2013 due to rotavirus, and 37% of the under-5 diarrhea deaths attributable to rotavirus according to the latest estimates by the World Health Organization and Centers for Disease Control and Prevention [1, 2]. Approximately 22% of all rotavirus-associated deaths were from India. Since 2006, implementation of rotavirus vaccination in >70 countries has led to substantial decreases in hospitalizations due to rotavirus and all-cause diarrhea [3]. In India, 4 licensed rotavirus vaccines are currently available: Rotarix (GlaxoSmithKline Biologicals), Rotateq (Merck Vaccines), Rotavac (Bharat Biotech International Ltd), and ROTASIIL (Serum Institute India Ltd). The last 2 vaccines, developed by Indian companies, have made rotavirus vaccination inclusion in the universal immunization program in India possible because of the affordable price.
Clinical trials done in low- and middle-income countries (LMICs) have revealed the suboptimal efficacy and effectiveness of rotavirus vaccines in these settings compared to developed countries [4–6]. In India, the efficacy of the oral rotavirus vaccine 116E strain (Rotavac) against severe rotavirus diarrhea, reported in a phase 3 clinical trial, was 53.6% (95% confidence interval [CI], 35.0%–66.9%) [7], whereas the efficacy estimate of the pentavalent ROTASIIL vaccine was 39.5% (95% CI, 26.7%–50%) [8]. For the other 2 rotavirus vaccines, immunogenicity studies have indicated suboptimal performance in Indian settings [9]. A number of host- and vaccine-associated factors might contribute to this impaired response to oral rotavirus vaccines and other orally administered vaccines [10]. Presence of coinfections with one or more enteric pathogens, even in apparently healthy infants in LMIC settings, is common [11], and recent studies have looked at associations between their presence and impaired immune response to rotavirus vaccines [12, 13]. However, the possibility of misattribution of diarrheal episodes to rotavirus in rotavirus vaccine efficacy (VE) studies, by not testing diarrheal samples for other pathogens, has not been addressed in a systematic manner until recently. It is clear from recent diarrheal etiology studies from Asia and Africa that the presence of multiple pathogens in episodes of diarrhea, both hospitalized cases as well as the less severe community diarrhea, is common, especially when molecular diagnostic assays are used [14, 15]. Therefore, in settings with high enteropathogen burden, detecting an enteropathogen using a particular diagnostic test is not enough to ascribe causality for diarrheal disease. This might have implications while calculating the efficacy of a rotavirus vaccine, whereby only rotavirus is assayed. In doing so, we might be misattributing a number of episodes where other enteropathogens were also present. The presence of multiple coinfecting pathogens in diarrheal episodes, and failure to detect them, might be responsible for the lower-than-expected efficacy of rotavirus vaccines reported in clinical trials in settings where such coinfections are common.
We used a TaqMan Array Card (TAC) platform to detect and quantify major enteropathogens [16] in stool samples by quantitative polymerase chain reaction (qPCR) from diarrheal episodes during the phase 3 efficacy trial of the monovalent human–bovine (116E) rotavirus vaccine, Rotavac [7, 17]. In the primary 116E trial, positivity by rotavirus antigen enzyme-linked immunosorbent assay was the criterion for classifying severe to very severe diarrhea due to rotavirus. Here, we estimate the burden of coinfections with specific enteropathogens within the follow-up period of the clinical trial, describe the clinical features and disease severity associated with these pathogens, and estimate whether accounting for the presence and quantity of enteropathogens other than rotavirus modifies the rotavirus VE measurements from the primary trial.
METHODS
Clinical Study Data
The phase 3 placebo-controlled efficacy trial for the monovalent human–bovine (116E) vaccine, Rotavac, was conducted between 2012 and 2014 in Delhi, Vellore, and Pune, India (Clinical Trials Registry – India number 2010/091/000102) [7, 17]. In brief, infants were enrolled at 6–8 weeks of age, given 3 doses of the Rotavac vaccine or placebo at a 2:1 ratio at ages 6, 10, and 14 weeks, and prospectively followed by weekly home visits until 2 years of age to identify cases of diarrhea. Diarrhea was defined as the occurrence of ≥3 watery or looser-than-normal stools within a 24-hour period with or without vomiting. For any episode of diarrhea, stool samples were collected as soon as possible but no later than 7 days after the last day of gastroenteritis [7]. Clinical characteristics such as duration of diarrhea, vomiting (number of episodes per day and duration), temperature, degree of dehydration, presence of blood in stool, and hospitalization were noted. The Vesikari scoring system was used to calculate the severity of each diarrheal episode [18, 19]. In the clinical trial, VE was determined against severe rotavirus diarrhea, defined as rotavirus positivity by antigen enzyme immunoassay (EIA) in a case of diarrhea with Vesikari score ≥11.
To study the contribution of enteropathogens other than rotavirus, we tested samples from episodes of severe diarrhea, as well as all rotavirus EIA–positive samples, irrespective of severity by the molecular methods described below. Specimens from eligible episodes were included for testing if sufficient sample was available, storage history was verified, and informed consent allowed for future testing of stored specimens.
Molecular Diagnostics
Stool samples were tested for the presence of enteropathogens other than rotavirus using TAC assays as previously described [14]. In brief, samples were transferred to a –70°C freezer from the clinical study site and stored frozen until tested. Following testing for rotavirus by EIA at the Translational Health Sciences and Technology Institute, specimens were transferred to Christian Medical College, Vellore, for testing by TAC assays for enteropathogen targets. Total nucleic acid was extracted using the QIAamp Fast DNA Stool mini kit (Qiagen, Hilden, Germany), with additional steps including spiking with extraction controls (107 copies of MS2 bacteriophage and phocine herpes virus) and bead beating. Each batch of extractions also included one extraction blank. All TAC assays were performed on the QuantStudio 12K Flex real-time PCR system. Because rotavirus testing had already been performed, and our purpose was to examine nonrotavirus enteropathogens, the custom-designed TAC assays included enteropathogen targets other than rotavirus (see Supplementary Table 1 for included targets). For a valid result, the spiked extraction controls should have been in the expected range with a cycle threshold value ≤35 and the blank extraction control should not be positive for any of the pathogen targets. We also excluded any data flagged by the PCR software QuantStudio 12K Flex version 1.1.
Data Analysis
Because detection of enteropathogens is common by qPCR even in stools collected from children without diarrhea in LMIC settings [14, 15], we attributed etiology of diarrhea to a specific pathogen by calculating an adjusted attributable fraction (AF) [20]. Because nondiarrheal stools were not collected in this vaccine trial, we used models from the qPCR reanalysis of a large multisite case-control study that included India to derive quantity-specific odds ratios (ORs) [14]. Specifically, using qPCR data from 5304 cases of moderate to severe acute diarrhea and age-, sex-, and village-matched controls, we fit a multivariable conditional logistic regression model to describe the association between pathogen quantity and diarrhea while adjusting for the presence of other pathogens. We then calculated AFs by summing the attributable fraction for each episode (AFe) across each of j cases in the present study—that is, , where , and is the quantity-specific OR derived from the regression model. To estimate the variance for the model-based attribution, ORs were estimated 1000 times using random perturbations of the model coefficients in accordance with their sampling variance covariance, coefficients being drawn equally from each of the Global Enteric Multicenter Study (GEMS) sites. The 95% CIs were derived from the 2.5th and 97.5th quantiles of the AF distribution, and point estimate of the AF was calculated using the original model coefficients.
Using data from the vaccine trial follow-up period, we evaluated associations between enteropathogens and clinical characteristics in severe diarrhea episodes of any etiology and rotavirus-positive diarrheal episodes of any severity score. We modeled each clinical characteristic as a binary or ordinal response with enteropathogen attribution to each episode as predictors. We fit logistic or ordinal logistic regression models, using generalized estimating equations (GEEs) with robust variance to account for correlation among multiple episodes in some children. We modeled nonrotavirus pathogens both individually and summed in categories (bacteria, viruses other than rotavirus, protozoa). Pathogens other than rotavirus were modeled as continuous AFe values for each episode, such that the OR for a one-unit change in AFe corresponded to an episode wholly attributable to that pathogen or pathogen category. In analyses of severe diarrhea episodes of any etiology, rotavirus detection by EIA was a binary predictor. In analyses of the set of rotavirus EIA–positive diarrhea of any severity, the rotavirus vaccine treatment arm was included as a binary predictor. All models were adjusted for study site for the vaccine trial as well as age with a linear and quadratic term.
To allow for regression-based adjustment of nonrotavirus enteric coinfections in severe diarrheal episodes, we used the test-negative design, which has been shown to reproduce VE estimates in several rotavirus vaccine clinical trials [21]. First, we calculated the total contribution of nonrotavirus pathogens to each episode of severe diarrhea in the per-protocol group as the sum of the nonrotavirus pathogen-specific AF estimates for each episode using the quantity-specific GEMS model coefficients. We then used GEEs to fit a logistic regression model with the rotavirus EIA test result as the response and vaccination status, study site, a linear and quadratic age term, and quarter of the calendar year as predictors. Vaccine efficacy was calculated as , where OR is the exponent of the model coefficient for vaccination status. Next, we fit the same model, but added an interaction between vaccination status and the sum attribution to nonrotavirus enteropathogens. We then calculated VE as above but without including the interaction term, which we interpreted as the VE when the sum attribution to nonrotavirus enteropathogens was zero. The difference in VE estimates between the 2 models was calculated by bootstrap with 1000 iterations.
RESULTS
A total of 1283 specimens met criteria for testing, of which 1271 (99.1%) had valid qPCR results and were included in the analysis (Figure 1). This included samples from 704 episodes of severe diarrhea (Vesikari score ≥11) from 603 children, of which 196 (27.8%) were rotavirus positive by EIA. Supplementary Table 2 lists the proportion of episodes positive for enteropathogens at diarrhea-associated quantities. Rotavirus, as detected by EIA, had the highest AF for severe diarrhea in both placebo and Rotavac-vaccinated children, although there was a clear beneficial impact of vaccination (Figure 2). Adenovirus 40/41, Shigella/enteroinvasive Escherichia coli (EIEC), norovirus GII, sapovirus, and Cryptosporidium species detected by TAC assay were the next most important pathogens when the pathogen-specific attribution of severe diarrhea was determined (Figure 2). Even in severe episodes of rotavirus diarrhea, the attribution to nonrotavirus pathogens as determined by the presence of these other pathogens at “diarrhea-associated” quantities was substantial (Figure 3). There was a trend toward increased attribution to nonrotavirus pathogens in rotavirus-vaccinated infants (sum AF, 33.6%; 95% CI, 22.9%–44.8%) compared with infants in the placebo arm (sum AF, 22.8%; 95% CI, 14.1%–31.0%).
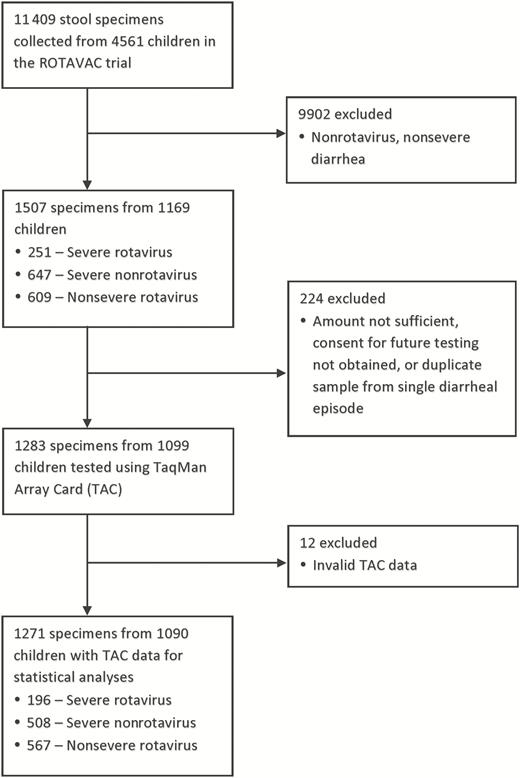
Selection and testing of stool specimens for enteropathogen coinfections from the ROTAVAC trial. Abbreviation: TAC, TaqMan Array Card.
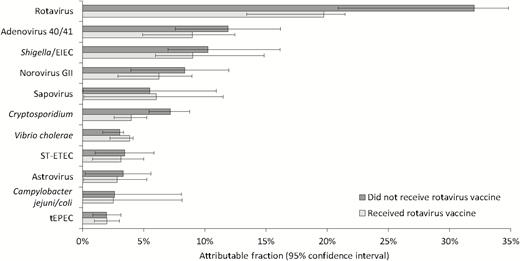
Pathogen-specific attribution of severe diarrhea by rotavirus vaccination status. Abbreviations: EIEC, enteroinvasive Escherichia coli; ST-ETEC, Stable toxin enterotoxigenic Escherichia coli; tEPEC, typical enteropathogenic Escherichia coli.

Attribution to nonrotavirus enteropathogens in rotavirus enzyme immunoassay–positive severe diarrhea. Abbreviations: EIEC, enteroinvasive Escherichia coli; ST-ETEC, stable toxin enterotoxigenic Escherichia coli.
Clinical Phenotypes and Pathogens
Attribution to specific pathogens was associated with distinct clinical phenotypes among severe diarrhea episodes (Table 1). For example, whereas rotavirus was associated with watery diarrhea with vomiting and dehydration, Shigella/EIEC was associated with dysentery (adjusted OR [aOR], 17.01; 95% CI, 6.11–47.36), a longer duration of diarrhea and dehydration without vomiting. Rotavirus was associated with more severe diarrhea (higher Vesikari score) than other viral pathogens, and Shigella was associated with more severe diarrhea than other bacterial pathogens. We then evaluated whether the presence of coinfections at diarrhea-associated quantities altered the phenotype of rotavirus EIA-positive diarrhea of any severity (Table 2). In this subset, attribution to bacterial enteropathogens was associated with a longer duration of diarrhea, and attribution to protozoa with hospitalization. Receiving rotavirus vaccine was associated with a decreased duration of diarrhea (aOR, 0.58; 95% CI, .41–.83) and less frequent vomiting (aOR, 0.69; 95% CI, .53–.92).
Association Between Severe Diarrhea Attribution to Specific Enteric Pathogens and Clinical Characteristics (704 Episodes)
| Pathogen | Diarrhea ≥ 5 Days (n = 443 [62.9%]) | Maximum Vomiting Episodes per Day (0: n = 29 [4.1%]; 1: n = 54 [7.7%]; 2–4: n = 446 [63.4%]; ≥5: n = 175 [24.9%] | Dehydration, Any (n = 366 [52.0%]) | Hospitalization (n = 444 [63.1%]) | Blood in Stool (n = 55 [7.8%]) | Very Severe (VS ≥15) (n = 133 [18.9%]) | ||||||
|---|---|---|---|---|---|---|---|---|---|---|---|---|
| aOR | (95% CI) | aOR | (95% CI) | aOR | (95% CI) | aOR | (95% CI) | aOR | (95% CI) | aOR | (95% CI) | |
| Individual pathogena | ||||||||||||
| Rotavirus | 0.80 | (.54–1.18) | 1.45 | (1.00–2.11) | 2.21 | (1.46–3.36) | 3.02 | (1.97–4.65) | 0.32 | (.11–.91) | 1.57 | (.96–2.58) |
| Adenovirus 40/41 | 0.76 | (.31–1.88) | 2.10 | (.90–4.92) | 1.21 | (.48–3.05) | 1.68 | (.67–4.24) | 2.40 | (.51–11.16) | 0.86 | (.27–2.75) |
| Shigella/EIEC | 3.67 | (1.64–8.23) | 0.38 | (.19–.77) | 2.04 | (1.01–4.14) | 1.65 | (.79–3.45) | 17.01 | (6.11–47.36) | 2.20 | (.97–5.00) |
| Norovirus GII | 1.13 | (.45–2.84) | 2.19 | (.95–5.02) | 0.45 | (.18–1.12) | 0.62 | (.24–1.61) | 0.69 | (.13–3.74) | 0.73 | (.22–2.42) |
| Cryptosporidium | 2.61 | (.90–7.55) | 0.72 | (.32–1.63) | 1.48 | (.61–3.56) | 1.76 | (.67–4.62) | 0.09 | (.01–1.08) | 1.10 | (.36–3.38) |
| Sapovirus | 3.95 | (.80–19.37) | 1.32 | (.36–4.81) | 0.27 | (.07–1.06) | 0.50 | (.13–1.96) | 1.08 | (.13–9.14) | 1.32 | (.23–7.42) |
| ST-ETEC | 2.39 | (.66–8.63) | 0.73 | (.22–2.43) | 0.81 | (.21–3.16) | 0.70 | (.19–2.52) | 0.75 | (.06–8.80) | 0.69 | (.13–3.65) |
| Pathogen categorya | ||||||||||||
| Rotavirus | 0.68 | (.46–1.00) | 1.55 | (1.07–2.24) | 0.76 | (.55–1.05) | 3.16 | (2.04–4.88) | 0.26 | (.09–.74) | 1.53 | (.95–2.46) |
| Bacteriab | 1.12 | (.68–1.87) | 0.91 | (.57–1.45) | 0.98 | (.69–1.39) | 1.51 | (.96–2.37) | 2.46 | (1.42–4.24) | 1.70 | (1.02–2.82) |
| Virus (nonrotavirus)c | 1.05 | (.60–1.85) | 1.66 | (1.02–2.71) | 0.73 | (.44–1.20) | 0.94 | (.53–1.67) | 1.56 | (.62–3.92) | 0.87 | (.41–1.85) |
| Protozoad | 2.08 | (.79–5.46) | 0.78 | (.35–1.73) | 0.52 | (.23–1.17) | 2.13 | (.82–5.51) | 0.15 | (.01–1.47) | 1.03 | (.35–3.02) |
Adjusted odds ratios and 95% confidence intervals for each clinical characteristic were estimated from multiple logistic or ordinal logistic (for vomiting episodes) regression models, with age, study site, and pathogens or pathogen categories as predictors.
Abbreviations: aOR, adjusted odds ratio; CI, confidence interval; EIEC, enteroinvasive Escherichia coli; ST-ETEC, stable toxin enterotoxigenic Escherichia coli; VS, Vesikari score.
aRotavirus detection by enzyme immunoassay was a binary predictor, while other pathogens and pathogen categories were modeled as continuous attributable fraction (AF) values.
bSum of AFs for Shigella/EIEC, Vibrio cholerae, ST-ETEC, Campylobacter jejuni/coli, typical enteropathogenic Escherichia coli, Aeromonas, and Salmonella.
cSum of AFs for adenovirus 40/41, norovirus GII, sapovirus, and astrovirus.
dSum of AFs for Cryptosporidium and Entamoeba histolytica.
Clinical Characteristics Among Rotavirus-positive Diarrhea With Enteric Coinfections (763 Episodes)
| Pathogen | Diarrhea ≥5 Days (n = 443 [62.9%]) | Maximum Vomiting Episodes per Day (0: n = 29 [4.1%]; 1: n = 54 [7.7%]; 2–4: n = 446 [63.4%]; ≥5: n = 175 [24.9%]) | Dehydration, Any (n = 366 [52.0%]) | Hospitalization (n = 444 [63.1%]) | ||||
|---|---|---|---|---|---|---|---|---|
| aOR | (95% CI) | aOR | (95% CI) | aOR | (95% CI) | aOR | (95% CI) | |
| Individual pathogena | ||||||||
| Adenovirus 40/41 | 1.61 | (.41–6.27) | 1.47 | (.41–5.24) | 1.18 | (.32–4.44) | 1.59 | (.42–5.98) |
| Shigella/EIEC | 2.88 | (.96–8.65) | 0.53 | (.20–1.46) | 1.80 | (.53–6.03) | 1.32 | (.42–4.21) |
| Norovirus GII | 2.10 | (.39–11.29) | 0.50 | (.13–1.88) | 0.77 | (.10–5.72) | 0.40 | (.05–3.16) |
| Cryptosporidium | 1.82 | (.09–38.50) | 0.80 | (.04–17.07) | 6.55 | (.42–101.41) | 8.24 | (.46–148.18) |
| Sapovirus | 5.19 | (.81–33.32) | 0.25 | (.04–1.56) | 1.61 | (.20–13.03) | 1.14 | (.16–8.18) |
| ST-ETEC | 2.21 | (.67–7.35) | 1.01 | (.26–3.90) | 1.79 | (.44–7.34) | 1.31 | (.34–5.10) |
| Pathogen categorya | ||||||||
| Bacteriab | 2.01 | (1.07–3.76) | 0.95 | (.51–1.76) | 1.43 | (.68–3.02) | 0.97 | (.46–2.01) |
| Virus (nonrotavirus)c | 2.05 | (.89–4.68) | 0.62 | (.32–1.19) | 1.27 | (.51–3.18) | 1.06 | (.43–2.57) |
| Protozoad | 1.16 | (.08–15.82) | 2.77 | (.13–60.54) | 3.51 | (.33–36.71) | 15.39 | (1.41–167.81) |
The aORs and 95% CIs for each clinical characteristic were estimated from multiple logistic or ordinal logistic (for vomiting episodes) regression models, with age, study site, treatment arm (RV or placebo), and pathogen or pathogen categories as predictors.
Abbreviations: aOR, adjusted odds ratio; CI, confidence interval; EIEC, enteroinvasive Escherichia coli; ST-ETEC, stable toxin enterotoxigenic Escherichia coli.
aRotavirus detection by enzyme immunoassay was a binary predictor, while other pathogens and pathogen categories were modeled as continuous attributable fraction (AF) values.
bSum of AFs for Shigella/EIEC, Vibrio cholerae, ST-ETEC, Campylobacter jejuni/coli, typical enteropathogenic Escherichia coli, Aeromonas, and Salmonella.
cSum of AFs for adenovirus 40/41, norovirus GII, sapovirus, and astrovirus.
dSum of AFs for Cryptosporidium and Entamoeba histolytica.
Coinfections and Calculated Rotavirus Vaccine Efficacy
Because of evidence that rotavirus-positive severe diarrhea was partially attributable to other enteropathogens, and because this attribution was more common in vaccinated children, we assessed whether coinfections impacted VE estimates. This analysis was performed in the per-protocol group for children followed until 2 years of age (704 episodes of severe diarrhea).
Supplementary Table 3 presents the unadjusted VE estimates for children included in the analysis for severe rotavirus gastroenteritis and “pure” severe rotavirus gastroenteritis, defined as rotavirus EIA positivity without any other enteropathogen detection at diarrhea-associated quantities by TAC assay.
We calculated the VE using the test-negative design, to allow adjustment for the impact of nonrotavirus enteropathogens. Rotavac VE against severe diarrhea in the per-protocol population was 49.3% (95% CI, 26.2%–65.2%), comparable to the previous 53.6% efficacy estimate from the overall trial. We then estimated the efficacy in the absence of coinfections to be 60.6% (95% CI, 26.5%–76.8%). The efficacy difference was estimated by bootstrapping to be 11.3% (95% CI, –10.3% to 30.2%).
DISCUSSION
Although the beneficial impact of rotavirus vaccination and overall decrease in diarrheal rates was clear, rotavirus continued to be the most important diarrheal pathogen even in the vaccinated group. Although the impact of rotavirus vaccination in reducing the burden and mortality due to rotavirus diarrhea is proven [3, 22], in effectiveness studies from settings such as Africa, rotavirus continues to be a common etiology of diarrhea after rotavirus vaccine introduction [23]. By contrast, similar studies in other LMIC settings such as Nicaragua have shown a significantly lower contribution of rotavirus in the postvaccine era, and other pathogens such as norovirus and sapovirus become more prominent [24].
The primary objective of the study, the estimate of pathogen-specific burdens of severe diarrhea in this vaccine trial, revealed that enteric adenovirus, Shigella, norovirus, sapovirus, and Cryptosporidium were the next most important diarrheal pathogens, after rotavirus, in children <2 years of age. Attribution to enterotoxigenic E. coli (ETEC) was low, and the overall prevalence was also low for this pathogen for which vaccines are advancing into efficacy trials [25]. The lower attribution to ETEC may be because of the use of the Vesikari score to identify severe diarrhea, which may not be appropriate for ETEC or other bacterial diarrhea. It is important to note that although ETEC was one of the pathogens with a high AF for diarrhea in the GEMS study when the overall data was considered, AF estimates for this pathogen varied from site to site with low AF for certain Asian sites such as India and Bangladesh [14]. In contrast, Shigella/EIEC was associated with a relatively high burden of severe diarrhea in this trial. The use of sensitive molecular diagnostic tests help overcome the low sensitivity of traditional culture methods for detection of Shigella species and have revealed the considerably high burden of severe diarrhea attributable to this pathogen in the first 2 years of life in Asia and Africa [14]. In prior work, most of these Shigella/EIEC detections can be traced to Shigella species and not EIEC [14, 26], and several vaccines are now under development [27]. Adenovirus serotypes 40/41 had the highest AF among all the nonrotavirus pathogens for severe diarrhea. Significant association of adenovirus 40/41 serotypes with severe diarrhea has been highlighted in recent studies using both EIA [11] and molecular methods similar to those used in our study [14].
Clinical phenotypes associated with different enteropathogens were in line with expected profiles. We evaluated whether the presence of coinfections with other enteric pathogens in attributable quantities altered the phenotype of rotavirus-positive severe diarrhea. Rotavirus coinfections with attribution to bacterial enteropathogens were associated with a longer duration of the diarrheal episodes, although not with the overall severity of diarrhea. While the accentuation of rotavirus disease severity in the presence of copathogens has been discussed previously based on in vitro studies, animal studies, and a few clinical studies [28–30], some studies have failed to show a difference in the disease severity in mixed infections compared to rotavirus monoinfections [31, 32].
Reevaluation of rotavirus VE after accounting for the presence of nonrotavirus enteropathogen coinfection at diarrhea-attributable quantities showed an increase from 49.3% to 60.6% in the absence of coinfections. A recent Rotarix effectiveness study from Botswana estimated an increase in vaccine effectiveness of 8% to 14% when coinfections with 5 other pathogens were considered [33]. A similar study from South Africa described an increase in adjusted vaccine effectiveness of 8% after considering coinfections with additional enteric viruses [34]. Neither increase was statistically significant. Our analysis is among the few where a comprehensive evaluation of coinfecting pathogens in diarrhea-associated quantities has been considered to calculate an adjusted VE for a rotavirus vaccine. In a study in Peruvian infants for an attenuated bovine rotavirus vaccine, Lanata et al evaluated the presence of common bacterial pathogens and reported that the particular vaccine had no efficacy against mixed infections [35]. The 11.3% increase observed in Rotavac efficacy against severe rotavirus gastroenteritis (49.3% to 60.6%) after accounting for coinfections is consistent with the vaccine effectiveness studies mentioned earlier. Despite the large sample size, the increase in VE was not statistically significant. This could be a function of the inherently wide CIs associated with a VE calculation. Even in the parent phase 3 Rotavac trial for licensure that analyzed 6541 infants, the VE CIs broadly spanned from 35.0% to 66.9% (95% CI) [7]. To visualize a statistically significant, nonoverlapping superior rotavirus VE of any sort, whether by accounting for coinfections or comparing 2 vaccines, would require sample sizes of many thousands. However, we would conclude, given the consistency with the above-mentioned studies, that coinfections do have an impact, explaining about 10% of the suboptimal rotavirus VE seen in LMIC settings with high transmission of enteropathogens. Although the 11.3% increase in efficacy accounted by coinfections only explains a fraction of the poor rotavirus VE noted in LMIC settings, and low immunogenicity remains an important problem, the public health impact of this increase is likely considerable [36, 37]. Efficacy trials of future rotavirus vaccine should take these coinfections with other enteropathogens into account in the efficacy study designs.
This study had limitations. We did not have resources to test samples from rotavirus EIA-negative nonsevere diarrheal episodes. Also, due to the lack of a control population, we had to use mathematical models based on the GEMS qPCR reanalysis to estimate pathogen-specific AFs. In addition, because of the active surveillance in this vaccine trial, early detection and care may have affected presentation and severity of diarrhea. These caveats notwithstanding, our analysis highlights the considerably high rates of coinfections with other important enteropathogens such as Shigella species, adenovirus 40/41, and norovirus at diarrhea-associated quantities in cases of rotavirus-positive severe diarrhea in the Rotavac VE trial. Shifts in the clinical phenotypes of these rotavirus-positive cases when coinfections were considered were apparent. The adjusted VE estimate for the Rotavac vaccine against severe diarrhea using the test-negative design showed a trend toward improvement, which will be important for future rotavirus VE studies to consider.
Supplementary Data
Supplementary materials are available at Clinical Infectious Diseases online. Consisting of data provided by the authors to benefit the reader, the posted materials are not copyedited and are the sole responsibility of the authors, so questions or comments should be addressed to the corresponding author.
Notes
Financial support. This work was supported by PATH (contract number: GAT.1505-6648867-CRT) and was a collaboration with PATH investigators, who were involved in the planning and analysis stages of the study.
Potential conflicts of interest. All authors: No reported conflicts of interest. All authors have submitted the ICMJE Form for Disclosure of Potential Conflicts of Interest. Conflicts that the editors consider relevant to the content of the manuscript have been disclosed.
References
Author notes
I. P., J. A. P.-M., E. R. H., and G. K. contributed equally to this work.

