


Abstract
In Burkina Faso, serogroup A meningococcal (NmA) conjugate vaccine (PsA-TT, MenAfriVac) was introduced through a mass campaign in children and adults in December 2010. Similar to a serological survey in 2011, we followed population-level antibody persistence for 5 years after the campaign and estimated time of return to previously-published pre-vaccination levels.
We conducted 2 cross-sectional surveys in 2013 and early 2016, including representative samples (N = 600) of the general population of Bobo-Dioulasso, Burkina Faso. Serum bactericidal antibody titers (rabbit complement) were measured against NmA reference strain F8236 (SBA-ref), NmA strain 3125 (SBA-3125), and NmA–specific immunoglobulin G (IgG) concentrations.
During the 2016 survey, in different age groups between 6 and 29 years, the relative changes in geometric means compared to 2011 values were greater among younger age groups. They were between -87% and -43% for SBA-ref; -99% and -78% for SBA-3125; and -89% and -63% for IgG. In linear extrapolation of age-specific geometric means from 2013 to 2016, among children aged 1–4 years at the time of the PsA-TT campaign, a return to pre-vaccination levels should be expected after 12, 8, and 6 years, respectively, according to SBA-ref, SBA-3125, and IgG. Among older individuals, complete return to baseline is expected at the earliest after 11 years (SBA-ref and SBA-3125) or 9 years (IgG).
Based on SBA-3125, a booster campaign after 8 years would be required to sustain direct immune protection for children aged 1–4 years during the PsA-TT campaign. Antibodies persisted longer in older age groups.
(.)
The African meningitis belt, spanning across sub-Saharan Africa, is characterized by pronounced seasonality and recurrent epidemics of meningococcal meningitis, with high fatality rates and serious sequelae [1, 2]. Until 2010, these epidemics were mainly due to serogroup A Neisseria meningitidis (NmA). After the introduction of a NmA conjugate vaccine (PsA-TT, MenAfriVac) specifically developed for this region by the Meningitis Vaccine Project [3], a reduction close to elimination of NmA meningitis was observed; surveillance did not identify any cases of NmA meningitis in vaccinated individuals [4]. Countries are now introducing PsA-TT in routine infant immunization programs (with 1 dose at age 9–18 months) and, in addition, are conducting catch-up campaigns among the unvaccinated birth cohorts [3].
Prior to and during the introduction of PsA-TT into the meningitis belt countries, several clinical trials assessed the safety and immunogenicity of PsA-TT, as well as antibody persistence for up to 5 years [5, 6]. These studies raised hope that antibodies after PsA-TT, and therefore direct protection, might last for at least 10 years. The application of this evidence to decision-making on the optimal vaccination strategy was limited by 2 factors. First, effective seroprevalence and antibody persistence in a population may differ from that expected on the basis of clinical trials, given logistic constraints during mass campaigns (eg, cold chain), the absence of natural immune boosters after elimination of NmA, and immigration from unvaccinated countries. The second major concern is that no correlate of protection is known for NmA. The serum bactericidal antibody (SBA) threshold used for vaccine development has been found to be poorly related to disease risk at the population level [7], and pre-vaccination seroprevalence was already high before vaccine introduction [7, 8]. It appears, therefore, essential to investigate the population immune status with alternative indicators of immune protection, including the SBA against the NmA strain 3125, which may be more specific for vaccine-induced antibodies [7, 9].
In this study, we aimed to evaluate the population-level antibody persistence according to 3 different serological indicators during the 5 years following the PsA-TT campaign in Bobo-Dioulasso, the second largest town of Burkina Faso. We previously reported substantially higher seroprevalence in all vaccine-eligible age groups 1 year after the PsA-TT campaign [10], compared to pre-vaccination levels as they were observed in the same population and using a comparable protocol in 2008 [7]. We here report antibody persistence observed during the following 2 surveys in the same population at 3 and 5 years after the PsA-TT campaign, and present estimates of the time to return to pre-vaccination levels.
METHODS
During October–November 2013 and January–February 2016, we conducted 2 cross-sectional studies on representative samples of the urban population of Bobo-Dioulasso aged 6 months to 31 years (33 years in 2016). The National Ethics and Research Committee of Burkina Faso, and the Ethics Committee of Centre MURAZ, Bobo-Dioulasso, approved the study protocols. Procedures were the same as in the 2011 survey [10] and are detailed in Supplementary Data. Participants or their legal guardian (if aged <18 years) signed an informed consent document before enrollment or, if illiterate, provided a fingerprint in the presence of an independent witness. To be eligible for inclusion, individuals had to be a resident of urban Bobo-Dioulasso and not report any serious illness, including severe malnutrition or a bleeding disorder. The sample was established based on a 2-stage cluster-sampling design [10]. Included participants were invited to the Centre Muraz outpatient clinic for the study visit a few days later, where study nurses recorded height and weight for children aged <9 years and administered a standardized questionnaire on socio-demographic information, relevant medical history, and living conditions. Meningococcal vaccination status was assessed based on vaccination cards or health booklets, or recall. A 2- to 5-mL blood sample was taken from each participant. SBA titers were measured using rabbit complement against 2 serogroup A strains: reference strain F8238 of immunotype L11 (SBA-ref, all sera) and strain 3125 of immunotype L10 (SBA-3125, 200 randomly-selected serum samples) [11]. Serogroup A–specific immunoglobulin G (IgG) concentrations were determined by enzyme-linked immunosorbent assay [12]. All serological analyses were performed at the Vaccine Evaluation Unit of Public Health England in Manchester, United Kingdom.
We calculated age-specific geometric means of SBA titers (GMT) and IgG concentrations (GMC) with 95% confidence intervals (CIs). Putatively-protective titers or concentrations were defined as ≥128 for SBA-ref and SBA-3125 and as ≥2 µg/mL for serogroup A–specific IgG. We used 2 approaches to define age groups: the first had the objective of evaluating how population-level seroprevalence and mean titers evolved with time since introduction, and the other of extrapolating observed changes in population-level mean titers.
Time of return to pre-vaccination immune levels was estimated using extrapolation of age-specific geometric means from the changes between the 2013 and 2016 surveys. We conducted 2 alternative analyses, assuming (1) a constant relative decline (exponential function) and (2) a constant absolute decline (linear function). Pre-vaccination titers were obtained from a seroprevalence survey conducted in the same population using a similar protocol during January–February 2008, 2.75 years before the PsA-TT mass campaign [7]. Analyses were performed using Stata software version 14 and were adjusted for design effect using the svy command.
RESULTS
In the 2013 and 2016 surveys, we included 599 and 647 participants, respectively, who provided serum samples and precise age information. Of these participants, 201 (34%) and 158 (24%), respectively, were younger than 5 years, and 188 (32%) and 224 (35%), respectively, were 15 years or older; 319 (53%) and 350 (55%), respectively, were women (Table 1). However, 7% and 12%, respectively, of PsA-TT–eligible participants in the 2013 and 2016 surveys resided outside Bobo-Dioulasso during the 2010 campaign. 3% and 8%, respectively, of participants in both surveys were thus not vaccinated (Table 1).
Participant Characteristics and Number of Serological Data Available per Survey of General Population of Bobo-Dioulasso, Burkina Faso
| 2011 Survey (Oct-Nov) | 2013 Survey (Nov-Dec) | 2016 Survey (Jan-Feb) | |
|---|---|---|---|
| Age range included (years) | 0.5–29.8 | 0.5–31.9 | 0.5–33.4 |
| SBA reference strain | N = 562 | N = 599 | N = 647 |
| SBA 3125 strain | N = 200 | N = 199 | N = 200 |
| IgG | N = 562 | N = 599 | N = 647 |
| N (%) | N (%) | N (%) | |
| Age (%) | |||
| <24 months | 88 (15.7) | 82 (13.7) | 89 (13.8) |
| 24–59 months | 160 (28.5) | 119 (19.9) | 69 (10.7) |
| 5–14 years | 158 (28.1) | 210 (35.1) | 265 (41.0) |
| 15–29 years | 156 (27.9) | 175 (29.2) | 200 (30.9) |
| 30+ years | 0 | 13 (2.2) | 24 (3.7) |
| Sex | |||
| female | 290 (51.6) | 319 (53.3) | 350 (55.4) |
| male | 272 (48.4) | 278 (46.4) | 282 (44.6) |
| PsA-TT–eligible participants in December 2010 a | |||
| Age range (years) | 1.9–29.9 | 4.0–32.0 | 6.1–34.1 |
| N (% of total sample) | 481 (85.6) | 470 (78.5) | 441 (68.2) |
| Among eligible, | |||
| … did not live in Bobo-Dioulasso during December 2010 | 26 (5.4) | 32 (6.8) | 52 (11.8) |
| … lived outside Burkina Faso | 9 (1.9) | 12 (2.6) | 12 (2.7) |
| … were not vaccinated because outside Bobo-Dioulasso | 14 (2.9) | 14 (3.0) | 36 (8.2) |
Abbreviations: IgG, immunoglobulin G; PsA-TT, meningococcal serogroup A conjugate vaccine; SBA, serum bactericidal antibody.
aThe PsA-TT campaign targeted age groups 1 to 29 years.
Participants aged 4.0–32.0 years old (2013) and 6.1–34.1 years old (2016) had been eligible for PsA-TT during the 2010 campaign. In the 2016 survey, prevalence of SBA-ref ≥128 was 98% (95% CI, 94–100) among 6- to 30-year-old participants with document-confirmed PsA-TT vaccinations (N = 159) and 91% (85–94) among those affirming not having received PsA-TT (N = 120). Among children aged 6–9 years in 2016, recall- or document-based coverage was 42%, while it had been 62% in the approximately corresponding age cohort in 2011 (Figure 1). A similar situation was observed for other age cohorts and their recall-based status. This suggested limited reliability of vaccination status information during the2013 and 2016 surveys. Consequently, the following serological analyses did not take into account an individual’s PsA-TT vaccination status, in line with the objective of the project to measure population-level seroprevalence.
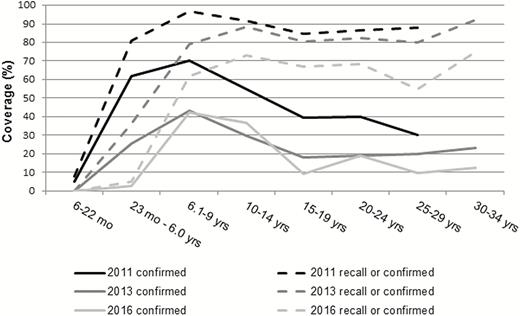
Age-specific vaccination coverage with meningococcal serogroup A conjugate vaccine (PsA-TT), administered to the 1- to 29-year-old population during a mass campaign in December 2010. Document-confirmed vaccination and status as per recall, as assessed in the 2011, 2013, and 2016 surveys in the general population of Bobo-Dioulasso, Burkina Faso.
During the 2016 survey, in the 4 age groups of >6.0–7.0 years, >7.0–10.0 years, >10.0–<15 years, and ≥15–<30 years, the following measurements were observed. The GMTs were 530, 977, 1603, and 892 for SBA-ref; GMTs were 14, 23, 406, and 89 for SBA-3125; and GMCs of IgG were 1.7, 2.8, 6.6, and 11.4 µg/mL, respectively (Figures 2–4, Supplementary Table 1). The respective seroprevalence of putatively-protective titers/concentration in 2016 was 88%, 94%, 99%, and 95% for SBA-ref; 32%, 41%, 83%, and 65% for SBA-3125; and 45%, 56%, 90%, and 95% for IgG. Compared to 2011 values, the respective relative changes in geometric means were -87%, -79%, -38%, and -44% for SBA-ref; -99%, -99%, -59%, and -78% for SBA-3125; and -89%, -77%, -65%, and -63% for IgG (no overlap of the 95% CIs around the 2011 and 2016 means, except for SBA-3125 in age group >10.0-<15 years, Supplementary Table 1).
![Comparison of inverse cumulative curves of serum bactericidal antibody (SBA) titers against reference strain (SBA-ref) across surveys of the general population of Bobo-Dioulasso, Burkina Faso. Included are only age groups that were meningococcal serogroup A conjugate vaccine (PsA-TT)–eligible during the 2010 campaign. Dotted line, pre-vaccination data (2008) from [7]. Black line, October–November 2011, 1 year after PsA-TT campaign. Dark gray line, November–December 2013, 3 years after PsA-TT campaign. Light gray line, January–February 2016, 5 years after PsA-TT campaign. Age groups are by age at time of survey. By year, the sample sizes for the 4 age groups of A >6.0–7.0 years, B >7.0–10.0 years, C >10.0–<15 years, and D ≥15–<30 years were: in 2008, 23, 65, 91, and 341; in 2011, 22, 44, 76, and 153; in 2013, 34, 48, 14, and 172; and in 2016, 60, 89, 82, and 196, respectively.](https://oup.silverchair-cdn.com/oup/backfile/Content_public/Journal/cid/68/3/10.1093_cid_ciy488/1/m_ciy48802.jpeg?Expires=1750336527&Signature=ZTLYkvUNZywQfsuFEHKu9OsHk2tq1LC0tYX3933oD7jSel6GiCxFmQ9Q~dXf~0mLm4qJvvbTr~V2sbLBuCvHdblBFNKTgN6V4MiA~4X73mso58RBnEz~1Uj3nLuSZlkH7gg6x8TPGQlQV8zdAX-bdK9VBn7RYtawK1gn9jQzlt8HTRKhqi8qdg~xpIu5rWzMHunm6PNo9eUq1YdWydHZ7gltTlMb1eoUxWb0q9adA-QF4UcTqoIlSToJlA4sREcNHqst90tn6FN9-8ELwromwvtHmn29LzKobQASGt4uc8X4P0vvSfboFQsRYCB258EoEiEvt9LFV591w8kaMhCCHw__&Key-Pair-Id=APKAIE5G5CRDK6RD3PGA)
Comparison of inverse cumulative curves of serum bactericidal antibody (SBA) titers against reference strain (SBA-ref) across surveys of the general population of Bobo-Dioulasso, Burkina Faso. Included are only age groups that were meningococcal serogroup A conjugate vaccine (PsA-TT)–eligible during the 2010 campaign. Dotted line, pre-vaccination data (2008) from [7]. Black line, October–November 2011, 1 year after PsA-TT campaign. Dark gray line, November–December 2013, 3 years after PsA-TT campaign. Light gray line, January–February 2016, 5 years after PsA-TT campaign. Age groups are by age at time of survey. By year, the sample sizes for the 4 age groups of A >6.0–7.0 years, B >7.0–10.0 years, C >10.0–<15 years, and D ≥15–<30 years were: in 2008, 23, 65, 91, and 341; in 2011, 22, 44, 76, and 153; in 2013, 34, 48, 14, and 172; and in 2016, 60, 89, 82, and 196, respectively.
![Comparison of inverse cumulative curves of serum bactericidal antibody titers against strain 3125 (SBA-3125) across surveys in the general population of Bobo-Dioulasso, Burkina Faso. Included are only age groups that were meningococcal serogroup A conjugate vaccine (PsA-TT)–eligible during the 2010 campaign. Dotted line, pre-vaccination data (2008) from [7]. Black line, October–November 2011, 1 year after PsA-TT campaign. Dark gray line, November–December 2013, 3 years after PsA-TT campaign. Light gray line, January–February 2016, 5 years after PsA-TT campaign. Age groups are by age at time of survey. By year, the sample sizes for the 4 age groups of A >6.0–7.0 years, B >7.0–10.0 years, C >10.0–<15 years, and D ≥15–<30 years were: in 2008, 23, 65, 91, and 339; in 2011, 8, 14, 26, and 56; in 2013, 10, 19, 28, and 66; and in 2016, 22, 32, 30, and 77, respectively.](https://oup.silverchair-cdn.com/oup/backfile/Content_public/Journal/cid/68/3/10.1093_cid_ciy488/1/m_ciy48803.jpeg?Expires=1750336527&Signature=pdZmTl0WT6kbSC2nKrXvVU38uNpoqeOAC7lesmey~S4JKnDO-Di--gZXMJUzg5rUOz3Fzd5MKMhOf0KRnTsTCB4HMcTa9D0MYJknEoJTpQNtaJutO2zpYVUHycXQg1Pc40YJ~RQAK56TMYVT-nz~xZ-05j0kNeu5-NtqbTN4rT~ehf-J1wT6l1rtKlRopftOko4gZZK-wSaMMyoYE~yk~ssmm0UqxP9ZvbZZ0~6QHjx~mCIypAQ7cPUHhJweZ3KYpu7r-moSjgKbTB07K6LOgen72LBo5r8HXaSauiTOAG2tLF2eSRzpujD3NIsimeoQ1~RvL2QUcq0yvtSA0BEHaQ__&Key-Pair-Id=APKAIE5G5CRDK6RD3PGA)
Comparison of inverse cumulative curves of serum bactericidal antibody titers against strain 3125 (SBA-3125) across surveys in the general population of Bobo-Dioulasso, Burkina Faso. Included are only age groups that were meningococcal serogroup A conjugate vaccine (PsA-TT)–eligible during the 2010 campaign. Dotted line, pre-vaccination data (2008) from [7]. Black line, October–November 2011, 1 year after PsA-TT campaign. Dark gray line, November–December 2013, 3 years after PsA-TT campaign. Light gray line, January–February 2016, 5 years after PsA-TT campaign. Age groups are by age at time of survey. By year, the sample sizes for the 4 age groups of A >6.0–7.0 years, B >7.0–10.0 years, C >10.0–<15 years, and D ≥15–<30 years were: in 2008, 23, 65, 91, and 339; in 2011, 8, 14, 26, and 56; in 2013, 10, 19, 28, and 66; and in 2016, 22, 32, 30, and 77, respectively.
![Comparison of inverse cumulative curves of immunoglobulin G (IgG) concentrations against meningococcal serogroup A in the general population of Bobo-Dioulasso, Burkina Faso. Included are only age groups that were meningococcal serogroup A conjugate vaccine (PsA-TT)–eligible during the 2010 campaign. Dotted line, pre-vaccination data (2008) from [7]. Black line, October–November 2011, 1 year after PsA-TT campaign. Dark gray line, November–December 2013, 3 years after PsA-TT campaign. Light gray line, January–February 2016, 5 years after PsA-TT campaign. Age groups are by age at time of survey. By year, the sample sizes for the 4 age groups of A >6.0–7.0 years, B >7.0–10.0 years, C >10.0–<15 years, and D ≥15–<30 years were: in 2008, 24, 66, 91, and 341; in 2011: 8, 15, 26, and 56; in 2013: 34, 48, 80, and 172; and in 2016, 60, 87, 82, and 196, respectively.](https://oup.silverchair-cdn.com/oup/backfile/Content_public/Journal/cid/68/3/10.1093_cid_ciy488/1/m_ciy48804.jpeg?Expires=1750336527&Signature=rw1p21knIFge9vq5y8WTbT~3Lb9mEDoxElg9AiyQ-wmIZY3NV0zDuUmE0ufti5dviBW~3t1Szjgq~sZNNW~I2jORhaWbJtB~64e4aQMRX-N8rS6AqURUwLwtrzfM12iBHNw6Sv92ZI~FtNWTd1EUXGiUg1r3hSZBq9-EltBrCoLB1arRZWb9FVNzh949IiSRfdow24Rk5nhqdAELdtL8akT1wGOk~27QrqQCn--7h-Knk6Yfu5wbxrMSA8yPEeiGslMRhFUFu0vvZdwY5-CW8Gx2-ykToKpau5Sb~wU30v8a8Xa58Z3zm9TVoSR-L-bnxr~0IWLNSEU6gg1ZxMIKXQ__&Key-Pair-Id=APKAIE5G5CRDK6RD3PGA)
Comparison of inverse cumulative curves of immunoglobulin G (IgG) concentrations against meningococcal serogroup A in the general population of Bobo-Dioulasso, Burkina Faso. Included are only age groups that were meningococcal serogroup A conjugate vaccine (PsA-TT)–eligible during the 2010 campaign. Dotted line, pre-vaccination data (2008) from [7]. Black line, October–November 2011, 1 year after PsA-TT campaign. Dark gray line, November–December 2013, 3 years after PsA-TT campaign. Light gray line, January–February 2016, 5 years after PsA-TT campaign. Age groups are by age at time of survey. By year, the sample sizes for the 4 age groups of A >6.0–7.0 years, B >7.0–10.0 years, C >10.0–<15 years, and D ≥15–<30 years were: in 2008, 24, 66, 91, and 341; in 2011: 8, 15, 26, and 56; in 2013: 34, 48, 80, and 172; and in 2016, 60, 87, 82, and 196, respectively.
When analyzing the data from the 3 surveys as a virtual cohort, geometric means in the different age groups showed a decline from 1 to 5 years post-vaccination of between -32% and -62% with SBA-ref, >-70% with SBA-3125, and between -32% and -58% with IgG (with the exception of children aged 12–23 months at vaccination, where IgG stayed stable at low levels from 2011 onwards; Table 2).
The 5-year Serological Follow-up of Virtual Cohorts, by Age at Vaccination With PsA-TT During a Mass Campaign in December 2010, and Estimation of Year and Age at Return to Values of an Unvaccinated Cohort (From Pre-vaccination Data in 2008 [7]) in General Population of Bobo-Dioulasso, Burkina Faso
| Survey | ||||||
|---|---|---|---|---|---|---|
| Oct-Nov 2011 (1 Year After) | Nov-Dec 2013 (3 Years After) | Jan-Feb 2016 (5 Years After) | Mar 2008 (Age Group as in Jan 2016) | Estimated Return to Unvaccinated Cohort: Time Since Vaccination (Age in That Year)a | ||
| Virtual age cohort (age in 2010) | 12–23 mo | exponential | linear | |||
| Age at each survey (years) | 1.8–2.8 | 3.9–4.8 | 6.1–7.0 | 6 | ||
| SBA-ref | N = 74 | N = 68 | N = 59 | N = 18 | ||
| GMT (95% CI) | 765.9 (457.0–1283.6) | 695.1 (411.7–1173.9) | 524.2 (283.7–968.4) | 149.3 (35.0–637.0) | >12 y post (after 2022) | 10 y post (age 10.5– 11.4 y in 2020) |
| SBA-3125 | N = 25 | N = 24 | N = 22 | N = 18 | ||
| GMT (95% CI) | 45.9 (14.7–142.9) | 69.8 (10.1–482.5) | 14.1 (4.2–47.5) | 3.6 (1.6–7.8) | 8 y post (age 8.3–9.2 y in 2018) | 7 y post (age 7.2–8.1 y in 2017) |
| IgG | N = 25 | N = 68 | N = 59 | N=18 | NA | NA |
| GMCb (95% CI) | 1.5 (1.0–2.4) | 1.6 (1.2–2.2) | 1.7 (1.1–2.6) | 1.6 (1.1–2.4) | ||
| Virtual age cohort (age in 2010) | 2–4.9 y | exponential | linear | |||
| Age at each survey (years) | 2.9–5.8 | 4.9–7.8 | 7.1–10.0 | 7–9 | ||
| SBA-ref | N = 102 | N = 103 | N = 87 | N = 63 | ||
| GMT (95% CI) | 2314.5 (1730.1–3096.3) | 1349.4 (938.5–1940.0) | 977.3 (659.9–1447.3) | 219.5 (110.9–434.1) | >12 y post (after 2022) | 10 y post (age 11.5– 14.4 y in 2020) |
| SBA-3125 | N = 38 | N = 37 | N = 32 | N = 63 | ||
| GMT (95% CI) | 260.7 (105.4–644.7) | 204.5 (100.7–415.2) | 22.6 (8.16–6.8) | 5.0 (3.1–8.1) | 9 y post (age 10.4–13.3 y in 2019) | 7 y post (age 8.2–11.1 y in 2017) |
| IgG | N = 37 | N = 103 | N = 87 | N = 63 | ||
| GMCb (95% CI) | 4.1 (2.6–6.3) | 2.5 (2.0–3.0) | 2.8 (2.1–3.6) | 2.41 (1.79–3.25) | NA | NA |
| Virtual age cohort (age in 2010) | 5.0 -14.9 y | exponential | linear | |||
| Age at each survey (years) | 5.9–15.8 | 7.9–17.8 | 10.1–20 | 10–19 | ||
| SBA-ref | N = 161 | N = 164 | N = 168 | N = 231 | ||
| GMT (95% CI) | 3433.2 (2911.6–4048.3) | 1766.4 (1346.0–2318.1) | 1269.0 (1087.3–1481.2) | 273.5 (198.5–376.7) | >12 y post (after 2022) | 10 y post (age 14.5– 24.4 y in 2020) |
| SBA-3125 | N = 55 | N = 59 | N = 58 | N = 229 | ||
| GMT (95% CI) | 1385.7 (1073.6–1788.5) | 589.5 (315.6–1101.3) | 232.7 (115.8–467.6) | 8.3 (6.2–11.2) | >12 y post (after 2022) | 8 y post (age 12.3–22.2 y in 2018) |
| IgG | N = 56 | N = 164 | N = 168 | N = 231 | ||
| GMCb (95% CI) | 14.8 (10.7–20.6) | 9.5 (8.0–11.3) | 7.7 (6.6–9.1) | 5.58 (4.80–6.50) | 8 y post (age 12.3–22.2 y in 2018) | 7 y post (age 11.2–21.1 y in 2017) |
| Virtual age cohort (age in 2010) | 15.0–29.9 y | exponential | linear | |||
| Age at each survey (years) | 15.9–30.8 | 17.9–32.8 | 20.1–35.0 | 20–35 | ||
| SBA-ref | N = 144 | N = 142 | N = 137 | N = 296 | ||
| GMT (95% CI) | 1455.1 (1178.3–1797.0) | 919.7 (719.1–1176.4) | 662.7 (491.2–894.2) | 291.9 (224.6–379.3) | >12 y post (after 2022) | 10 y post (age 24.5– 39.4 y in 2020) |
| SBA-3125 | N = 53 | N = 52 | N=59 | N = 294 | ||
| GMT (95% CI) | 336.9 (183.6–618.2) | 164.9 (94.1–288.9) | 79.1 (35.8–174.7) | 12.34 (9.22–16.52) | >12 y post (after 2022) | 8 y post (age 22.3–37.2 y in 2018) |
| IgG | N = 53 | N = 142 | N = 137 | N = 294 | ||
| GMCb (95% CI) | 32.4 (24.8–42.4) | 14.8 (11.9–18.4) | 13.5 (11.4–15.9) | 9.82 (8.48–11.37) | 11 y post (age 25.6– 40.5 y in 2021) | 10 y post (age 24.5– 39.4 y in 2020) |
IgG was against serogroup A.
Abbreviations: CI, confidence interval; GMC, geometric mean concentration; GMT, geometric mean titer; IgG, immunoglobulin G; NA, not applicable, as return to 2008 titers was observed during surveys; PSA-TT, meningococcal serogroup A conjugate vaccine; SBA-3135, serum bactericidal antibody against 3125 strain; SBA-ref, serum bactericidal antibody against reference strain.
aTime since vaccination and age in the year when the virtual cohort will have geometric means similar to 2008 pre-vaccination levels (similar being defined as not superior by >5%). Exponential and linear extrapolation based on antibody decline observed between 2013 and 2016 (see also Supplementary Figure 1). For example, the virtual age cohort “12–23 months at the time of the PsA-TT campaign in 2010” consisted of children aged 1.8–2.8 years in the 2011 survey, 3.9–4.8 years in the 2013 survey, and 6.1–7.0 years in the 2016 survey. In January–February 2016, the virtual cohort’s GMT can be compared to GMTs observed in 2008 within the 6-year-old children (age assessed in full years), while for 2018, they would be compared to GMTs within the 8-year-old age group.
bMeasured as µg/mL.
Based on exponential extrapolation of the decline between the 2013 and 2016 surveys, we estimated that GMTs similar to pre-vaccination levels based on SBA-ref should be present >12 years after the campaign (after 2022) in all age groups. Based on SBA-3125, among children aged 12–23 months and children aged 2–4 years at the time of the PsA-TT campaign, we predicted GMTs should be similar to pre-vaccination levels at 8 and 9 years after the campaign (2018 and 2019, respectively), while for older age groups, we predicted a return to pre-vaccination levels only after 2022. GMC levels observed in the 2016 survey for children under 5 during the PsA-TT campaign were similar to pre-vaccination levels; we predicted pre-vaccination levels should be reached after 8 and 11 years after the campaign in the 5–14 and 15–29 year groups, respectively (Table 2).
In extrapolation, assuming a linear decline from 2013–2016 onwards, GMTs similar to pre-vaccination levels should be expected, across age groups, after 10 years for SBA-ref and after 7–8 years for SBA-3125.
All surveys included a group of children who were too young for PsA-TT vaccination (<1 year in 2010) or not born by December 2010: these children were 6–22 months in 2011, 6 months–3.9 years in 2013, and 6 months–6.0 years in 2016. Among them, SBA-ref titers (GMT and seroprevalence) did not show a declining trend during the years following PsA-TT mass vaccination compared to 2008 pre-vaccination levels, while the higher titers among the age group of 22 months–3.9 years in 2013 suggested that some children <1 years in 2010 may have received PsA-TT (Supplementary Table 2).
IgG mean concentrations in the 6–22 month age group decreased from 1.4 µg/ml (95% CI, 1.2–1.7) in 2008 to 0.7 µg/mL (0.5–0.9) in 2011, and stayed this low throughout 2016. Prevalence of IgG ≥2 µg/ml declined from 32% (23.1–42.0) to 7% (1.6–26.4), and also stayed this low throughout 2016. Similarly, however statistically insignificant, differences were observed among age groups of 22 months–3.9 years and >3.9–6.0 years.
DISCUSSION
This serological study contributes to the evaluation of PsA-TT’s long-term impact in the African meningitis belt. We found that, in an urban population of Burkina Faso, 5 years after PsA-TT introduction through a mass campaign with high coverage, the geometric means of all 3 evaluated serological indicators in all age groups had substantially declined compared to post–1 year levels, while the seroprevalence of putatively-protective SBA-ref titers remained high (>88%). However, other serological indicators—SBA-3125 and IgG—showed only moderate seroprevalence (about 30-55%) among children up to 10 years of age, which was the group that was <5 years old at the time of vaccination.
Several clinical trials in Mali, The Gambia, and Senegal have evaluated the persistence of SBA-ref and IgG antibodies following 1 dose of PsA-TT. Among children vaccinated at ages 12–23 months, a -81% decline in SBA-ref GMTs during the first 9 months post-vaccination was observed, but the GMT and IgG geometric means reported at the end of the 9-month and 12-month follow-ups were roughly comparable to our levels at 1 year post-vaccination [5, 8]. The same trial further reported that between 2 and 5 years after vaccination, no further decline of SBA or IgG geometric means occurred in participants who had not received a booster [5], which is in contrast to the -32% decline of SBA-ref GMT (-69% of SBA-3125) we observed in the virtual cohort of this age (within the limits of a relatively small sample size). For individuals vaccinated by 1 PsA-TT dose at >2–29 years, Diallo et al. reported that, after an initial decline during the first 6 months (12 months for IgG), geometric means and seroprevalence were stable up to 4 years post-vaccination [6]. While levels at 1 year post-vaccination were largely comparable in our study, we found substantially lower geometric means and seroprevalence (SBA-ref, SBA-3125, and IgG) at 5 years after the campaign, particularly among children. For SBA-3125 among children, we found an even more pronounced decline than for SBA-ref, but no data from other studies are available for comparison. Based on experience with another monovalent (serogroup C) meningococcal conjugate vaccine, an antibody kinetic with an initial pronounced decline, followed by a slower continuous decline over several years, could be expected [13].
Several aspects should be considered when comparing the vaccine evaluation data from clinical trials and the general population. First, logistic issues can occur during mass campaigns, as illustrated by the difficulties in providing PsA-TT vaccination documentation [10]. Cold-chain deficiencies may have occurred, although MenAfriVac has been found to be relatively robust to ambient temperature [14] and the 1-year antibody levels were comparable to trial data. Second, the high-coverage mass campaign likely substantially reduced circulation of NmA in the population, as supported by carriage studies [15] and our observation that, compared to the 2008 baseline, IgG GMCs were lower in infants not targeted by the campaign or born after 2010. The absence of natural boosting in an entirely-vaccinated population may have impacted antibody persistence after PsA-TT, while clinical trial participants (followed up until 2011, the time when PsA-TT was introduced in the trial countries; http://www.meningvax.com/clinical-persistence.php) still were exposed to naturally-circulating NmA. However, other cross- reactive organisms, such as Bacilluspumilis, may play a role in natural boosting, as well [16]. Finally, trial participants usually are not representative of the general population, and although the clinical trials and our study were carried out on urban and peri-urban populations, some determinants of antibody persistence may have differed. Malnutrition is usually incriminated as an immune modulator [17], and although we excluded visibly malnourished persons, 7% of children participating in the 2011 survey had anthropometric measures corresponding to malnutrition. Little is known about factors influencing the persistence of anti-meningococcal antibodies, including the ecology of pathogens in the population that may impact the immune system. With the goal of controlling meningococcal disease globally, the factors influencing individual antibody persistence need to be better understood.
A key aspect for the interpretation of our data is the question of which serological indicator to consider for persistence of vaccine-induced protection. No confirmed correlate of protection exists for NmA, and the SBA-ref titers of 8 or 128 showed seroprevalence >70% among unvaccinated persons in the African meningitis belt, without preventing epidemics [7, 8]. Accordingly, in our series of surveys, little differences in seroprevalence were observed with SBA-ref ≥128 before vs. after vaccination (6–29 years: 72–83% in 2008 vs. 98–100% in 2011) or in comparing vaccine-eligible and ineligible groups (eg, age group 22 months–3.9 years in 2011 vs. 2013: 94% vs. 85%). More pronounced differences were observed for SBA-3125 ≥128, both before vs. after vaccination (6–29 years: 4–30% in 2008 vs. 88–100% in 2011) and in comparing eligible and ineligible groups (eg, age group 22 months–3.9 years in 2011 vs. 2013: 61% vs. 19%). SBA-3125 has been presented as an indicator that would be more specific for vaccine-induced antibodies and, thus, the protection conferred by vaccination [7, 9]. Based on SBA-3125, we observed a faster reduction of seroprevalence and GMT than by SBA-ref across the different surveys. In consequence, direct protection provided by PsA-TT in Burkina Faso would be expected to disappear after 8 years among children aged <5 years at PsA-TT vaccination, and after 12 years for older age groups. This analysis focused on a complete return to pre-vaccination seroprevalence, while seroprevalence of titers blocking transmission, and thus providing indirect protection, may have waned earlier. However, our understanding of correlates against carriage is even more limited [18–20], but salivary antibodies may be an interesting indicator to use in future studies [21]. Most importantly, the overall risk of epidemics arising with the current seroprevalence levels will depend on the likelihood of reestablished NmA circulation in Burkina Faso and the African meningitis belt. Finally, conjugate vaccine could, in theory, induce other non-humoral immunities, which would provide protection from disease despite low antibodies.
Our study did not follow a cohort of vaccinated persons to evaluate antibody persistence, but repeated surveys in the general population. This real-life evaluation was complementary to clinical trials, and allowed the evaluation of the effective prevalence of susceptibles over time, with the potential to support a decision for booster campaigns. It was not designed to evaluate the vaccine in itself. In particular, the secondary analysis as a virtual cohort could not be compared to longitudinal data from trials, as it models mean titer changes in age groups instead of following individuals over time. In addition, there are several specific concerns. First, our virtual-cohort analysis was not sufficiently powered to identify significant changes among children aged 12–23 months at vacccination, although geometric means suggest changes may exist. Second, our virtual cohort was diluted with persons that had not received PsA-TT in 2010, due to imperfect coverage or because they resided outside Burkina Faso. However, this effect should be limited, given the near-complete coverage reported from the mass campaigns [13] and the limited immigration of unvaccinated persons (8.2%). Also, as we did not aim to evaluate the PsA-TT vaccine, but to follow the evolution of population protection to inform vaccination strategies, the inclusion of immigrating individuals was essential. Finally, we extrapolated the time of return to pre-vaccination levels following an exponential function, assuming a continuous slope of decline as that observed between the 3-year and 5-year post-vaccination surveys. This was in line with evidence on meningococcal antibody kinetics [13], but may over- or underestimate the actual speed of decline.
The important question is whether booster campaigns should be conducted for children aged <5 years at the time of the PsA-TT campaign. Public health decision-makers should take the present data into account when designing strategies for meningitis control in the meningitis belt, along with financial and programmatic considerations. Individual countries’ protection following PsA-TT campaigns will also depend on the levels of immigration of unvaccinated persons. The birth cohorts from our study suggested that young children may again be at risk for NmA meningitis, but may be indirectly protected by older age groups, by the recent catch-up campaigns, and by the routine immunization of infants. However, these birth cohorts will soon reach adolescence, the age of high risk for meningococcal carriage and disease in the meningitis belt, including during NmA epidemics [7, 19]. Following this argument and pending 10-year persistence estimates, booster vaccination after 10 years could be considered for persons aged 5–14 years at the time of their PsA-TT vaccination, to avoid the accumulation of susceptibles among young adults. A conjugate vaccine that includes 5 meningococcal serogroups (A-C-W-Y-X) is being developed for the meningitis belt [3], and its introduction could coincide with such a booster campaign. Given the uncertainty about the relevant indicator and protective antibody titers, and given the study design with ecological comparisons over time, these data alone cannot be used to prove the need for booster vaccination following PsA-TT. Ideally, clinical trials with long-term follow-ups within populations after PsA-TT campaigns, which include measuring SBA against the 3125 strain, should evaluate this question. Further consideration should also be given to antibody kinetics over time (which may not be best represented by exponential or linear decay). To better predict protection from transmission, future evaluations of meningococcal conjugate vaccines in the meningitis belt should include assessments of SBA-3125, of risk factors for rapid antibody losses, and of correlates of mucosal protection.
Supplementary Data
Supplementary materials are available at Clinical Infectious Diseases online. Consisting of data provided by the authors to benefit the reader, the posted materials are not copyedited and are the sole responsibility of the authors, so questions or comments should be addressed to the corresponding author.
Notes
The following authors have changed affiliations since the project work: J. S. works at the Département de Seine Saint Denis (France); C. M. at the Swiss Tropical and Public Health Institute (Switzerland); B. G. at Pfizer Vaccines (Collegeville, PA); and N. M. at the Ministry of Health (Burkina Faso).
Acknowledgments. The authors thank the study team of field, clinical, and laboratory workers and administrative staff for their valuable contributions to the study. In particular, we thank Dr Régina Idohou and Dr Sita Kroman for the coordination of the survey implementation and study monitoring. We thank Marie-Pierre Preziosi (World Health Organization) for helpful comments during the project conduct.
Financial support. This work was supported by a grant from the Meningitis Research Foundation, Bristol, United Kingdom (grant N°1101.0).
Potential conflicts of interest. H. T. works for and B.-M. N. L., C. M., and B. G. worked until recently for Agence de Médecine Préventive, which received unrestricted support from Sanofi-Pasteur and grant-specific support from manufacturers of vaccines against bacterial meningitis, including GSK, Pfizer, and Sanofi-Pasteur. B.-M. N. L. received grants from the Meningitis Research Foundation during the conduct of the study and grants from Crucell, GSK, Hilleman Laboratories, Merck, Novartis, and Sanofi outside the submitted work. B. G. received grants from the Meningitis Research Foundation during the conduct of the study and other support from Pfizer Vaccines outside the submitted work. R. B. and H. F. perform contract research on behalf of Public Health England for GSK, Pfizer, and Sanofi Pasteur. C. T. received a consulting payment from GSK in 2013, an honorarium from Sanofi Pasteur in 2015, and consultancy fees and grants paid to her institution from the World Health Organization. All other authors report no potential conflicts. S. Y., O. A., H. K., J. B. O., and N. M. were employees of Centre MURAZ, an institution that received a Subgrant from Agence de Médecine Préventive. J. E. M. worked for and J. S. was hired by Ecole des Hautes Etudes en Santé Publique, an institution that received a Subgrant for J. S.'s employment by Agence de Médecine Préventive. All authors have submitted the ICMJE Form for Disclosure of Potential Conflicts of Interest. Conflicts that the editors consider relevant to the content of the manuscript have been disclosed.

